


 Login
 Blog
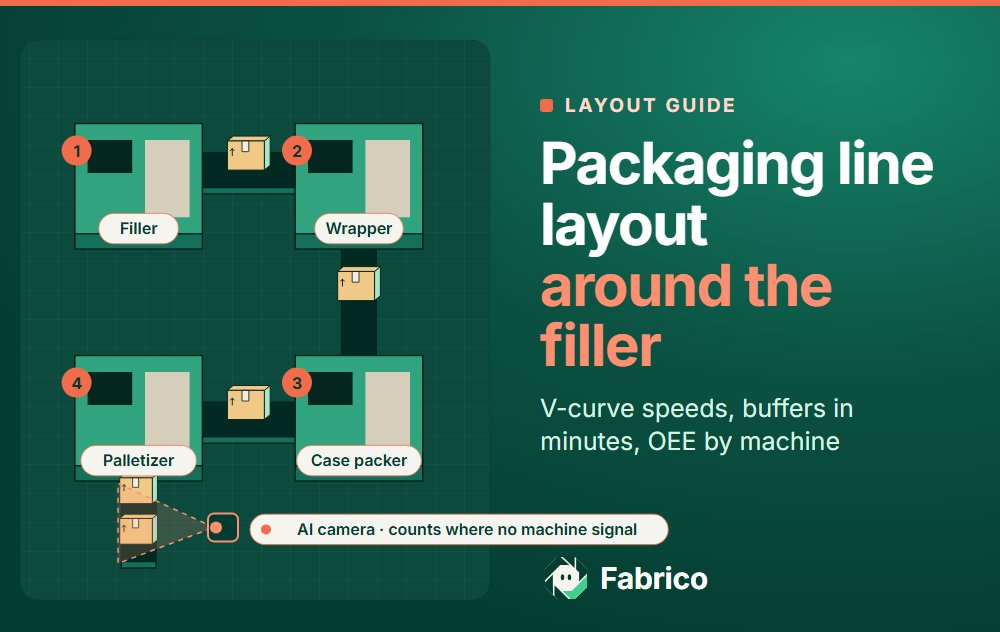
Packaging Line Layout: Keep the Filler Running With a V-Curve

In short: a good packaging line layout starts at the key machine, usually the filler: rate every other machine faster in a V-curve, size the accumulation between machines in minutes of filler output, count at the filler, then check the layout with OEE by machine once it runs.
- Machines either side of the filler run at 105 to 120% of its speed, more so further away (sample figures).
- Buffers before the filler stay almost full; buffers after it stay partly empty.
- On a sample 500 a minute beer line, one 2.5-minute buffer is worth EUR 119,622 a year in the base case.
- Count at the filler and each reject where it is made.
Most packaging line design starts with the floor plan. Then the new line can run well below rated speed, because it was drawn around the building, not around the machine that sets the pace.
Volumes are large: EU countries produced 34.7 billion litres of beer in 2024, alcoholic and low or no alcohol together (Eurostat), roughly 105 billion bottle equivalents at 0.33 litres. The example here is a beer line; the rules hold for water or sauces.
Packaging line layout starts at the key machine
Every high-speed packaging line has one machine the rest is built around, and on a bottling line it is nearly always the filler. A Delft University of Technology report on packaging line efficiency, written around brewery lines, calls the filler the core machine: the rest of the line is designed around it, and other equipment is sized so the filler does not stop because of failures elsewhere (Härte, Efficiency Analysis of Packaging Lines, Delft University Press, 1997).
It is usually the most expensive machine, a stop leaves product in the bowl and off-level bottles after restart, and it cannot run faster to catch up. The same report notes that sometimes the pasteuriser is taken as the core machine instead; on a pouch line it may be the form-fill-seal machine. Name it first, on the drawing. If you are not sure which machine limits the line today, see finding the real constraint on linked packaging lines. Work content at manual stations belongs to line balancing, and how that job differs from this one is set out in line design vs line balancing. Whether a flow layout suits the product at all is the question in process layout vs product layout.
The V-curve: machine speeds stepped up away from the filler
Set every other rated speed against the filler. The machines either side are faster, and each machine further away is faster again. Plot the speeds in line order and the chart is a V with the filler at the bottom; the Delft report calls it the V-graph and puts it at the centre of a line's buffer strategy.
The extra speed is what lets a machine catch up. When the labeller jams, bottles keep arriving into the buffer in front of it; when it restarts, it must clear that buffer while bottles keep coming. The report's arithmetic: recovery time is the accumulated time times the line speed, divided by the speed difference. A 2-minute jam on a 500 a minute line leaves 1,000 bottles. A labeller rated at 550 clears 50 extra a minute, so 2 x 500 / 50 = 20 minutes. Rated at 525, it needs 40.
More overcapacity costs more machine; less needs more accumulation. The sample uses steps of 5 to 20%.
Bottling line layout example: a 500 a minute beer line
Sample figures for illustration only. A one-way glass line for 0.33 litre bottles, rated at 500 a minute at the filler and crowner. How OEE is read on such a line once it runs is covered in OEE for brewery packaging lines.
| Machine | Rated speed, bottles/min | % of filler | Buffer after it, minutes (bottles) |
|---|---|---|---|
| Depalletiser | 600 | 120% | 1.5 (750) |
| Rinser | 550 | 110% | 2 (1,000) |
| Filler and crowner | 500 | 100% | Transfer only |
| Tunnel pasteuriser | 525 | 105% | 2.5 (1,250 of space) |
| Labeller | 550 | 110% | 3 (1,500 of space) |
| Case packer | 575 | 115% | 2 (1,000 of space) |
| Palletiser | 600 | 120% | End of line |
The beer line detail that moves the buffer
In the Delft report's one-way bottle line, bottles stay in the tunnel pasteuriser for 45 to 60 minutes. A pasteuriser cannot accumulate: when the labeller jams, its outfeed blocks at once, and a stopped pasteuriser holds close to an hour of filled beer that keeps heating. So put the space for labeller stops after the pasteuriser, and rate the pasteuriser just above the filler, so neither the pasteuriser nor the filler stops for a labeller jam.
A textbook V is only a start: a 2020 Delft thesis simulating a one-way bottling line found that where the largest amount of buffer capacity needs to be placed depends on the reliability of the machines. Protect the machine that stops most, per its stop data.
Accumulation between machines, sized in minutes of the filler's output
State every buffer in minutes of filler output: 1,250 bottles is 2.5 minutes at 500 a minute. Minutes tell you which stops the filler rides through; check the largest format too.
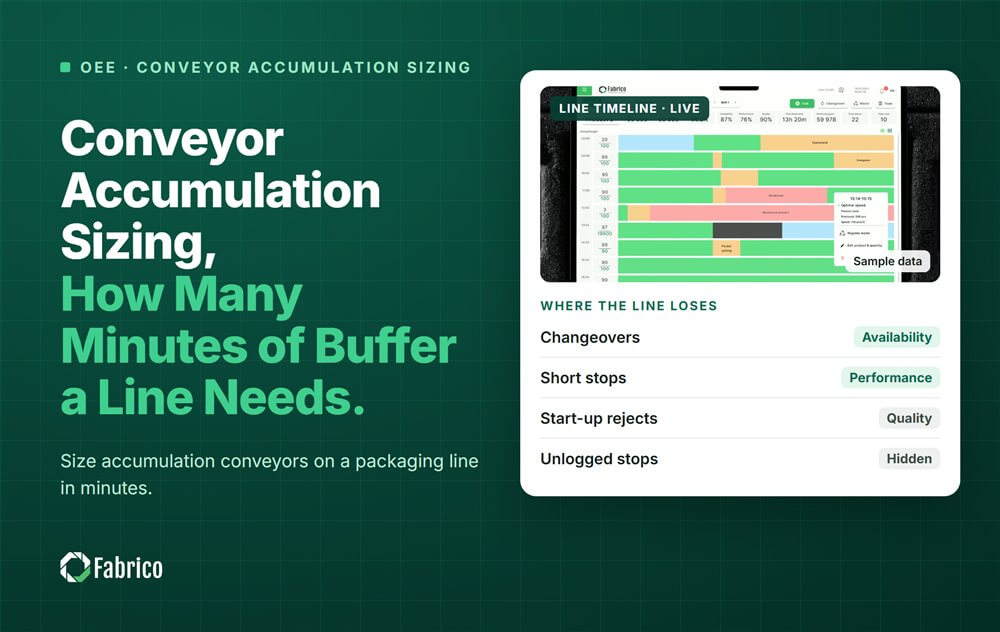
Buffers have a direction. The Delft buffer strategy keeps buffers before the core machine almost full and buffers after it partly empty, so the filler always has bottles at its infeed and space at its discharge. The same report says buffers should cover stops of a few minutes and shorter, not longer ones: a 20-minute labeller fault reaches the filler whatever you build. The sizing method is in conveyor accumulation sizing, and how stops travel along the line in starvation and blocking.
Worked example: a 2-minute labeller jam with and without a buffer
Sample figures for illustration only. The beer line runs an 8-hour shift: 480 planned minutes, 240,000 bottles at rated speed. Other stops take 25 minutes, the filler runs at 96% of rated speed, 1.25% of filled bottles are rejected, and the labeller jams 12 times for 2 minutes, about every 40 minutes.
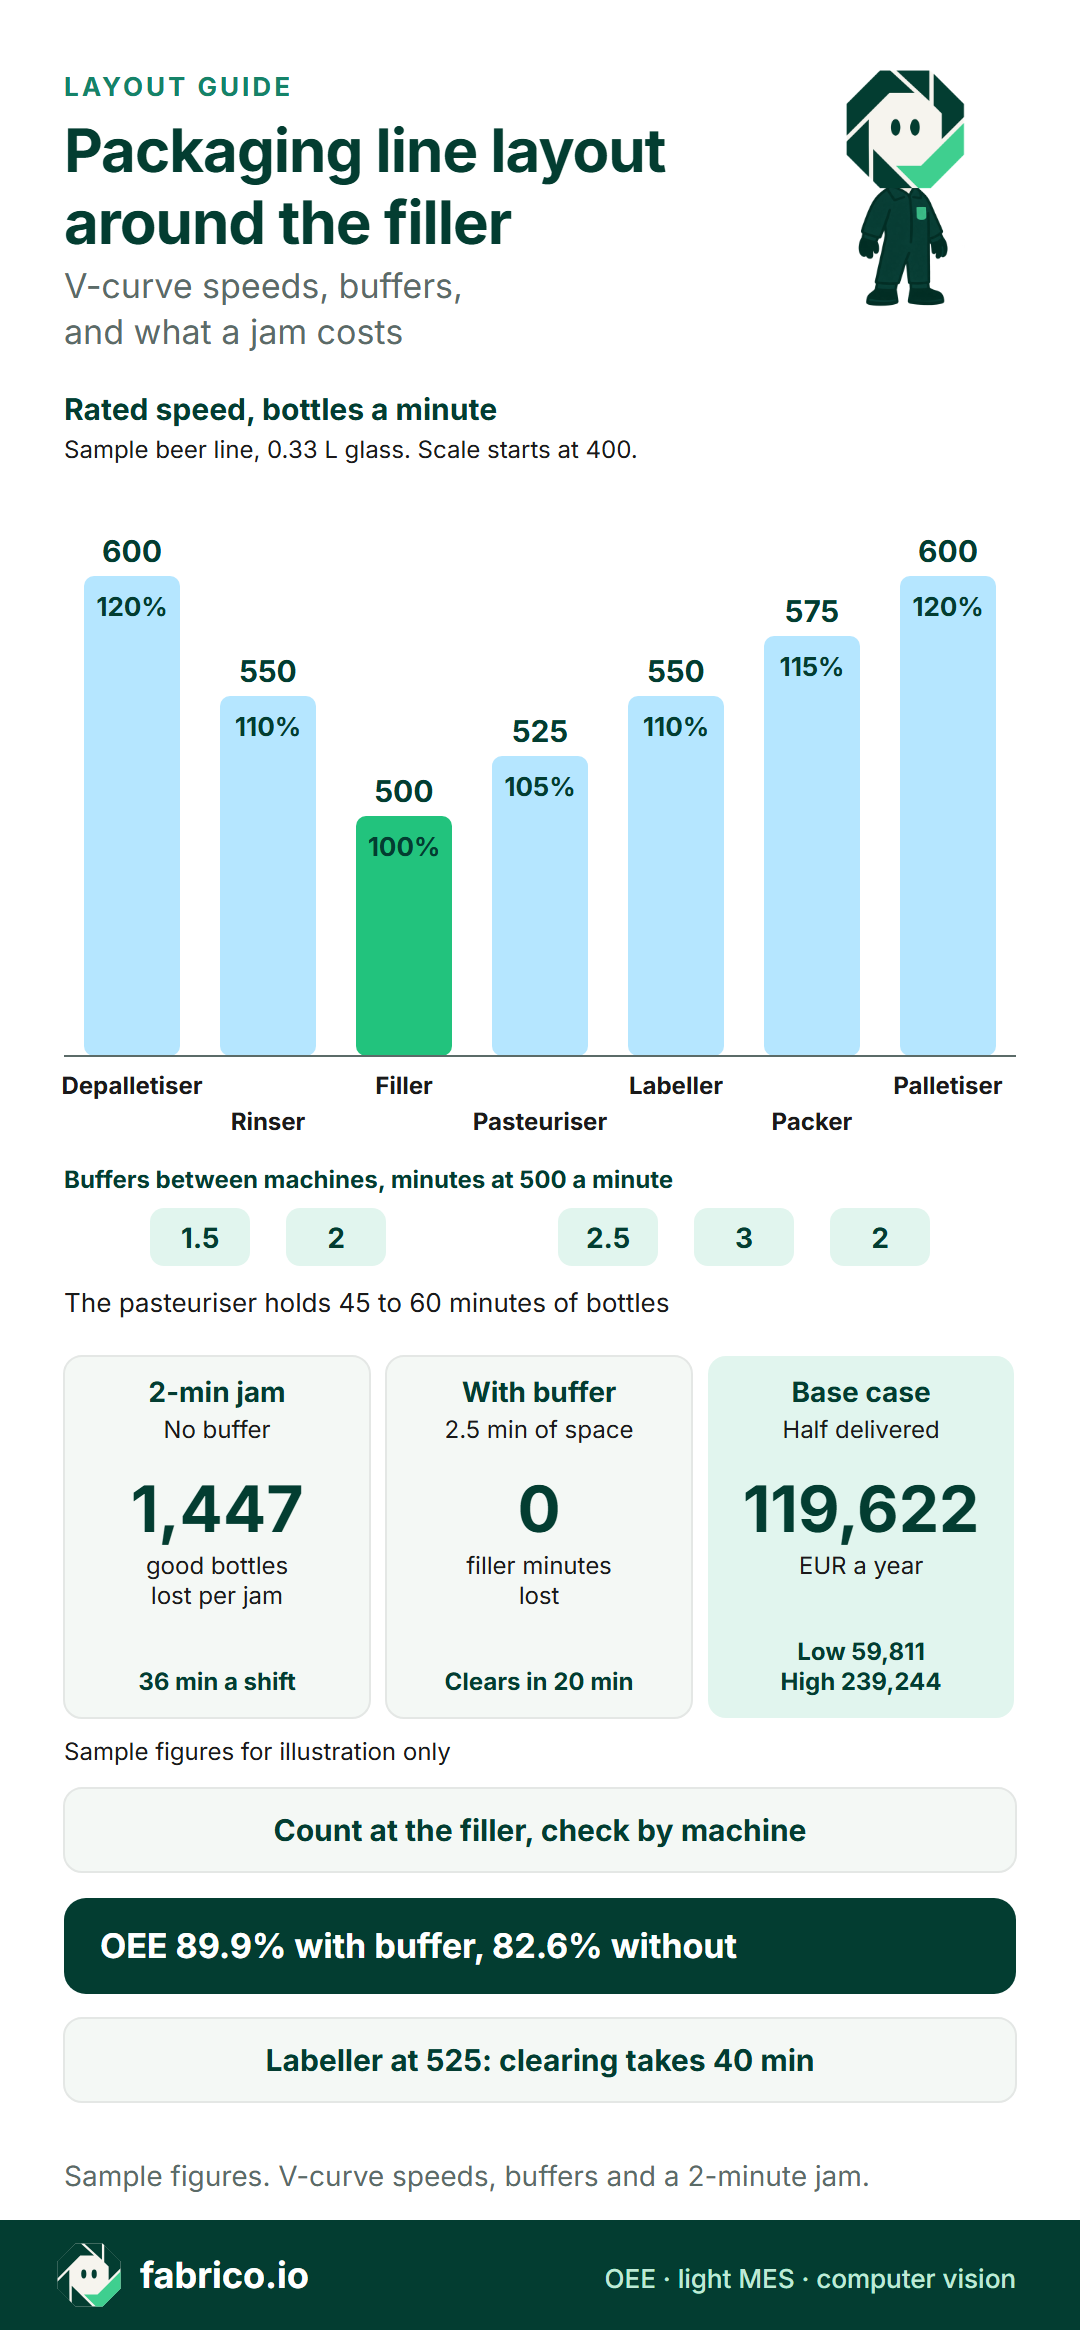
Text version of this infographic
- Card title: packaging line layout around the filler.
- Rated speeds, bottles a minute (sample, 0.33 L glass): depalletiser 600, rinser 550, filler 500, pasteuriser 525, labeller 550, packer 575, palletiser 600; 120, 110, 100, 105, 110, 115 and 120% of the filler.
- Buffers in minutes at 500 a minute: 1.5 and 2 before the filler; 2.5, 3 and 2 after the pasteuriser. The pasteuriser holds 45 to 60 minutes of bottles.
- A 2-minute labeller jam without a buffer: 1,447 good bottles lost per jam, 36 filler minutes a shift. With the 2.5-minute buffer: 0 filler minutes lost; the buffer clears in 20 minutes.
- Base case, half delivered: EUR 119,622 a year; low EUR 59,811, high EUR 239,244.
- OEE at the filler: 89.9% with the buffer, 82.6% without. With the labeller at 525, clearing takes 40 minutes.
Case A, 2.5-minute buffer after the pasteuriser. Each jam fills 1,000 of 1,250 bottles of space; the filler never stops and the labeller clears the buffer in 20 minutes. Run time 455 minutes, A = 455 / 480 = 94.79%. Filled 455 x 500 x 0.96 = 218,400, P = 96%. Rejects 2,730, good 215,670, Q = 98.75%. OEE = 0.9479 x 0.96 x 0.9875 = 89.9%; check 215,670 / 240,000 = 89.9%.
Case B, transfer conveyor only. Each jam blocks the filler for 2 minutes plus a 1-minute restart, with 25 fill-level rejects after each restart. Run time 455 minus 36 = 419 minutes, A = 87.29%. Filled 419 x 500 x 0.96 = 201,120, P = 96%. Rejects 2,514 plus 300 restart rejects, good 198,306, Q = 98.60%. OEE = 0.8729 x 0.96 x 0.9860 = 82.6%; check 198,306 / 240,000 = 82.6%.
| One shift, sample figures | A: 2.5-min buffer | B: no buffer | Difference |
|---|---|---|---|
| Filler minutes lost to jams | 0 | 36 | 36 |
| Availability | 94.79% | 87.29% | 7.5 points |
| OEE at the filler | 89.9% | 82.6% | 7.2 points |
| Good bottles | 215,670 | 198,306 | 17,364 |
What the buffer is worth: low, base and high
No public source gives a price per bottle at the brewery gate, so net revenue is a sample: EUR 0.30 per 0.33 litre bottle. It sits close to the group average in the same Carlsberg statement: revenue of DKK 89,095 million on 148.0 million hectolitres in 2025 is about DKK 602 a hectolitre, or about EUR 0.27 per 0.33 litre at 7.46 kroner to the euro, soft drinks included. The margin is sourced: Carlsberg's 2025 financial statement reports an operating margin of 15.0% and a gross margin of 45.2%. Valuing a lost sale at the operating margin gives EUR 0.045 a bottle, a floor, since a sold-out line loses contribution closer to the gross margin. Labour is sourced too: an hour worked in EU-27 manufacturing cost EUR 35.0 on average in 2025, from EUR 10.20 in Bulgaria to EUR 55.00 in Denmark (Destatis, from Eurostat data).
In the sold-out summer, 17,364 lost bottles x EUR 0.045 = EUR 781.38 a shift, EUR 65.12 per jam. Out of season the 36 minutes cost crew time to make up: 0.6 hours x 4 people x EUR 35.0 = EUR 84.00 a shift. At 63 shifts a month, 756 a year, with 4 sold-out months (252 shifts) and 504 others, a buffer that recovers all of the modelled loss is worth EUR 239,243.76 a year. Jams vary, so the base case assumes half: EUR 119,621.88 a year. The low case, a quarter, is EUR 59,810.94.
Sensitivity: at a labeller speed of 525, recovery takes 40 minutes, the gap between jams, so early jams block the filler and the line drifts towards case B. Three-minute jams each block the filler for half a minute plus a restart even with the buffer. For per-minute costing, see the cost of downtime per minute.
Ways to check a layout with data, before and after the build
A layout is a prediction: test it against stop data from similar machines before the build, and against the line itself after start-up. Hours below are sample estimates for one line, costed at the EU manufacturing rate of EUR 35.0.
| Route | Hours of plant time | Cost range | Accuracy and what it misses | When it is enough |
|---|---|---|---|---|
| Stopwatch and paper audit | About 48: 2 people, 3 shifts | About EUR 1,680 | Good on long stops; misses most stops under a minute and starved or blocked cause | One-off check before relaying an existing line |
| Spreadsheet from shift sheets | About 37 a month | About EUR 1,295 a month | Rounded, written after the fact; short stops and machine states rarely recorded | Slow lines with few, long stops |
| Line software with OEE by machine | Install hours quoted per machine; little ongoing | Ask each vendor for a price per line per month | Timed states and counts from the machine signal; reasons depend on operators coding them | High-speed linked lines, or proving a buffer works |
| Integrator or simulation study | About 16 to 24 to supply and review data | EUR 560 to 840 plus the study fee | Only as good as the stop data fed in; a design-time view | A new line or major relayout, before ordering |
| Machine maker's line system | Low if it ships with the line | Quoted with the line | Covers its maker's machines; ask how others and manual stations are counted | Lines where one maker supplies every machine |
The spreadsheet hours are 20 minutes a shift over 63 shifts plus 4 hours a week to compile. Who should pick which: a plant relaying one slow line with long, obvious stops can do it with a stopwatch and a spreadsheet. A new high-speed line justifies a simulation study before ordering, then measurement by machine from the first shift. A linked line with several machine makers needs data that treats every machine alike.
Five questions for any vendor, ready for an RFQ:
- Can each machine's stops be coded as its own fault, starved or blocked, from the machine signal plus the operator's reason, and reported apart?
- Can the filler and its two neighbours be shown on one timeline, with stop times to the second, so a buffer's recovery can be read off?
- Can each reject be assigned to the machine that made it, rather than to the line?
- Can rated speed be set per machine, so filler performance is measured against the filler's own ideal rate rather than the line's?
- Can raw events (machine, state, start, end, reason, count) leave through an API or CSV, so your engineers can check buffer sizing themselves?
Tools compared on such questions: OEE software for high-speed packaging lines. Want to see a filler and its neighbours on one timeline? Book a demo and see counts and stop reasons turn into OEE by machine and shift.
Where counters and reject points go, so OEE lands on the right machine
The drawing should show every count. With only a palletiser case count, the filler's losses vanish into the average.
Timing is the second reason to count at the filler. The same Delft report notes that output at the end of the line trails production at the filler by a time difference that includes the 45 to 60 minutes of pasteurisation. A case count at the palletiser therefore books the filler's losses up to an hour late: against the wrong hour, and near a shift change against the wrong shift and crew.
- At the filler: infeed and outfeed counts, plus its states: running, own fault, starved, blocked. Line OEE is measured here.
- At each reject point: fill-level and closure rejects belong to the filler, label rejects to the labeller. Count each before the next counter.
- At the end of the line: a case count, converted to bottles, to reconcile good output.
- At the neighbours: run and stop states for pasteuriser, labeller and packer, so a blocked filler can be traced.
Write down whether starved and blocked time counts against the filler's availability or sits apart, and keep it the same on every line; see OEE calculation and filler OEE on a bottling line, and separate reduced speed loss from minor stops, since short stops are what buffers absorb. With counts placed this way, OEE software measures the layout from the machine signal: stops and counts come from the PLC or an IoT device with sensors, and the operator adds the stop reason at the line.
What you see: a shift timeline, unclassified time waiting for a reason, and the operator's line-down screen, on sample lines. Book a demo.
Plays from YouTube. Google may set cookies when you press play. Privacy policy.
Straight, L or U: choosing a packing line layout
Shape decides walking, cart space and cleaning access.
| Layout choice | When it fits | Risk | What to measure |
|---|---|---|---|
| Straight (I) | Long hall, goods in at one end, dispatch at the other | Long walks; one operator cannot cover two machines | Time from a stop to the first operator at the machine |
| L shape | Hall too short for a straight run | A corner conveyor that jams, or a buffer squeezed by the turn | Corner conveyor stops; filler blocked time after them |
| U shape | Infeed and outfeed share a wall or dock; small crew | No room for carts or cleaning inside the U | Changeover and cleaning time against plan |
| Two lines sharing an end of line | Palletiser with spare capacity for both | One stop blocks both lines | Blocked time on both fillers at the same timestamps |
Walking is what most drawings forget. On a straight line the filler operator may be 20 metres from the labeller, so a short labeller stop waits for the walk. A U puts filler, labeller and packer within a few steps, if no conveyor sits in the path; an operator who must step over one is no faster than on a straight line. Measure it after start-up as the time from a stop to the first operator, by machine and shift.
Changeover and cleaning access
Changeover carts need parking next to the machine, not behind a conveyor. Draw the changeover, then measure it, as the guide to changeover time describes.
Cleaning sets hard limits. EU food hygiene law requires that equipment food touches be effectively cleaned and, where necessary, disinfected, often enough to avoid contamination (Regulation (EC) No 852/2004, Annex II, Chapter V, legislation.gov.uk copy). That needs room on both sides of the filler, floors draining away from the line and no conveyor boxed against a wall. For design detail, EHEDG's catalogue lists hygienic design of packing systems for solid foodstuffs as Doc. 29, beside its conveyor system guidelines. Plan clean-in-place time too; see CIP time in OEE.
Guarding belongs on the same drawing. In UK food and drink, HSE reports that conveyors are involved in 30% of all machinery accidents, more than any other machine class, mostly at well known hazards such as in-running nips, and that interlocked guards make frequent hygienic cleaning easier. OSHA's US rule requires that one or more methods of machine guarding shall be provided against hazards such as ingoing nip points. Leave room for every guard to open; see machine guarding.
Packaging line layout mistakes and what each costs the sample line
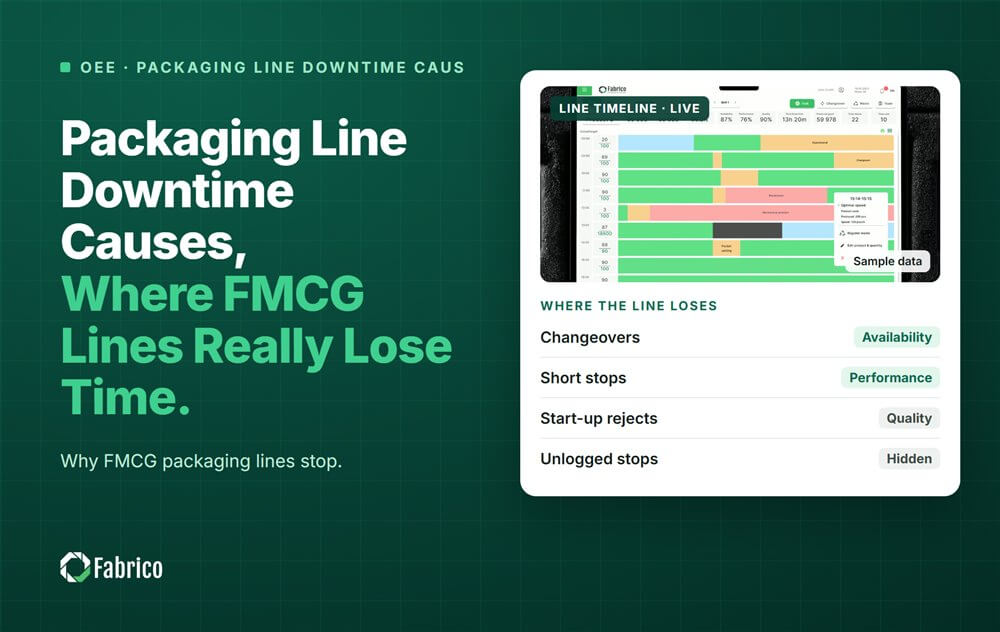
Each shows in machine data within weeks. The last column prices it on the 500 a minute beer line above. For wider losses, see packaging line downtime causes.
| Layout mistake | How it shows in machine data | What it costs on the sample line |
|---|---|---|
| Labeller rated close to the filler | Buffer still part full when the next jam comes; filler blocked by it | At 525, 40 minutes to clear, the gap between jams: the line drifts towards case B, up to 36 filler minutes a shift |
| Buffer sized in bottles, not minutes | Filler blocked by short stops on one format only | Each 2-minute jam that escapes the buffer: 1,447 good bottles, EUR 65.12 of margin when the line is sold out |
| Space before the pasteuriser, none after | Pasteuriser stops after labeller jams, then filler blocked time | 12 pasteuriser stops a shift, 24 minutes, each with close to an hour of beer heating inside |
| Only counter at the palletiser | Line OEE moves, nobody can say which machine | The 7.2 OEE points between case A and B with no machine to pin them on |
| Reject point after a counter | Good count higher than cases shipped | Case B's 300 restart rejects a shift counted as good |
| Labeller boxed in behind a conveyor | Slower response to short stops there | 30 seconds of extra walk turns a 2-minute jam into 1,250 bottles: the 2.5-minute buffer is full |
The fixes follow from the rows: raise the downstream machine's speed or add space, restate buffers in minutes per format, move the space after the pasteuriser, count at the filler with states at each neighbour, count each reject where it is made, and move the walkway or add a crossing.
In the first shifts after start-up, take three readings by machine and compare them with the drawing:
- Filler blocked and starved time, by cause. Blocked time after labeller stops means the buffer after the pasteuriser lacks space or the labeller is too slow.
- Buffer recovery after a neighbour stops, against the formula: 20 minutes on the sample line. Longer means the real speed difference is smaller than rated.
- Stops at the faster machines. They should stop more often than the filler without stopping it; if their stops line up with the filler's, the buffer is not working.
The new line ramp-up plan turns these readings into weekly targets.
Where Fabrico helps when you check a layout
Fabrico is OEE and light MES software that measures the line from the machine: stops and counts come from the PLC or a Fabrico IoT device.
- OEE from the machine: connected machines report from their PLC; older machines get a Fabrico IoT device with external sensors.
- OEE by machine, line and shift: the filler's own availability, performance and quality sit next to the line figure, so a layout fault shows where it lands.
- Reasons coded at the line: the operator picks the stop reason on a tablet or phone; uncoded time stays visible as unclassified, the light MES part.
- Losses in money: lost time is priced from the product's price and margin, so the buffer case above can be checked in EUR on the real line.
- Stations without a signal: the camera add-on counts output. Where the camera add-on covers the station, the video for the minute of a stop can be opened from the shift timeline, streamed on request and not stored in Fabrico.
Questions engineers ask about packaging line layout
What is the best layout for a packaging line?
No single shape wins. Straight fits a long hall, U fits when infeed and outfeed share a dock, L fits a short hall. Each works only if built around the filler, with faster machines either side and buffers sized in minutes.
What is the V-curve on a packaging line?
The pattern of rated speeds along the line: the filler is slowest and machines get faster the further away they sit, so neighbours can refill or drain a buffer after a stop while the filler keeps running.
Where should buffers sit on a packaging line?
Either side of the filler: buffers before it kept almost full, buffers after it kept partly empty, so the filler has bottles at its infeed and space at its discharge. On a beer line, the space for labeller stops goes after the tunnel pasteuriser. The sizing method is in conveyor accumulation sizing.
Where should counters go to measure OEE on a packaging line?
At the filler, with its run, starved and blocked states; each reject at the machine that made it; and a case count at the end of the line to reconcile good output.
How do you check a new bottling line layout after start-up?
Measure OEE by machine. On a sound layout the filler shows little starved or blocked time, and each buffer is back to its normal level within its recovery time.
Want to see a filler measured by machine and shift? Book a demo and see how its stops, counts and rejects become availability, performance and quality.
Related articles
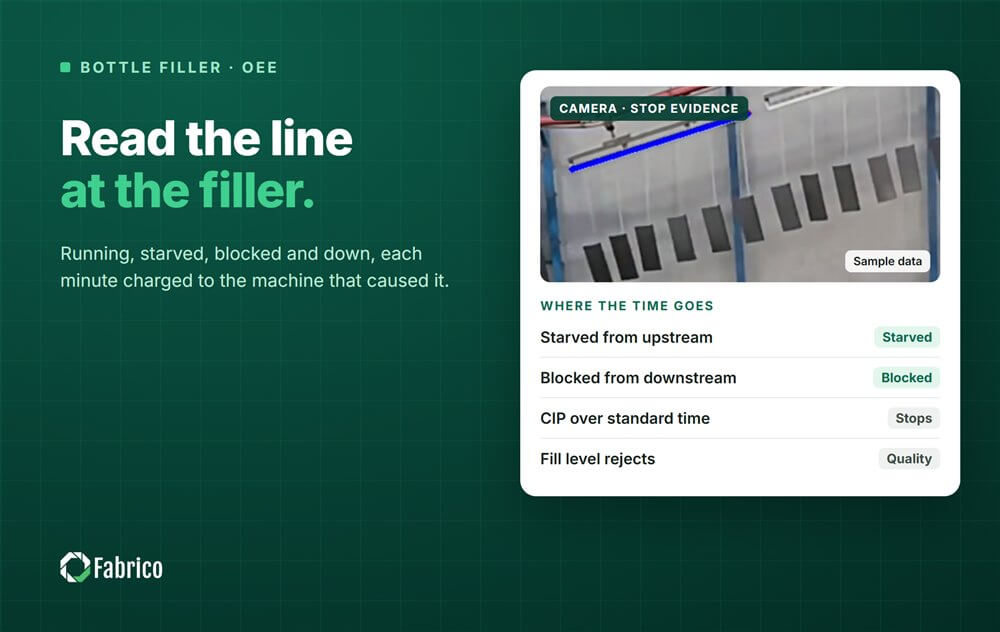
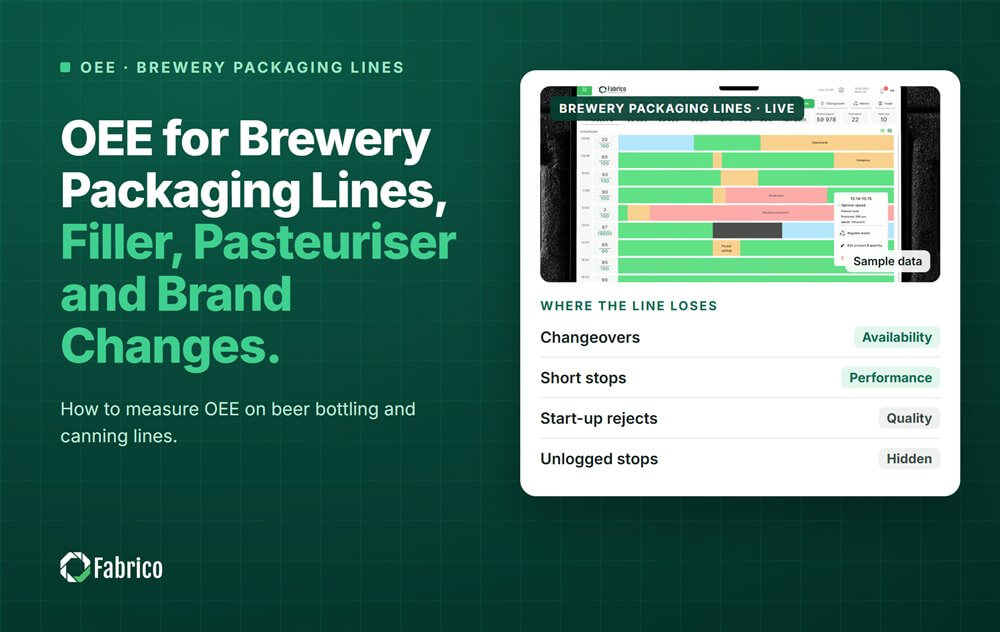






Real Fabrico tiles, sample data.