







 Login
 Blog
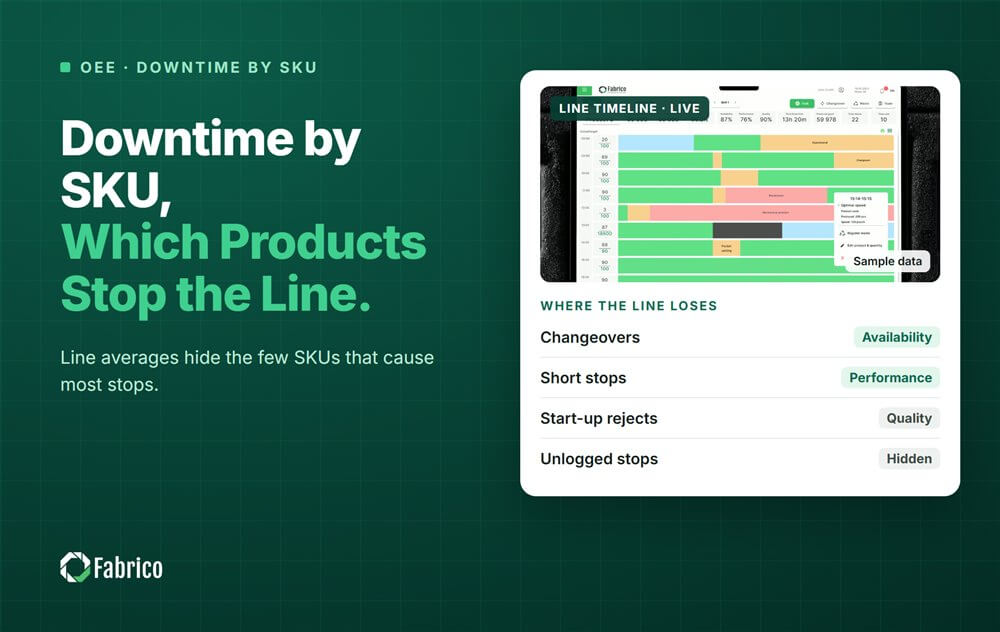
Downtime by SKU: Which Products Stop the Line

Key takeaways
- Line averages hide the two or three SKUs that stop the line most.
- Compare SKUs per run hour: stops per hour and downtime minutes per hour.
- Set rated speed per SKU, or Performance is wrong for every format but one.
- Problem SKUs usually point to handling, settings and materials, not to the machine.
- The cost per SKU is useful outside the plant too, for planning and for the range review.
Report downtime per SKU, not only per line and shift. On high mix FMCG lines a few formats often cause most of the stops, and a line average hides them. Compare SKUs per run hour, so a product that ran for 6 hours can be compared fairly with one that ran for 40.
Fabrico, an OEE and light MES platform, logs each stop with the product that was running and shows OEE live by line and shift, so the same stop log can be read by SKU. This guide covers why averages hide problem products, which numbers to track per SKU, and what to do once you find them.
Why do line averages hide problem SKUs?
A weekly report usually shows one OEE per line and per shift. That is useful, but it mixes every product that ran. If one awkward format runs only a few hours a week, its stops are spread thin across the average and nobody sees the pattern.
Some products simply run worse on the same line:
- Container shape: square, tall or light containers tip and jam at transfer points more than round ones.
- Size and weight: big formats push machines closer to their limits.
- Materials: a different label, film or case blank behaves differently.
- Run length: short runs spend more of their time in the unstable first hour after a changeover.
Rising SKU counts make this worse. Industry surveys by PMMI on SKU proliferation found changeover frequency rising as ranges grow. Reporting by line and shift but never by SKU is one of the most common mistakes on FMCG lines.
Which numbers should you track per SKU?
| Metric | How to calculate it | Why it matters |
|---|---|---|
| Run hours | Hours the SKU was running | The base for fair comparison |
| Stops per run hour | Number of stops / run hours | How unstable the product runs |
| Downtime minutes per run hour | Downtime minutes / run hours | How much time the product costs |
| Average stop length | Downtime minutes / stops | Short stops or long stops |
| Performance at rated speed | Units made / (run time x rated speed for that SKU) | Slow running on the product |
| Changeover in and out | Minutes to and from the SKU, by SKU pair | What the product costs to switch |
Totals mislead because some SKUs run far more than others. Always divide by run hours before you compare.
Why does rated speed have to be set per SKU?
Performance compares what the line made with what it could have made at rated speed. If the line has one rated speed for every product, Performance is only right for the product that speed was set for. A 6-pack and a 24-pack do not cycle at the same speed, and a 2 litre bottle does not fill as fast as a 500 ml one.
Set a rated speed per SKU. Choose between nameplate speed and the best speed the line has shown for that SKU, write the choice down, and keep it stable. Changing it quietly to make a number look better hides the loss instead of fixing it. Our guide to how to calculate OEE covers the formula.
What does downtime by SKU look like on a real line?
Sample line (illustrative numbers, not a customer): a household liquids line running six SKUs in one week, 100 run hours in total.
| SKU | Run hours | Stops | Downtime minutes | Stops per run hour | Minutes per run hour |
|---|---|---|---|---|---|
| A: 500 ml round | 40 | 120 | 180 | 3.0 | 4.5 |
| B: 750 ml round | 30 | 96 | 141 | 3.2 | 4.7 |
| C: 1 litre square | 12 | 132 | 264 | 11.0 | 22.0 |
| D: 500 ml refill pouch | 8 | 20 | 32 | 2.5 | 4.0 |
| E: 2 litre round | 6 | 54 | 138 | 9.0 | 23.0 |
| F: trial pack | 4 | 10 | 18 | 2.5 | 4.5 |
| Total | 100 | 432 | 773 | 4.3 | 7.7 |
- The line average looks moderate: about 4.3 stops and 7.7 minutes of downtime per run hour.
- SKUs C and E ran for only 18 of the 100 hours, but caused 402 of the 773 downtime minutes, 52%, and 186 of the 432 stops, 43%.
- Per run hour, C and E lose about five times as much time as A and B.
- The stop codes show why: the square bottle tips at two transfer points, and the 2 litre bottle stops the labeller on label placement.
Without the SKU split, the team would work on the line in general. With it, they know which two products, which two transfer points and which labeller setting to look at first.
What do you do with the problem SKUs?
- Fix the handling first. Guide rails, star wheels and transfer points for the awkward container. Most short stops on problem SKUs come from a few places. Our article on micro stops on packing lines shows the pattern.
- Write centerlines per SKU. Every guide and setting has a known position for that product.
- Look at the changeovers into and out of the SKU. Our guide to changeover standards on FMCG lines covers standards per SKU pair.
- Set an honest rated speed if the product cannot run at the line's normal speed, and agree it with planning.
- Share the cost per SKU with planning and the commercial team. A product that costs five times more line time per hour is a fact worth having in a range review.
Rank the fixes by money, not only by minutes. Our guide to Pareto analysis for downtime shows how to rank.
How do you set up downtime reporting by SKU?
- Tag each stop with the SKU that was running, from the production order or from the operator's selection at each changeover.
- Set a rated speed per SKU and keep a list of them.
- Report per run hour, never totals alone.
- Review weekly, and look at SKUs with few run hours over a month so the sample is big enough.
- Keep the same SKU names across lines and plants, so one product can be compared wherever it runs.
Where Fabrico fits
Fabrico is a computer vision enabled Manufacturing Performance Platform. OEE and light MES come first, with computer vision on stops.
- Automatic downtime logging, each stop with the product that was running.
- OEE live by line and shift, readable by SKU from the same data.
- The operator confirms the reason in one tap, and a camera clip can serve as evidence for a stop.
- Losses ranked by money, so the costliest SKU and cause come first.
- One view across plants for the same product on different lines.
You start with a pilot on one line, with a baseline and a decision date agreed in advance. There is no free plan and there are no tiers: each plant gets a quote. See how stops are captured on our computer vision OEE page.
Frequently asked questions
What is downtime by SKU?
It is the line's downtime split by the product that was running when each stop happened, so you can see which products stop the line most.
Why compare SKUs per run hour?
Because some products run much longer than others. Dividing by run hours makes a 6 hour product comparable with a 40 hour one.
Should each SKU have its own rated speed?
Yes. Different formats cycle at different speeds, so one rated speed makes Performance wrong for most products.
How do I know which SKU was running during a stop?
From the production order active on the line, or from the product the operator selects at each changeover. Tag each stop with it.
What if a SKU runs only a few hours a month?
Look at it over a longer period so the numbers are not driven by one bad run, and pay extra attention to its changeovers and first hour.
Find the products that stop your line
Bring one line and a month of stop data. We will show downtime by SKU and what each product cost.
Latest from our blog


Real Fabrico tiles, sample data.