


 Login
 Blog
Production Run Length: Fewer Changeovers or Fresher Stock?

In short: set production run length from what one run really costs on the line, measured changeover minutes plus start-up losses, and cap it where stock, store space and shelf life stop the run from paying. Routing figures make short runs look cheap and long runs look free.
- A longer run means fewer changeovers and higher availability.
- It also means more pallets in the store and older stock at dispatch.
- Measure one run end to end: changeover, slow start, start-up rejects.
- Lengthen when losses dominate, shorten when shelf life is the cap, keep when losses are small and the date has room.
A chilled dessert plant fills four desserts on one cup filler. The planner can make each flavour six times a week in short runs, or once a week in one long run. The first choice burns hours on changeovers. The second fills the cold store and sends cups out with fewer days left on the date.
Both look fine on a routing sheet. The answer rests on three measured numbers: what a changeover takes, what the line loses while it settles, and how much shelf life the customer needs at delivery.
Production run length: what the trade-off looks like on a food line
A food-sector SMED case study from Tomas Bata University in Zlín (Gálová, DOKBAT 2018 PhD conference, one company in the Czech Republic) puts it plainly: the classic answer to changeover cost is large production batches, which minimise the number of changeovers, but customer requirements often do not allow large batches, which also carry relatively high storage costs. That is a single case, not a sector figure, but it names both sides.
On a food or FMCG line the storage side has a hard edge: the date on the pack. A run that makes a week of stock for a chilled SKU must still ship each unit with the remaining life the customer asks for.
| If you run | You gain | You pay |
|---|---|---|
| Longer runs | Fewer changeovers, fewer start-ups, higher availability | More pallets, older stock at dispatch, slower reaction to demand |
| Shorter runs | Fresher stock, less store space, faster reaction | More changeover minutes, more start-up rejects, lower availability |
| Same length, faster changeovers | Most of the short-run benefit | A SMED project and the discipline to hold it |
How the SKUs are ordered inside the week is a separate question: see SKU changeover sequence optimisation and FMCG sequencing by changeover cost. This page is about how long each run lasts.
What one run really costs: changeover plus start-up
Every run pays a fixed toll before it makes good product at speed. Three parts, each measured on the line, not taken from the routing:
- The changeover stop: from the last good unit of the old run until the line restarts. The whole toll runs on to the first good unit at rated speed; SMED results in OEE explains why that end point matters, and the changeover checklist covers the steps inside it.
- Slow running after the restart: the filler runs below rated speed while seals, weights and temperatures settle. That loss sits in performance.
- Start-up rejects: underweight cups, bad seals and the first packs off a new film. That loss sits in quality. Startup loss vs reduced yield loss shows where to book each one.
Add the three to get the cost of one run in minutes of rated output. In the sample below, the routing says 30 minutes per changeover and nothing for start-up. The line shows 60 minutes of changeover, 20 minutes at half speed (10 minutes of lost output) and 600 rejected cups (6 minutes at 100 cups a minute): 76 minutes per run. Planning on 30 makes short runs look far cheaper than they are. The same goes for speed: plan on the rate the line holds, as scheduling at demonstrated rates and nameplate vs real capacity explain.
What a longer run costs in stock and shelf life
One lot sizing model built on food plants treats shelf life as a hard limit, not a cost line. A peer-reviewed 2021 paper in Pesquisa Operacional (Soler, Santos and Akartunalı, modelled on Brazilian food plants) describes a production setting with sequence-dependent setup times and costs and perishable items that can be stocked for a short period only. It notes that these plants want to avoid products being discarded when their shelf life runs out.
That waste is real at the factory end. Eurostat food waste estimates for the EU in 2024 put total measured food waste at around 58 million tonnes of fresh mass, with processing and manufacturing the second sector at 20%, more than 11 million tonnes. That figure covers every cause in the sector, not run length alone; it shows the size of what out-of-date stock feeds into.
Turn the limit into one number per SKU before comparing run lengths:
- Shelf-life cap = shelf life, minus the minimum remaining life the customer accepts at delivery, minus dispatch and transit days.
- Oldest unit at dispatch = how long the first unit of a run waits before it ships. If sales draw a run down evenly, that is about the days of demand one run covers.
- Store load = pallets on hand. With an even draw, the store holds about half a run of each SKU on average.
Check the longest gap between runs of a SKU, not the average. The line may run five days while sales run seven, so a run made before a weekend waits longest.
For a chilled dessert the cap is law, not preference: under Article 24 of Regulation (EU) No 1169/2011 (UK version on legislation.gov.uk; for EU markets, read the EU text), after the "use by" date a food shall be deemed to be unsafe.
A pallet-day figure from finance turns store load into money. Storage rates differ from site to site, so this guide assumes none. The worked example below works out the pallet-day rate at which a longer run stops paying; finance then holds that against what the own store or a third-party warehouse really charges.
Worked example: 4, 9, 14 or 29 hour runs on a chilled cup line
Sample figures for illustration only. The filler sets the pace at 100 cups a minute rated. It makes four SKUs over a week of 7,200 planned minutes (five days of three shifts). Measured: 60 minutes per changeover, 20 minutes at half speed after each restart, 600 start-up rejects per run, 360 minutes a week of other stops, 95% of rated speed and 1% rejects once the run settles. Run length is the time between changeovers.
4 hour runs, 24 a week. Changeovers take 24 x 60 = 1,440 minutes; with other stops, run time is 7,200 minus 1,440 minus 360 = 5,400. Availability: 5,400 / 7,200 = 75.0%. The line makes 491,400 cups against 540,000 at rated speed: performance 91.0%. Rejects are 19,170, so 472,230 are good: quality 96.1%. OEE: 0.750 x 0.910 x 0.961 = 65.6%. Check: 472,230 / 720,000 = 65.6%.
The other three lengths follow the same steps; see the table. The stock side: with pallets of 5,000 cups and an even draw, the store holds about half a run of each SKU. Shelf life is 21 days, the customer wants 14 left at delivery and dispatch takes 2, so the cap is 5 days.
The money side. A good cup is worth its contribution. The sample sells a cup at EUR 0.40 ex works, a sample price. The margin comes from a sourced range: the NYU Stern margin dataset by industry (Aswath Damodaran, January 2026 data, 78 US food processing firms) shows a gross margin of 23.23% and a pre-tax operating margin of 10.63%. Gross margin still carries the plant's fixed costs, so it understates what one extra cup adds, which keeps the example on the safe side: EUR 0.40 x 23.23% = about EUR 0.093 a cup. Use your own contribution per unit when finance has it, and check it sits near that range.
| Per week | 4 h runs | 9 h runs | 14 h runs | 29 h runs |
|---|---|---|---|---|
| Run time min | 5,400 | 6,120 | 6,360 | 6,600 |
| Availability | 75.0% | 85.0% | 88.3% | 91.7% |
| Performance | 91.0% | 93.2% | 93.9% | 94.5% |
| Quality | 96.1% | 97.8% | 98.2% | 98.6% |
| A x P x Q | 65.6% | 77.5% | 81.4% | 85.4% |
| Good cups | 472,230 | 557,766 | 586,278 | 614,790 |
| Average pallets | 7.9 | 18.6 | 29.3 | 61.5 |
| Pallet-days | 55 | 130 | 205 | 430 |
| Contribution at EUR 0.093 | EUR 43,917 | EUR 51,872 | EUR 54,524 | EUR 57,175 |
| Oldest at dispatch | 1.2 days | 2.3 days | 3.5 days | 7 days, over |
Reading it. From 4 to 9 hour runs: 85,536 more good cups a week, EUR 7,955 of contribution, for about 75 more pallet-days. From 9 to 14 hours: 28,512 more, EUR 2,652 a week, for 75 more pallet-days, still inside the cap on average; with two runs a week, a run that has to carry the weekend can reach the 5 day cap if both runs sit early in the week, so check the longest gap per SKU. On to 29 hours: the same 28,512 more, but the 5 day cap breaks. Of the four lengths tested, 14 hours makes the most good cups inside the cap. Over 48 production weeks the step from 9 to 14 hours is worth EUR 127,296 a year, and it pays as long as one pallet-day costs less than EUR 2,652 / 75 = EUR 35.36. Ask finance whether a pallet-day costs anywhere near that; if not, storage cost is not what stops a longer run, the date is. If demand is fixed, the extra cups are freed filler time, not extra sales. On routing figures the 4 hour option would show 85.0% availability, not 75.0%. Every figure is taken at the filler, the line's constraint, so a filler minute lost is a line minute lost; the OEE calculation guide shows why OEE is measured there.
If every changeover takes 20 minutes longer, say for an allergen clean, 12 runs a week drop to 74.3% OEE and 535,194 good cups, and 8 runs to 79.3% and 571,230. The step from 12 to 8 runs is now worth 36,036 cups a week, not 28,512, for the same 75 pallet-days: EUR 3,351 a week at EUR 0.093 a cup, or EUR 160,848 over 48 weeks, if the cups sell. The 5 day cap does not move, so 4 runs a week still fails.
If SMED cuts them by 30% instead: a peer-reviewed 2022 case study at a UK chilled ready-meal maker (Garcia-Garcia, Singh and Jagtap, Sustainability) cut changeover from 29 to 20 minutes, a 30% reduction, and OEE rose from around 60% to an average of 71%. At 42 minutes, 12 runs a week give 578,081 good cups (80.3% OEE), within 8,197 of the 8-run week at 60 minutes, with 135 pallet-days instead of 205 and the oldest cup at 2.3 days, not 3.5.
Lengthen, shorten or keep: a framework for each SKU
Lengthen the run if measured changeover and start-up losses take a large share of planned time, the longer run still ships inside the shelf-life cap, the extra pallets fit, and the SKU sells steadily. First check whether SMED would get most of the gain without the stock; see the changeover time guide. In a 2019 VSM and SMED case study at a food processor (Maalouf and Zaduminska, Management and Production Engineering Review), a 34% cut in changeover time raised the main line's capacity by 11% and avoided the need to increase the processing lot size.
Shorten the run if the oldest unit ships close to the cap, the cold store is full, promotions swing demand, or written-off stock keeps turning up.
Keep the run length if changeover losses are small and freshness has room to spare. The next gain is then short stops and slow running, the subject of reduced speed loss vs minor stops.
| What you see | Move | First number to get |
|---|---|---|
| Changeovers eat hours, stock is fresh | Lengthen or cut minutes | Measured minutes per change |
| Written-off stock near its date | Shorten | Shelf-life cap per SKU |
| Cold store full most weeks | Shorten or split runs | Pallet-days per SKU |
| Small losses, room on the date | Keep | Short stops and slow running |
A second case: when the store, not the date, sets the cap
Sample figures for illustration only. An ambient cereal line packs 12 SKUs with 12 months of shelf life, so the date never binds. Same 7,200 planned minutes and 360 minutes of other stops a week; demand of 280 pallets a week; about 3 good pallets per run hour; 90 minute changeovers; 200 pallet places in the store.
- Each SKU every two weeks (6 runs): runs of about 47 pallets, 280 in the store on average, 80 over: 560 off-site pallet-days a week.
- Each SKU every week (12 runs): 140 in the store, but 1,080 changeover minutes leave 96 run hours, 288 pallets: 8 of slack.
Price the extra changeovers with a sourced labour rate. Eurostat hourly labour costs put industry at EUR 40.3 an hour in the euro area in 2025, the highest paying sector, with EU averages from EUR 12.0 in Bulgaria to EUR 56.8 in Luxembourg. Six more changeovers of 90 minutes with a team of 3 (a sample crew) take 27 hours: 27 x EUR 40.3 = EUR 1,088.10 a week, about EUR 52,229 over 48 weeks. Weekly runs win whenever an off-site pallet-day costs more than EUR 1,088.10 / 560 = EUR 1.94, as long as the 8 pallets of slack hold.
Cut changeovers to 60 minutes, close to the 34% in the food processor study above, and the weekly cycle gains 6 run hours, 18 pallets of headroom. Here the SMED project decides whether weekly runs are safe.
Run-length options compared: cost, fit and what to ask
Four policies cover most lines. The costs below come from this page's two cases, so they are sample figures; the labour rate (Eurostat) and the margin (NYU Stern) are sourced above. Swap in your own minutes, pallet-days and margin before you choose.
| Option | Cost or effort (sample) | Choose it if |
|---|---|---|
| Keep the run length, plan on measured minutes | Planner and supervisor time to time each changeover twice over four weeks of stop records; no capital | Changeover and start-up losses are a small share of planned time and the date has room |
| Lengthen one step | About 75 more pallet-days a week per step on the chilled line; pays while a pallet-day costs under EUR 35.36 | The oldest unit of the longest gap still ships inside the shelf-life cap and the store has free places |
| Shorten or split runs | One step back gives up 28,512 good cups a week, EUR 2,652 of contribution; on the ambient line, weekly runs add EUR 1,088.10 of changeover labour | The oldest unit ships close to the cap, the store is full most weeks, or written-off stock keeps turning up |
| SMED first, then decide | A team of 4 for two 8 hour days to film and redesign one change type: 64 hours x EUR 40.3 = EUR 2,579.20 of time, before parts; the two food cases above cut changeovers by 30% and 34% | One change type takes most of the minutes, so a shorter change gives most of the long-run gain without the stock |
Questions to put to vendors and your own team
- OEE or MES software vendor: how does the report split the changeover stop from the slow running and rejects after the restart?
- Same vendor: can the changeover log be exported per run, as CSV or through an API, into the planning sheet?
- Third-party warehouse: what is the chilled pallet-day or pallet-week rate, and what are the handling fees and minimum periods?
- Finance: which contribution per unit do we use for an extra unit, and does it sit near the food processing margin range?
- Quality: what remaining life does each customer require at delivery, SKU by SKU?
- Line team: which change type is the most frequent, and which is the longest?
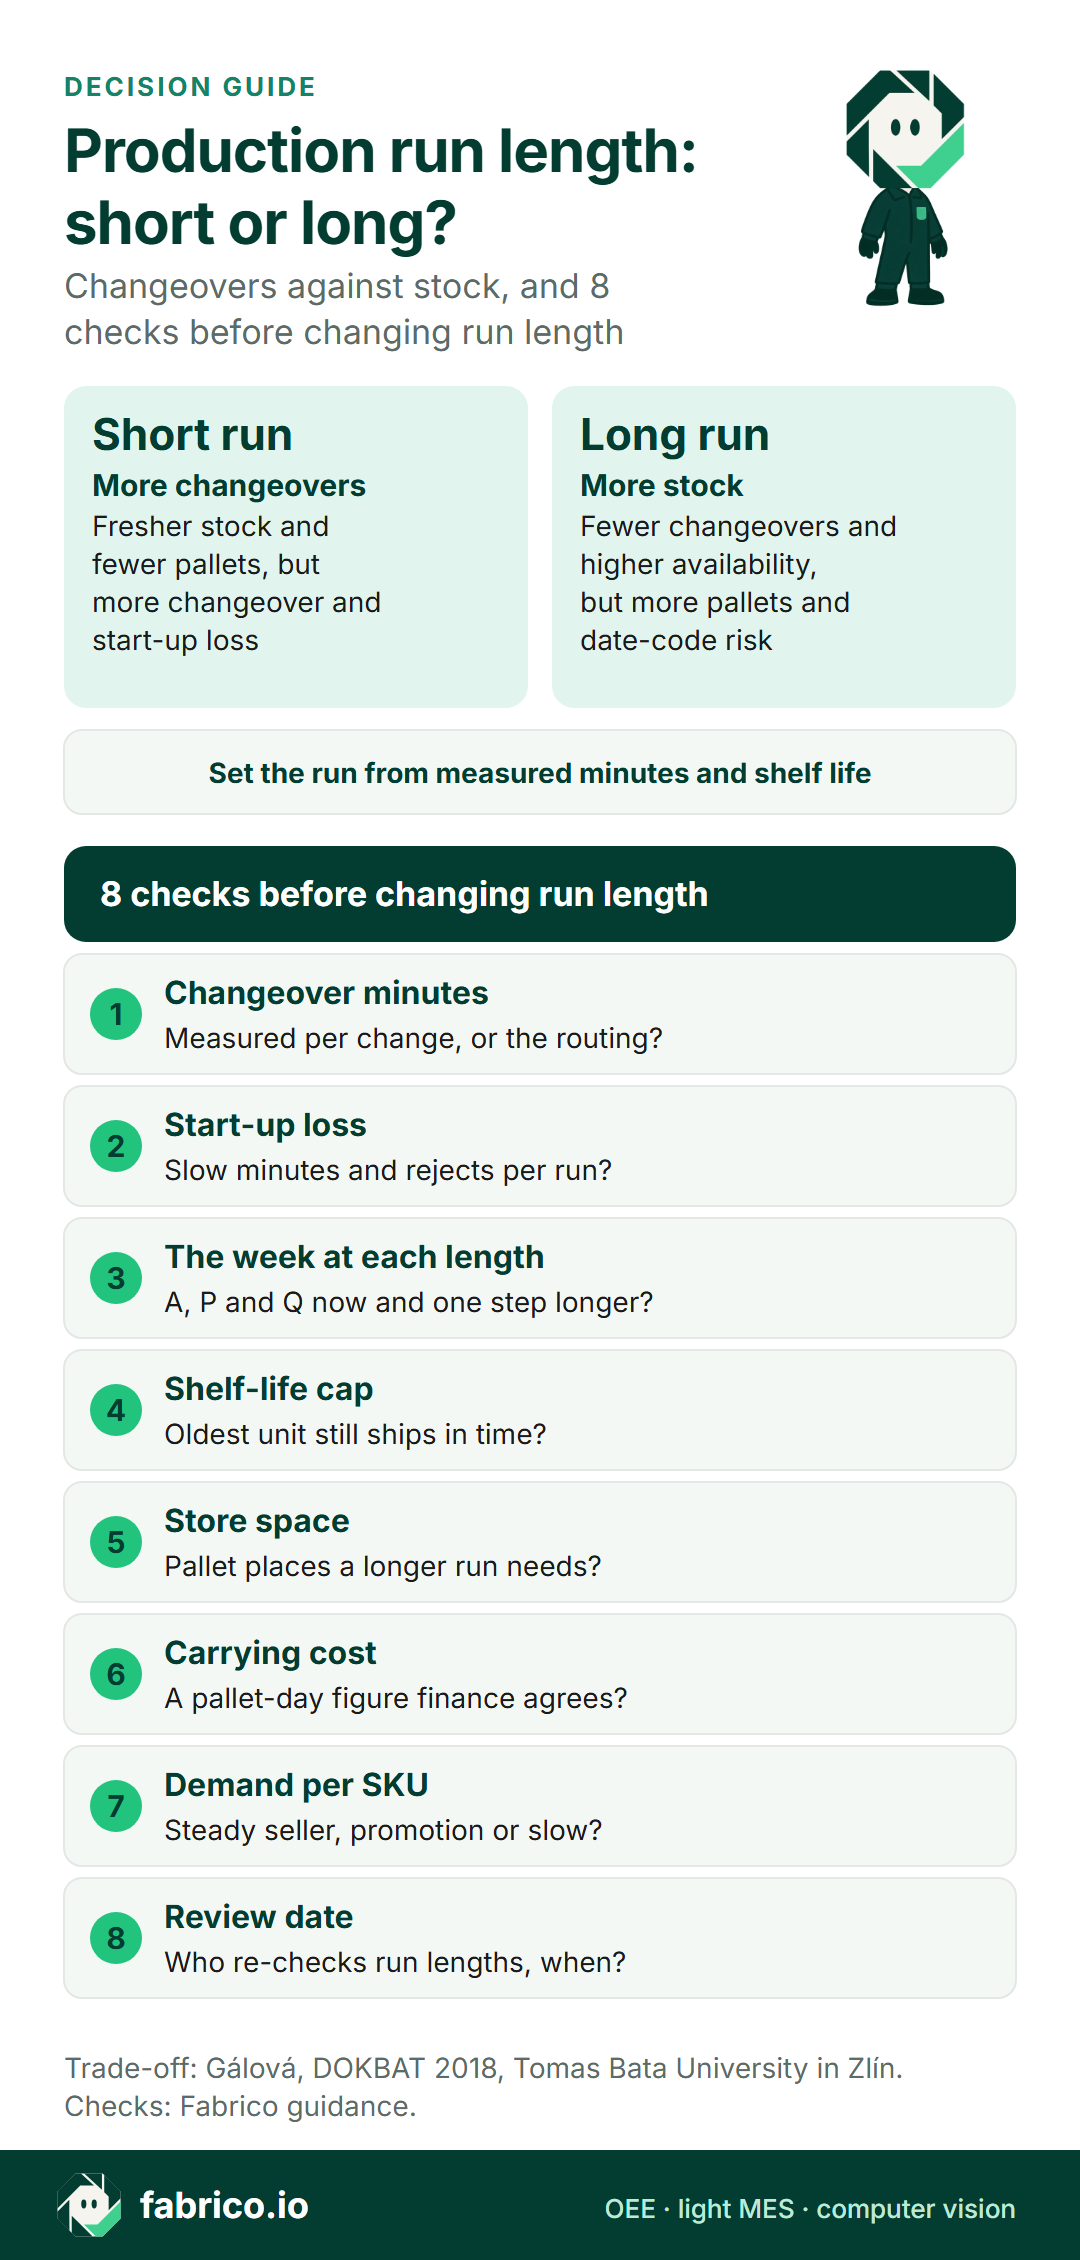
Text version of this infographic
- Short run: more changeovers. Fresher stock and fewer pallets, but more changeover and start-up loss.
- Long run: more stock. Fewer changeovers and higher availability, but more pallets and date-code risk.
- Set the run from measured minutes and shelf life.
- 8 checks before changing run length: changeover minutes, start-up loss, the week at each length, shelf-life cap, store space, carrying cost, demand per SKU, review date. The checklist below asks each one in full.
Run length checklist: 8 questions
Put these to planning, production, quality and finance before any run length changes.
- Changeover minutes: measured from the last good unit to the restart, per type of change, or copied from the routing?
- Start-up loss: are slow minutes and rejects after each restart counted per run?
- The week at each length: what are availability, performance and quality now, and at one step longer?
- Shelf-life cap: does the oldest unit of a run still ship inside shelf life minus the customer's minimum and the dispatch days?
- Store space: how many pallet places does a longer run need at its peak, and are they free?
- Carrying cost: what does one pallet-day cost, as a figure finance agrees with?
- Demand per SKU: which SKUs sell steadily, which run on promotions, and which are slow?
- Review date: who re-checks run lengths, and after which events: a new format, a SMED project, a new customer rule?
For chilled and ambient food sites, read on with an MES for dairy processing, what an MES does in food manufacturing and an MES sized for a mid-size FMCG site.
Run length: what to do this week and this quarter
This week
- Pull four weeks of stop records and time every changeover twice: last good unit to restart, and restart to first good unit at rated speed.
- Group them by type of change (flavour, film, allergen clean) and plan on the median of each.
- Count start-up rejects after each change on your four biggest SKUs.
- Get each SKU's shelf-life cap from quality and write it next to today's run length.
This quarter
- Rebuild the week table for each line at today's run length, one step longer and one step shorter.
- Run one SMED project on the most frequent change type and re-measure for four weeks before any run length moves.
- Agree a pallet-day figure with finance, re-set run lengths SKU by SKU and diary the next review.
Where Fabrico helps when run lengths are set
This page comes from Fabrico, so weigh this section accordingly. Fabrico, cloud OEE and light MES software, covers the measuring side of this choice: stops on a connected machine are recorded with their start time and duration, so the minutes in the week table come from the line.
What you see: a shift timeline, unclassified time waiting for a reason, and the operator's line-down screen, on sample lines.
Plays from YouTube. Google may set cookies when you press play. Privacy policy.
What that gives the planner:
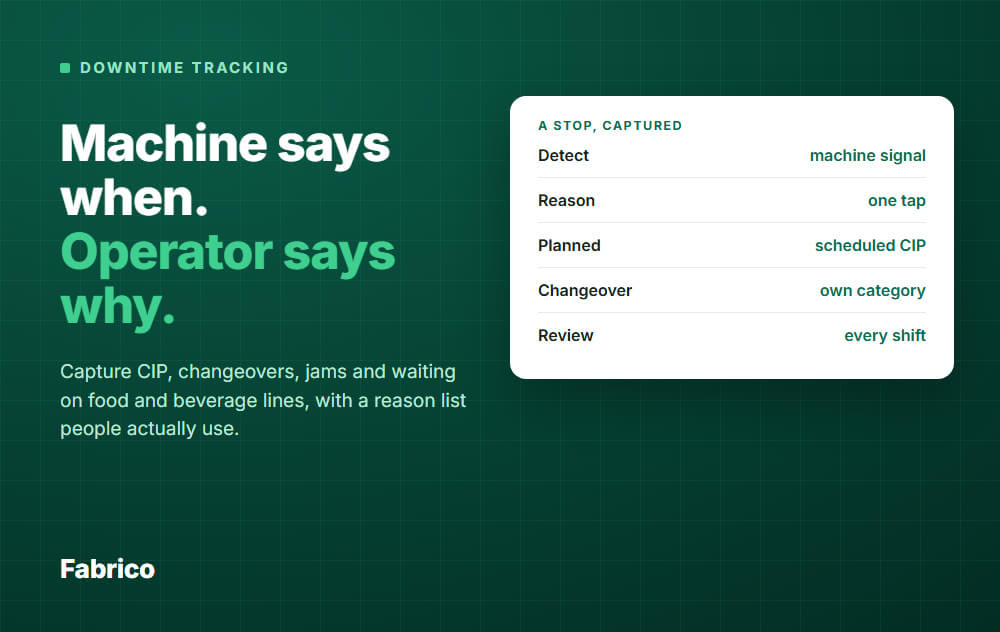
- Changeover minutes as a reason code: the operator picks why the line stopped, on a tablet or phone, from the plant's own list; with changeover on that list, downtime by cause, machine and shift shows the changeover minutes per week.
- Slow restarts in performance: the 20 slow minutes after a restart land in performance, measured against the ideal cycle time, so the run-up is not lost in the average.
- Losses in money: downtime and slow running are shown in money, a figure to set beside the pallet-day cost finance uses.
- Data out: export any list to CSV or Excel, or pull it through the REST API and webhooks. Test the feed to your planning sheet with one month of the changeover log.
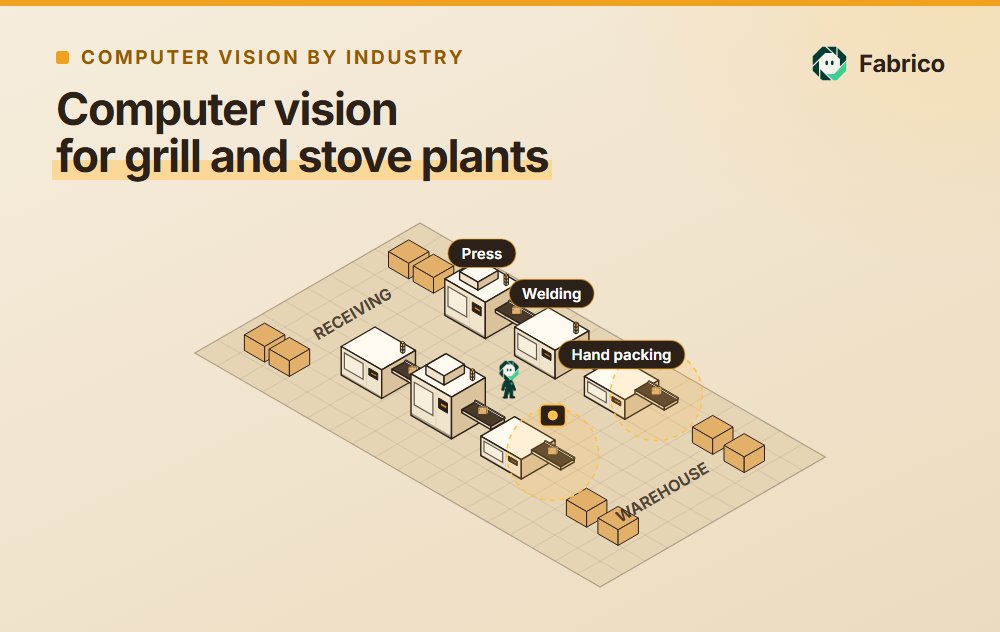
- Hand-packed SKUs: on a manual packing step without a machine signal, output can be counted by the camera add-on, and suggested stop reasons for the camera add-on are still being built.
Related reading: the Fabrico solution overview, choosing OEE software, what a light MES covers, the camera add-on page and where the camera add-on counts on food lines. Weighing a planning tool as well? See scheduling software vs OEE software.
Book a demo to see a stop's start and duration recorded from the machine signal. Then hold your own shift sheets up against that.
Questions about production run length
What is a good production run length?
There is no single figure. A run is long enough when changeover and start-up losses are a small share of planned time, and short enough that the oldest unit still ships inside the shelf-life limit and the stock fits the store. Both limits come from measured minutes and the product's own rules.
How do you measure production run time?
In this guide a run is the time between two changeovers, so the slow start and start-up rejects sit inside it. Log the changeover minutes, the slow minutes and the rejects next to each run so that loss stays visible. Over a week, availability is planned time minus changeovers and other stops, divided by planned time.
Should changeover times come from the routing?
Use the routing only as a starting point. Measure from the last good unit of one run until the line restarts, per type of change, over several weeks, and plan on the median. Log the slow minutes and rejects after the restart separately.
How is run length different from an order quantity formula?
A formula balances setup cost against holding cost on fixed inputs. On a food line the run also has to respect shelf life, store space and the start-up losses the line really shows. For the formula side, see the economic order quantity guide.
Can Fabrico set run lengths?
Production planning and scheduling are not part of Fabrico today. Operators tag the cause of a stop from the plant's own reason codes, so changeovers can be one of them, and Fabrico shows downtime by cause, output and OEE per shift for the planner to use.
Want to see changeover minutes recorded by cause, machine and shift on a connected line? Book a demo.
Related articles










Real Fabrico tiles, sample data.