


 Login
 Blog
Monthly Operations Review: A Plant MOR Built From Line Data

In short: a monthly operations review in a plant works when one page of KPIs covers safety, quality, delivery, cost, people and OEE, every number traces back to a line, a shift and a loss, and the meeting ends with three priced actions that each have an owner.
- Run it in about 90 minutes with six section owners, finance in the room.
- Build the cost section as a bridge: planned hours, lost hours by loss category, then EUR.
- Show unclassified stop time as its own number, not hidden inside availability.
- Drop any KPI that will not change a decision this month.
Most plant MORs fail the same way: forty slides, a green scorecard, a controller who does not believe the OEE figure and an action list nobody reads. The fix is a pack built from line data, where the plant controller and the production manager see the same hours and the same euros.
The review sits above shorter loops. Daily tier meetings handle today's problems, the plant manager's weekly OEE review turns line losses into owned fixes, and presenting OEE to the board covers the step above the plant.
What a monthly operations review decides in a plant
A monthly operating review (MOR) has one job: move resources. People, engineering hours, maintenance windows, capex requests and the next month's plan. If nothing moves after the meeting, it was a report, and a report can be read without a meeting.
The weekly review asks "what stopped line 2 and who fixes it". The MOR asks "which three losses, across all lines, are worth next month's engineering time, and what are they worth in money". Finance attends because the answer ends in euros. Three outputs make a good MOR:
- A shared picture: one set of numbers that production, quality and finance all accept for the month.
- A priced loss list: the month's losses in hours and EUR, largest first.
- Three committed actions: each with an owner, a date and a target in recovered hours.
Where the MOR numbers come from: the line, not the spreadsheet
A monthly figure is only as good as the shift data under it. Typed in from paper after the shift, a 22-day, three-shift month adds up 66 shift sheets of rounded guesses. When OEE software measures the line from the machine signal, with operators adding the stop reason at the line, the monthly number is a sum of timed events you can open down to the line, the shift and the stop.
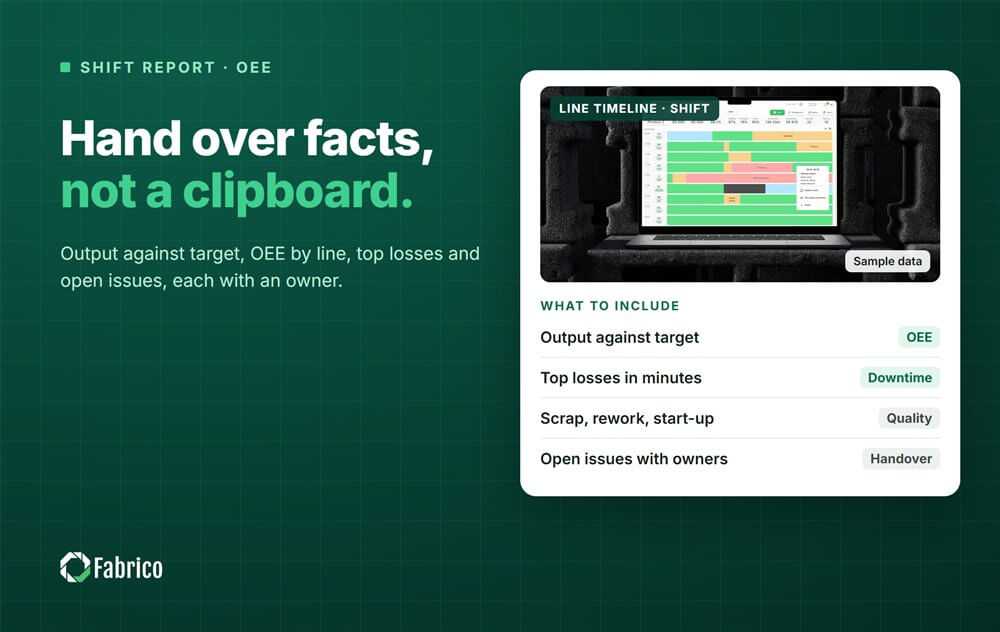
What you see: a shift timeline, unclassified time waiting for a reason, and the operator's line-down screen, on sample lines.
Plays from YouTube. Google may set cookies when you press play. Privacy policy.
A large Swedish study of automatic OEE measurement, covering 23 companies and 884 machines, found that almost half of the recorded OEE losses could not be classified because loss categories were missing or poorly described (Chalmers University of Technology, 2016). A monthly review built on that data would discuss half of its losses without knowing what they were.
Definitions matter as much as capture. A NIST summary report on manufacturing monitoring standards notes that there are currently multiple definitions, interpretations, and calculations for OEE. If line 1 counts cleaning as planned downtime and line 3 counts it as a loss, the plant OEE on the MOR pack compares two different things. Agree the definitions once, write them down and keep them stable; the OEE calculation guide covers the formula itself.
The same NIST report points to a common reference: ISO Standard 22400 presents commonly-accepted OEE calculations, including specific timing calculations. Copy that discipline for the MOR: one short definition card per KPI, with formula, unit, data source and owner.
The MOR agenda: safety, quality, delivery, cost, people, OEE
Keep the order fixed. Safety first, because nothing can be traded against it. OEE last, because it produces the actions and the meeting should end on them.
Safety
Recordable injuries, lost-time injuries, near misses and open safety actions, by area and shift. Manufacturing carries real weight here: in 2024, EU manufacturing accounted for 18.3% of all non-fatal accidents at work in the EU (Eurostat, accidents with at least 4 calendar days of absence). In US plants, the incident numbers come from the same records OSHA requires: many employers with more than 10 employees are required to keep a record of recordable work-related injuries and illnesses on the OSHA 300, 300A and 301 forms. Use that log, not a separate count. A near miss that repeats on the same machine moves to the action list with an owner.
Quality
Customer complaints per million packs, holds and releases, scrap and rework by line. In food plants, scrap is also a waste figure: Eurostat puts processing and manufacturing at 20% of measured EU food waste in 2024, more than 11 million tonnes of fresh mass. Scrap on the MOR pack should match the reject counts at the line, by reason, so it can be traced to a filler, an oven or a wrapper; a scrap reason code taxonomy keeps those reasons consistent across lines.
Delivery
Plan attainment by line and week, and the orders that slipped. The MOR does not replan; it decides whether next month's plan fits the hours the lines actually delivered.
Cost
Conversion cost per 1,000 packs and the value of lost hours. Most MORs get this wrong: cost comes from the ledger, losses come from production, and nobody joins them. The loss-to-money bridge below joins them.
People
Absence, overtime hours, open roles and training. If Saturday shifts make up output lost to changeovers, overtime is a loss figure in disguise.
OEE and losses
Line OEE split into availability, performance and quality, then loss hours by category, largest first. Plant OEE is a headline; decisions sit in the line rows. For the full KPI list beyond OEE, see plant manager KPIs and OEE as a KPI.
Monthly operations review template: 90 minutes, six owners
An operations review meeting format for one plant: per section, one owner, one data source seen in advance, one decision.
| Section | Owner | Data source | Minutes | Decision expected |
|---|---|---|---|---|
| Safety | HSE lead | Incident log, near-miss log | 10 | Close or escalate open actions |
| Quality | Quality manager | Complaints, holds, scrap by line | 15 | Approve a fix or a hold rule |
| Delivery | Planning lead | Plan vs actual by line and week | 10 | Accept or reset next month's plan |
| Cost | Plant controller | Loss-to-money bridge, conversion cost | 20 | Fund or drop the top loss fix |
| People | HR partner and shift leads | Absence, overtime, training plan | 10 | Approve staffing changes |
| OEE and losses | Production manager | Line OEE, loss hours by category | 20 | Commit 3 actions with owners |
| Close | Plant manager | Action list | 5 | Read back owners and dates |
Send the pack 48 hours before, so the 90 minutes go on decisions. The OEE section opens with last month's three actions: done, late or dropped, with recovered hours.
The one-page KPI pack and how each number traces to the line
One page for the whole pack, one or two numbers per section, each with this month, last month, the 12-month trend and the target. Someone in the room must be able to open each number down to where it happened.
| KPI on the pack | Line-level source | Trace it back by |
|---|---|---|
| Recordable injuries, near misses | Incident log by area and shift | Area, shift, task |
| Customer complaints per million packs | Complaint log matched to batch | Batch, line, date |
| Scrap and rework % | Reject counts at each counting point | Line, shift, reject reason |
| Plan attainment % | Good output vs plan by line | Line, week, missed order |
| Conversion cost per 1,000 packs | Hours, crew, energy, good output | Line, cost line |
| Overtime hours | Rosters vs lost hours | Shift, line, reason |
| OEE with A x P x Q | Machine signal, stop reasons, counts | Line, shift, loss category |
| Value of lost hours, EUR | Loss hours x the line's stated rate | Loss category, line |
The last row is the one that turns an operations meeting into a finance conversation. If the plant controller can see how 30 hours of breakdowns became EUR 30,240, the debate moves from "is the number right" to "which loss do we fix first". A short primer on explaining OEE to finance helps before the first meeting.
Book a demo to see how loss hours by line, shift and category are collected from the machine signal and priced in money for a monthly pack.
The loss-to-money bridge: a worked example
Sample figures for illustration only. A biscuit plant runs three packing lines. Line 1, the high-volume sandwich biscuit line, is the constraint and is sold out in the autumn season. The bridge below is for line 1 in October. The plant controller builds the same bridge for each line, each with its own stated money lens: contribution per hour if the line is sold out, crew and overhead cost per hour if it is not. The plant sheet shows the two lenses in separate columns and never adds one to the other.
Step 1, planned hours. 22 production days at 22.5 planned hours a day (three shifts of 8 hours less breaks) give 495 planned hours. Rated speed is 120 packs a minute, 7,200 packs an hour, so the line could make 3,564,000 packs at rated speed.
Step 2, each loss in hours.
- Availability: breakdowns 30 h, changeovers and cleaning 40 h, unclassified stops 12 h. Run time 495 minus 82 = 413 h. Availability 413 / 495 = 83.4%.
- Performance: minor stops 22 h and slow running 18 h, converted at rated speed. Net run time 413 minus 40 = 373 h, or 2,685,600 packs. Performance 373 / 413 = 90.3%.
- Quality: 86,400 rejected and start-up packs, 12 h at rated speed. Good output 2,599,200 packs, 361 h. Quality 361 / 373 = 96.8%.
- OEE: 0.834 x 0.903 x 0.968 = 72.9%. Check: 2,599,200 / 3,564,000 = 72.9%.
Step 3, hours to EUR. The line is sold out, so a lost hour is lost sales. Take a sample factory price of EUR 0.80 a pack and a sample contribution margin of 17.5%, or EUR 0.14 a pack. For scale, NYU Stern's margin dataset (January 2026 data, 78 US food processing firms, accessed 15.11.2026) reports a pre-tax operating margin of 10.63% and a gross margin of 23.23%. Contribution, price less variable cost, sits above the operating margin, which is struck after all fixed costs. Whether it sits above or below the gross margin depends on how much of the cost is fixed plant overhead and how much is variable freight and selling cost, so 17.5% keeps the bridge on the cautious side. One hour of good output is worth 7,200 x EUR 0.14 = EUR 1,008. A rejected pack also burns its variable cost, the price less the contribution: EUR 0.80 minus 0.14 = EUR 0.66 a pack, so 86,400 rejects x EUR 0.66 = EUR 57,024, less anything you rework or sell as salvage.
| Loss category | Hours | Packs lost | EUR |
|---|---|---|---|
| Breakdowns and faults | 30 | 216,000 | 30,240 |
| Changeovers and cleaning | 40 | 288,000 | 40,320 |
| Unclassified stops | 12 | 86,400 | 12,096 |
| Minor stops | 22 | 158,400 | 22,176 |
| Slow running | 18 | 129,600 | 18,144 |
| Rejects and start-up scrap | 12 | 86,400 | 69,120 (incl. 57,024 variable cost) |
| Total lost | 134 | 964,800 | 192,096 |
The 134 lost hours are worth EUR 135,072 in contribution, EUR 192,096 for the month with the variable cost of scrapped packs. Not all of it is recoverable: some cleaning is a food safety requirement. The bridge says where the money sits, so the room argues about the right thing.
If the line is not sold out, the hour is worth less. US manufacturing ran at 75.9 percent capacity utilization in September 2026, 2.3 points below its long-run average (Federal Reserve G.17). With spare capacity, a lost hour costs crew and overhead rather than sales. A crew of 6 at the euro area hourly labour cost in industry, EUR 40.3 in 2025 (Eurostat, accessed 15.11.2026), costs EUR 241.80 an hour, so crew cost alone is EUR 32,401.20 for the 134 hours; add your overhead rate per hour on top. Country rates spread widely around that figure: the EU whole-economy average of EUR 34.9 runs from EUR 12.0 in Bulgaria to EUR 56.8 in Luxembourg, so use your own rate. State each line's lens at the top of the cost page; mixing the two is how finance and production end up with different numbers. For per-minute costing, see the cost of downtime per minute.
Step 4, the three actions the MOR commits to
- Changeovers, owner: production manager. Standardise the two most frequent format changes on line 1 and run them with a checklist. Target: 10 of the 40 hours back, worth EUR 10,080 a month. Read our guide to changeover time before setting the target.
- Minor stops at the wrapper infeed, owner: maintenance lead. Fix the guide rails and photo-eye settings behind the short stops. Target: 8 of the 22 hours back, worth EUR 8,064 a month. Separate minor stops from reduced speed before choosing the fix.
- Unclassified stops, owner: shift leads. Every shift codes its stops before handover. Target: unclassified time under 2 hours next month, so the 12 hours land in a real category.
Actions 1 and 2 are 18 hours, EUR 18,144 a month while the line stays sold out, and would lift line 1 OEE from 72.9% to 76.6%. Action 3 recovers no hours; it makes next month's bridge honest.
How sensitive the bridge is
Sample figures for illustration only. If line 1 OEE had been 5 points lower, at 67.9%, the line would have lost another 24.75 hours: 5% of 495. At EUR 1,008 an hour that is EUR 24,948 in the month, more than the two hour-based actions above recover.
Now take changeovers. Line 1 runs 44 changeovers a month, about 55 minutes each, cleaning included. If each took 20 minutes longer, that is 880 minutes, 14.7 hours, or EUR 14,784 a month. A slip the weekly review can miss shows plainly in the monthly bridge.
Monthly operating review (MOR) failure modes
Each of these shows up in the data before anyone calls it a problem.
| Failure mode | Early sign | Fix |
|---|---|---|
| Vanity KPIs | Green on the pack, yet output and complaints get worse | Keep only numbers that pass the three questions |
| No owner | The same loss sits on three monthly packs in a row | One name and one date per action |
| Numbers nobody trusts | Finance and production quote different OEE or scrap | One definition card per KPI, signed off |
| Unclassified time hidden | Stops with no reason above a few percent of planned time | Make unclassified a KPI on its own |
| Slide marathon | The pack runs past one page, the meeting past 2 hours | One page overall, one or two numbers per section |
| Averages hide the line | Plant OEE flat while one line falls | Show the worst line and shift first |
| No money lens | Actions ranked by gut, not by EUR | Use the loss-to-money bridge |
| Actions never closed | Action list grows month after month | Open the OEE section with last month's actions: done, late or dropped |
Numbers nobody trusts usually have two definitions. If the controller's scrap comes from material variance and production's from reject counts, both can be right and still disagree. Pick one source per KPI and show the other only as a reconciliation. For plants in a group, OEE governance across plants covers who owns those definitions.
Spreadsheet, BI dashboard or line data: how to build the MOR pack
Every plant ends up choosing where the MOR numbers come from. Three options cover most plants. The effort ranges below are sample figures for one plant with three lines, priced at the euro area industry labour cost of EUR 40.3 an hour (Eurostat, 2025). Replace the hours and the rate with your own.
| Option | Where stop data comes from | Effort (sample) | Cost at EUR 40.3 an hour | Choose it if |
|---|---|---|---|---|
| A. Spreadsheet from shift sheets | Paper or typed shift logs | 12 to 20 h a month to compile and reconcile | EUR 484 to 806 a month | You run one line, unclassified time is small, and you are testing whether the MOR format sticks |
| B. BI dashboard over ERP and typed stop data | ERP output plus stops typed after the shift | 60 to 120 h to build once, then 4 to 8 h a month | EUR 2,418 to 4,836 once, then EUR 161 to 322 a month | Output and scrap in the ERP are already trusted and stop reasons are coded at the line today |
| C. OEE and light MES software from the machine signal | Timed events from the machine, reason coded by the operator | 8 to 16 h per line to agree reasons and definition cards, then 2 to 4 h a month to check and export | EUR 322 to 645 per line, then EUR 81 to 161 a month, plus the vendor's quote | Unclassified time is above a few percent, the constraint line is sold out, or finance and production quote different numbers |
Options A and B cost less to start, but both inherit the rounding of shift sheets, and the Chalmers study above shows how much of a loss list can go unclassified. Option C costs the most up front and changes where the numbers come from. Price it against your own bridge: on the sample line one recovered hour is worth EUR 1,008, so set any quote against the hours you expect to recover, not against the time it saves in compiling the pack. Whichever you pick, the definition cards and the money lens are the same work.
Questions to put to vendors, or to your own team for options A and B:
- Where does each stop's start and end time come from: the machine signal, the operator, or a sheet typed after the shift?
- How is stop time with no reason shown, and can it be reported as its own KPI on the monthly pack?
- Can we set our own contribution and crew rates per line, and see each loss category in EUR?
- How does the month's data leave the system for the controller's pack: Excel or CSV export, or an API?
- What happens on a manual station or an old machine with no usable signal?
- Who keeps the reason list and the definition cards, and how many hours a month does that take?
MOR readiness checklist: 8 checks before the first meeting
Run these with the plant controller before the first MOR:
- One page: Does the whole KPI pack fit on one page?
- Definitions: Is there a signed definition card for each KPI, with formula and unit?
- Same data: Do finance and production read OEE and scrap from the same source?
- Traceable: Can each number be opened down to a line, a shift and a loss category?
- Unclassified: Is stop time with no reason shown as a separate figure?
- Money lens: Is each line's lens stated, and each loss category priced in EUR with the rate and its source?
- Owners: Does each section have one named owner and a decision it must produce?
- Three actions: Does the meeting end with 3 actions, each with an owner, a date and a target in hours?
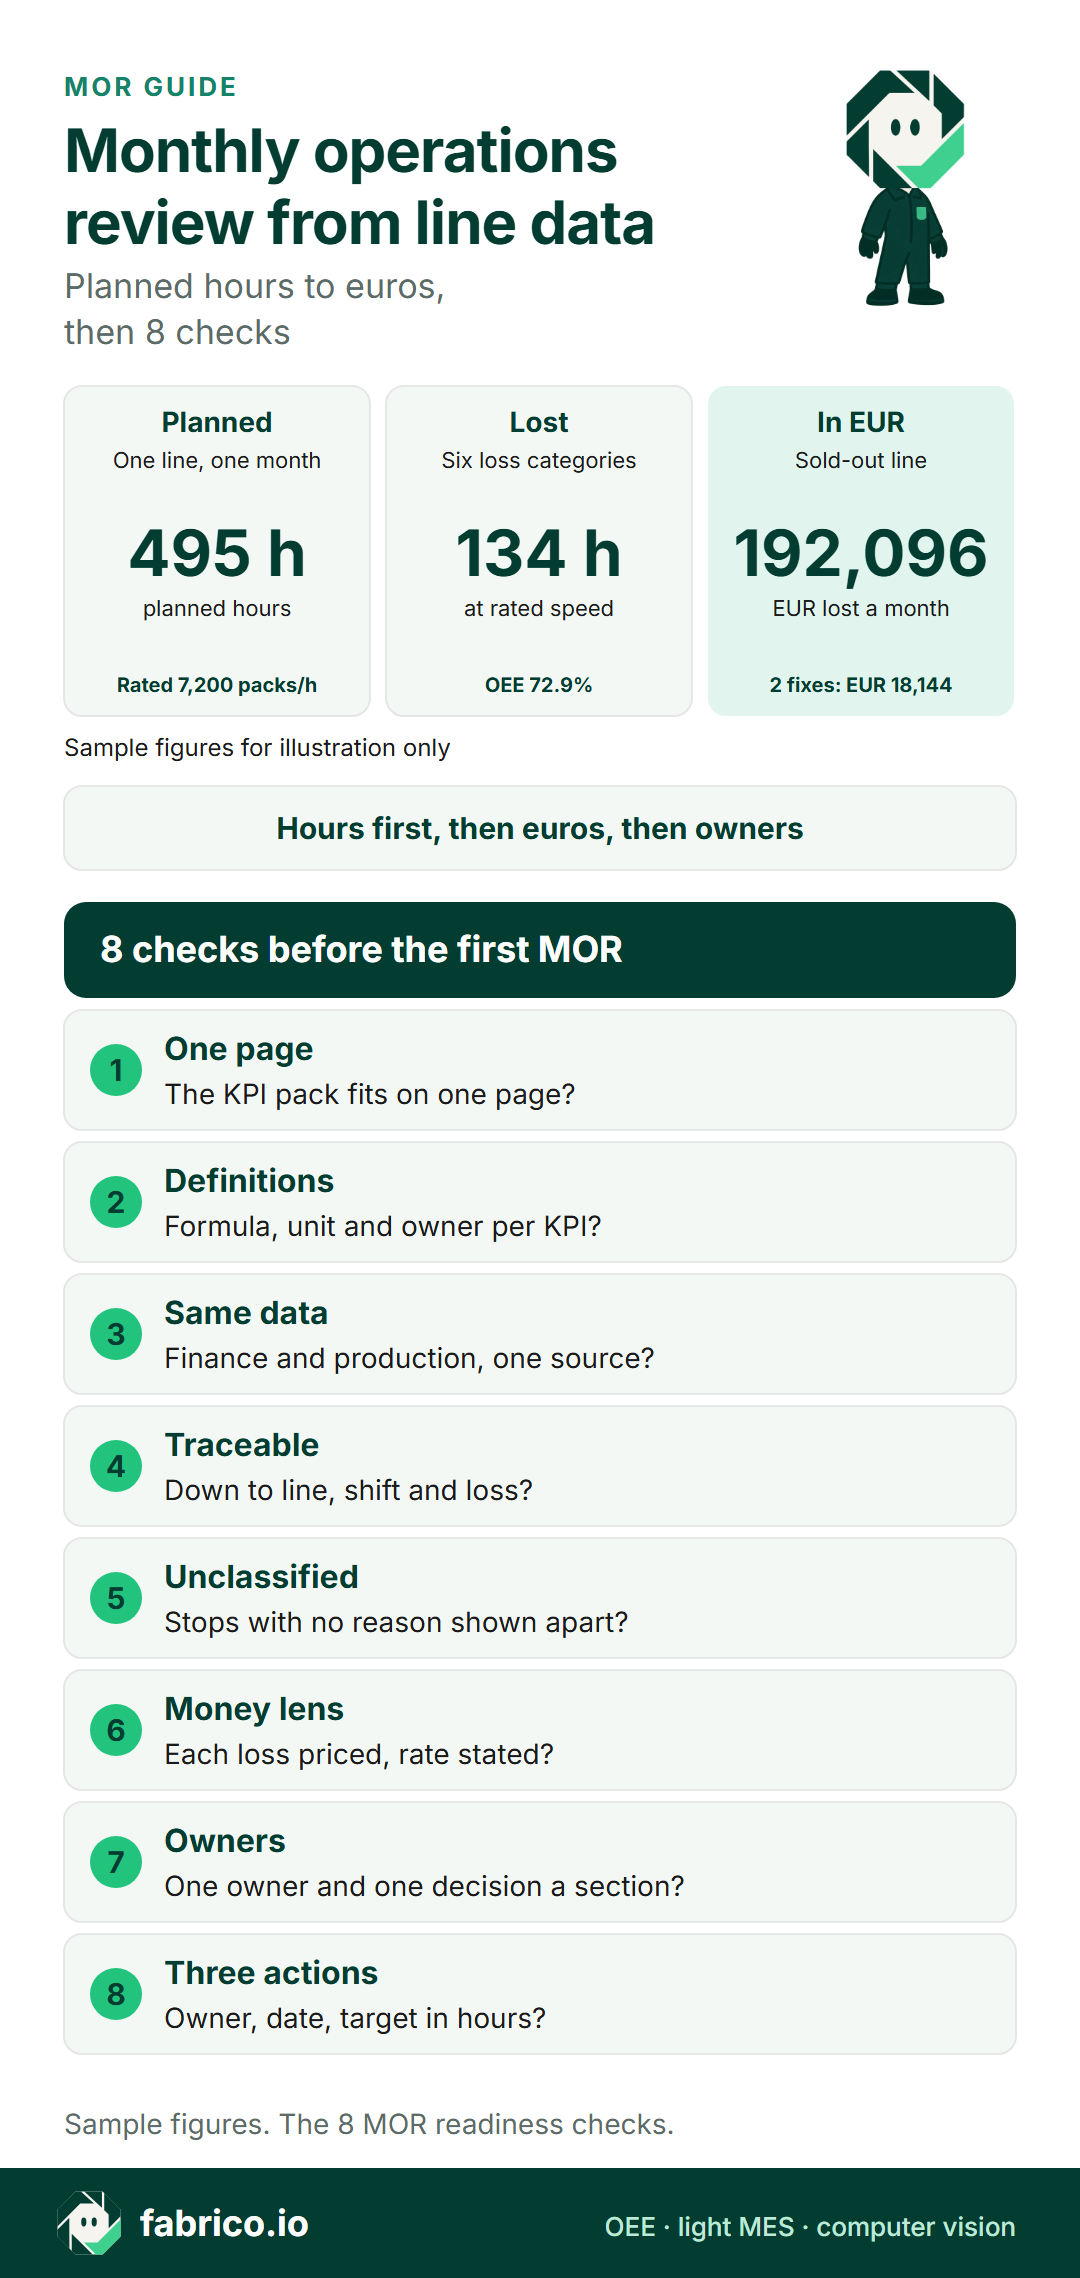
Text version of this infographic
- Card title: monthly operations review from line data.
- Planned: 495 hours on one biscuit line in a sample month.
- Lost: 134 hours across breakdowns, changeovers, unclassified stops, minor stops, slow running and rejects.
- Money: EUR 192,096 in the month at EUR 1,008 contribution per hour plus the variable cost of scrapped packs (sample).
- 8 checks: one page, definitions, same data, traceable, unclassified, money lens, owners, three actions.
If fewer than six pass, run the first meeting anyway and make the failing checks its first actions.
What to do this week and this quarter
This week:
- Pull last month's line data for your constraint line: planned hours, run hours, good output and stop minutes by reason, with uncoded stops totalled as unclassified.
- Agree two rates with the plant controller: contribution per pack and crew cost per hour, and whether the line is sold out.
- Build one bridge: one line, one month, six loss categories in hours and EUR.
- Name the six section owners and send them the template table.
This quarter:
- Write the definition cards, signed off by production and finance.
- Extend the bridge to all lines, one stated lens per line, with sold-out and spare-capacity lines in separate plant columns.
- Run three MORs on the same pack, tracking actions in recovered hours.
- Cut what nobody used: after the third meeting, drop any KPI that produced no question or decision.
How Fabrico feeds the monthly review
Fabrico is OEE and light MES software that measures the line from the machine, so the MOR pack starts from timed events rather than shift sheets.
- OEE from the machine, not from paper: Fabrico calculates OEE from data collected at the machine, and older machines get a Fabrico IoT device with external sensors to collect the production signal.
- Reasons coded at the line: the operator picks the reason at the line, on a tablet or phone, while the stop is fresh; what stays uncoded remains visible as unclassified time.
- Losses in money: Fabrico puts a money value on each loss, which is the raw material of the loss-to-money bridge.
- Drill-down for the room: downtime splits by cause, machine and shift, and any list exports to Excel or CSV for the controller's pack.
- Manual stations too: a hand-pack table or an old machine without a clean signal can be counted by Fabrico's camera add-on; video from the camera add-on is streamed on request and not stored in Fabrico.
Read on: the OEE and MES solution overview, OEE software evaluation, light MES, MES for food manufacturing, the computer vision for OEE feature and computer vision for food manufacturing. If your daily boards are still on paper, compare digital tier boards with OEE software.
Questions operations directors ask about the MOR
What is a monthly operations review in manufacturing?
A monthly operations review, or monthly operating review (MOR), is a meeting where plant leadership and finance review safety, quality, delivery, cost, people and OEE for the month, agree what the numbers mean and commit to a few actions with owners and dates.
Who should attend a plant MOR?
The plant manager chairs it. The production manager, quality manager, HSE lead, planning lead, plant controller and an HR partner each own one section. Line leaders join for their own item.
How long should a monthly operational review meeting take?
About 90 minutes works for one plant: 10 to 20 minutes per section and 5 minutes to read back the actions. If it runs longer, the pack has too many numbers.
What KPIs belong in a monthly operations review template?
One or two per section: recordable injuries and near misses, complaints per million and scrap, plan attainment, conversion cost and the value of lost hours, absence and overtime, and line OEE split into availability, performance and quality. Each needs a definition, an owner and a line-level source.
How is the MOR different from the weekly OEE review?
The weekly OEE review fixes losses on the lines with the people who run them. The MOR looks at the month, prices the losses in money with finance, and decides where people, money and engineering time go next month.
How do you put a money value on OEE losses?
Convert each loss into hours at rated speed, then multiply by the contribution of one hour of good output if the line is sold out, or by crew and overhead cost per hour if it is not. Add scrapped material for quality losses, and state the rate you used.
Want last month's MOR pack rebuilt from timed line events? Book a demo and see how one constraint line's stops, rejects and changeovers become the six rows of the bridge.
Related articles



Latest from our blog




Real Fabrico tiles, sample data.