


 Login
 Blog
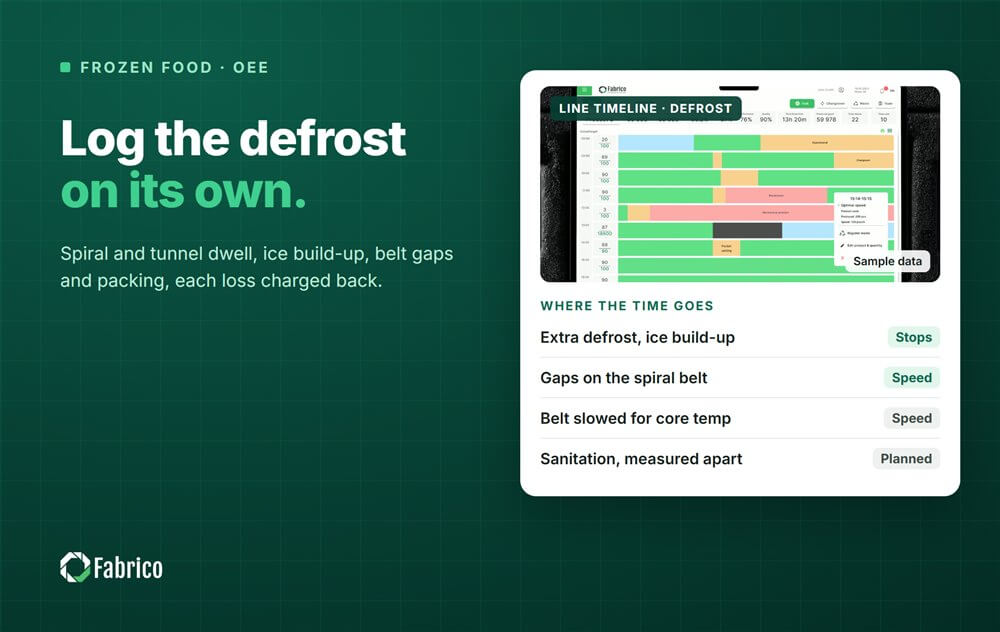
OEE for Frozen Food Production: Freezers, Defrosts and Packing

Key takeaways
- Set the ideal rate from the freezer at the dwell time each product needs, unless forming or packing is slower for that product.
- A spiral or tunnel freezer is a long buffer: a stop at the front reaches packing much later, so charge it to the machine that caused it.
- Log defrosts on their own: planned defrosts as planned, extra defrosts caused by ice build-up as Availability losses with a reason.
- Gaps on the freezer belt and a belt slowed for core temperature are speed losses, even when nothing stops.
- Freezer sanitation is measured and split from other downtime, never shortened.
Two hours into the run, the air temperature in the spiral freezer starts to creep up. Frost is building on the evaporator coils, the product at the outfeed is warmer than spec, and the shift lead slows the belt to keep the core temperature right. Nothing has stopped, yet the line makes fewer packs an hour. By the end of the shift an extra defrost has taken half an hour, and the OEE report shows one long stop with the reason 'freezer'.
The freezer in the middle of a frozen food line behaves unlike any other machine: it holds product for a long time, loses capacity as ice builds up, and needs defrost and sanitation stops of its own. This guide covers how to measure OEE around it, from the ideal rate to cold room handling, with a worked shift priced in money.
The line and where the time goes
A typical line prepares or forms the product: dough sheeting and topping for pizza, forming and coating for breaded products, blanching for vegetables. The product then goes through a spiral freezer, a straight tunnel or a fluidised bed freezer for loose vegetables, and on to packing: weighers and baggers, flow wrappers or cartoners, a case packer, a palletiser and the cold store.
| Area | Typical losses | OEE factor |
|---|---|---|
| Forming and preparation | Topping applicator or depositor stops, dough or batter problems, gaps on the belt | Availability; gaps are speed loss at the freezer |
| Freezer | Extra defrosts, fan or compressor faults, belt tracking, belt slowed for core temperature | Availability and speed loss |
| Packing | Frozen clumps in the weigher, film splice, glue not holding on cold cartons, labels lifting from condensation | Availability and micro stops |
| Palletising and cold store | Pallets waiting for the store, full transfer conveyor, no forklift | Blocking the case packer; warm product on hold is quality |
Some plants, often for loose vegetables, freeze in bulk into totes and pack later. Then freezing and packing are two lines with two OEE figures, linked by the cold store.

Setting the ideal rate around the freezer
Freezer throughput depends on two settings. Belt speed sets the dwell time each product needs to reach its core temperature. Belt loading is how many units or kg sit on each metre of belt. The ideal rate for a product is the rated loading at the belt speed that product needs, at the design inlet temperature. Write it down per product.
If forming or packing is slower than the freezer for a product, that machine sets the ideal rate instead. Use the slowest of the three, never a good week's average.
Ice build-up, defrost and sanitation
Moisture from the product and from air coming in at the openings freezes on the evaporator coils. As frost builds, air flow and capacity fall, the outfeed gets warmer, and the line has to slow down or defrost. A defrost takes the freezer out of production, and afterwards it must pull down to temperature before product goes in again.
Split defrosts into two codes. A defrost planned between runs, at the interval the freezer is designed for, can sit in planned downtime if that is your rule. An extra defrost inside the run, because frost built up faster than planned, is an Availability loss with a reason: warm or wet product at the infeed, doors left open, a run longer than the freezer can take. See planned and unplanned downtime definitions for how to keep that split clean.
Freezer sanitation is a third code. It means thawing, cleaning, drying and pulling down again, and it is part of the plant's food safety controls. Do not shorten it to lift OEE: measure it, keep it apart from defrosts and breakdowns, and track the start-up after it, from the first product in to stable output. Our guide to start-up and shutdown losses covers that part.
The freezer as a long buffer: gaps, slow belts, starved packers
A freezer can run all shift and still lose output. Short stops at the forming end leave gaps on the belt, and each gap is capacity that never comes back. When frost builds up, the belt is slowed so the core temperature still passes. The freezer PLC shows neither, because the belt is running. Both are Performance losses: compare output with the ideal rate hour by hour, as in our article on diagnosing speed loss with data.
Product spends a long time in a spiral freezer, so a ten minute stop at the topping line reaches the packers much later as starved time, when nobody connects it to the topping line. The other way round, when the case packer or the cold store transfer stops, product keeps arriving: the front end stops too, or product goes into totes by hand to be packed later. Charge starved and blocked time to the machine that caused it, as explained in starvation and blocking on linked lines.
Packing and cold room handling
Packing frozen product has its own stops. Frozen pieces clump and bridge in weigher hoppers, condensation forms where cold product meets warmer air, labels and carton glue hold less well on cold surfaces, and film behaves differently in the cold. Most of these are micro stops, cleared in under a minute and rarely written down.
At the end of the line, pallets must reach the cold store quickly. If the transfer conveyor is full or the forklift is elsewhere, cases back up and block the case packer, and product warming in the packing hall may go on hold. Log 'waiting for cold store' as its own reason, so it shows as a line loss and not as a packer problem.
Quality: core temperature, breakage and yield
Quality is good units out over units made. The usual losses: product that fails the core temperature check and must be refrozen or rejected, broken pieces and lost toppings, clumps in loose products, packs rejected by the checkweigher or metal detector, and product held after warming.
Mechanical freezers also take some moisture out of the product, so kg out is less than kg in. That yield loss does not change the unit count, but it is money: track it next to OEE.
Data sources and the camera
The freezer PLC gives belt speed, air temperature, fan and compressor state and defrost status. A counter or weigh belt at the outfeed gives output, the packing machines give their own states and counts, and quality gives core temperature checks. The operator gives the reason in one tap.
The freezer PLC says the belt is running; it does not say the belt is half empty. A camera at the freezer infeed shows gaps in the loading, and one at a packing station keeps a clip of what happened when that machine stopped. The software suggests a reason, the operator confirms it, and the clip stays with the stop as evidence.
A worked shift on a frozen pizza line
Sample line (illustrative numbers, not a customer): a pizza line rated at 40 pizzas a minute, set by the spiral freezer at the dwell time this product needs. Planned production time is 480 minutes, with the planned defrost done between shifts.
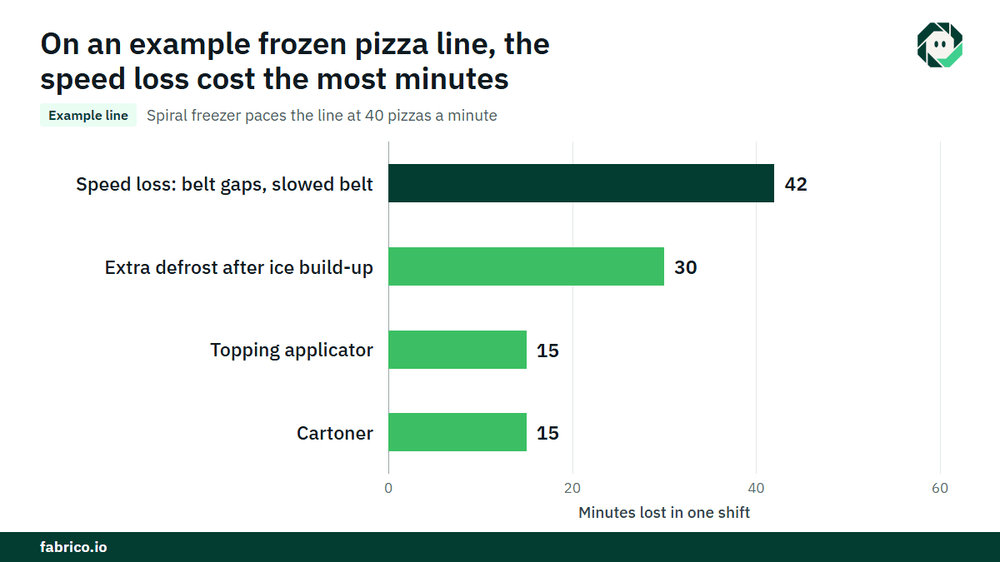
- Stops: an extra defrost after ice build-up 30 minutes, topping applicator 15, cartoner 15. Total 60 minutes.
- Run time = 480 minus 60 = 420 minutes. Availability = 420 / 480 = 87.5%.
- Ideal output: 420 x 40 = 16,800 pizzas. Made: 15,120, because of belt gaps and a slowed belt before the defrost. Performance = 15,120 / 16,800 = 90.0%.
- Rejects for core temperature, breakage and packing: 378. Good: 14,742. Quality = 14,742 / 15,120 = 97.5%.
- OEE = 0.875 x 0.900 x 0.975 = 76.8%. Check: 14,742 / 40 = 368.55 minutes at ideal rate, and 368.55 / 480 = 76.8%.
Now price it. The speed loss is 16,800 minus 15,120 = 1,680 pizzas, or 42 minutes at rated speed. The extra defrost cost 30 x 40 = 1,200 pizzas. If the line is sold out and a pizza carries $0.80 of contribution (€0.80 in a euro plant), the speed loss costs $1,344 a shift and the extra defrost $960. Over 500 shifts a year that is $672,000 and $480,000, or €672,000 and €480,000. The planned defrost between shifts is not in these numbers: it is the cost of running the freezer.
Mistakes plants make on frozen food lines
- Logging all defrosts as planned, so ice build-up never shows as a loss.
- Treating the freezer as always running while its belt carries gaps or runs slow.
- Charging packing with starved time that started at the forming end.
- Leaving 'waiting for cold store' out of the reason codes.
- Shortening freezer sanitation to win back minutes.
Where Fabrico fits
Fabrico is a computer vision enabled Manufacturing Performance Platform. On a frozen food line it starts with OEE and light MES: automatic downtime logging at the forming end, the freezer and each packing machine, and OEE live by line and shift.
- The operator confirms the reason in one tap, so an extra defrost carries its cause, not just 'freezer'.
- A camera clip as evidence for a stop where a camera watches the station, such as the freezer infeed or a packer. See computer vision for OEE.
- Losses priced in money and ranked by money, so speed loss, extra defrosts and cold store waits compare in dollars or euros.
- One view across plants for groups with several freezing lines.
- For a breakdown, a work order to the right technician with its cost.
You start on one line, with a measured baseline and a decision date agreed in advance. Each plant gets a quote after a review of its lines.
Frequently asked questions
How do you calculate OEE for a spiral freezer line?
Availability is run time over planned production time. Performance is units out over what the ideal rate allows in that run time, with the ideal set at the dwell time the product needs. Quality is good units over units made. Multiply the three.
Is a freezer defrost planned or unplanned downtime?
A defrost planned between runs at the designed interval can be planned downtime if that is your rule. An extra defrost because ice built up faster is unplanned and needs a reason. Keep both visible either way.
How does ice build-up affect OEE?
First as speed loss, when the belt is slowed to keep the core temperature, then as Availability loss, when an extra defrost stops the line. Tracking air temperature and output together shows when it starts.
Should freezing and packing have separate OEE figures?
Yes, when they are decoupled by bulk storage, as with many loose vegetables. When product flows straight from the freezer to packing, measure one line OEE and keep the station data under it.
Can a camera see an empty freezer belt?
A camera at the freezer infeed shows gaps in the belt loading that the PLC does not report, because the belt is still running. It does not see inside the freezer, and the operator confirms the reason for a stop.
See your freezing line's losses in a demo
Bring the stops, defrosts and rates from one frozen food line, and we will show the losses priced in money, by shift.








Real Fabrico tiles, sample data.