


 Login
 Blog
AVEVA PI System vs GE Vernova APM: Data Layer vs Asset Health

In short: AVEVA PI System vs GE Vernova APM is a comparison of two different layers, not two versions of one product: AVEVA PI System is operational data infrastructure that collects, stores and adds context to time-series data, and GE Vernova Asset Performance Management (APM) is a suite for asset health, reliability, integrity and failure forecasting that works on such data.
- AVEVA describes PI Server, asset framework models, event frames, Edge Data Store and connectivity through PI Interfaces, PI Connectors and AVEVA Adapters.
- GE Vernova describes APM Health, reliability analytics, SmartSignal failure models and integrity workflows, deployable as separate modules or together.
- GE Vernova lists historians among the data sources APM integrates with, so the two can be weighed as layers that stack, not as a swap.
- Line OEE with stop causes from operators is a third job; the worked example follows one injection moulding shift from tags to euros.
When both names land on one shortlist, the first useful step is to ask which layer the plant is missing. A site with no long-term tag history needs a data layer before anything else. A site with history but surprise failures on critical pumps and compressors wants an asset health layer. A site that cannot say why Line 3 lost 90 minutes on Tuesday needs line performance data with stop causes. Below, each vendor in its own words, the two job by job, a decision matrix, and one shift carried through to money. A section near the end covers Fabrico, which builds software for OEE and light MES in the cloud.
Key takeaways
- Settle the missing layer first: tag history and context, asset health and reliability, or line performance with stop causes.
- AVEVA leads PI System with sub-second collection, a PI Server sized for up to twenty million tags and event frames that log downtime with a start and an end.
- GE Vernova leads APM with health scores, SmartSignal models for more than 330 common industrial assets and recommendations sent to EAM systems.
- GE Vernova lists historians as an APM data source, so running both is a recognised pattern; the tag feed from one into the other is the thing to prove in a pilot.
- Asset health and line OEE answer different questions, so price a stop by what the line lost, not by what the asset cost to repair.
AVEVA PI System vs GE Vernova APM at a glance
Each cell paraphrases the vendor's own pages as of 14.11.2026; the exact quotes and links sit in the next two sections.
| Job | AVEVA PI System | GE Vernova APM |
|---|---|---|
| How it is described | A portfolio to collect, cleanse, store, enrich and visualise operations data | Software for higher reliability, lower maintenance cost and lower risk |
| Main parts | PI Server, Edge Data Store, CONNECT, PI Vision | APM Health, reliability analytics, SmartSignal, integrity |
| Data in | PI Interfaces, PI Connectors, AVEVA Adapters | Sensors, edge devices, IT and OT systems, historians |
| Context | Asset framework models, event frames | Asset strategies, risk, health scores |
| Analytics | Streaming calculations into KPIs, real-time alerts | Digital twin blueprints, anomaly notifications, forecasts |
| Hand-off | Data to BI, analytics and AI tools; open APIs and SDK | Recommendations sent to EAM systems for work orders |
| Where it runs | Edge, on-premises and cloud components | Modules alone or together, on AWS services |
How AVEVA describes PI System
The AVEVA PI System product page presents it as a portfolio for collecting, cleansing, storing, enriching and visualising real-time operations data. The FAQ on the same page names the core: "Core components of the offering include AVEVA PI Server, AVEVA Edge Data Store, and the CONNECT industrial intelligence platform". As of 14.11.2026, these are the parts that matter for this comparison:
- Collection. The PI System page groups connectivity as "AVEVA PI System Connectivity products (PI Interfaces, PI Connectors, AVEVA Adapters)" and says AVEVA "offers hundreds of data connectivity options for nearly all industry and vendor-specific protocols." It promises data "with sub-second granularity" and notes that "AVEVA PI System data collection options include data buffering."
- Storage and context. The PI Server page describes a "Real-time data storage and enrichment engine" and puts the ceiling for a single server at "up to twenty million tags or data streams", a figure worth testing against your own tag count. Its asset framework lets teams "Configure models to structure data according to familiar equipment, assets, and other objects".
- Events. Event frames are where PI meets downtime. The PI Server page explains that they log repeatable events with their own start and end times, and it gives downtime, shifts, start-ups and batch processes as examples.
- Calculations and alerts. PI Server can "Transform raw data into actionable KPIs and other operational metrics using streaming calculations" and lets users "Stay informed on key events and anomalies by sending real-time alerts".
- Edge. The Edge Data Store page says it keeps storing data through network or power interruptions and sends it on to PI Server or CONNECT once the link returns. The same page lists no-code OPC UA and Modbus TCP connectivity.
On getting data out, the PI System page says "In addition to pre-built integrators, you can access data programmatically using our open APIs, SDK and message format." It also lists asset analytics among use cases, with "AI-based analytics to predict asset failures". So PI is not purely storage; it is the base layer AVEVA builds analytics, displays and integrations on.
How GE Vernova describes APM
GE Vernova's Asset Performance Management page says APM "enables increased reliability, decreased maintenance costs, lowered risk, and accelerated decarbonization efforts". It is built as modules that can be used "individually as separate modules or together, as an integrated enterprise solution", and it describes "composable and interoperable APM backed by the elastic scaling nature of AWS services". As of 14.11.2026:
- Data in. The page lists "ingestion of mission-critical data from sensors, edge devices, IT systems, OT systems" and says APM can "integrate with EAM, CMMS, historians and other data sources".
- Asset health. The APM Health page says it "helps users to digitize condition-based maintenance programs" and lets teams "View in near real-time the asset health and condition status of critical equipment". It adds: "The Asset Health Score, updated automatically every night, is calculated by evaluating multiple inputs".
- Failure models. The SmartSignal page describes "AI/ML-driven models for detecting, diagnosing, & forecasting emerging failures" and says "The growing Digital Twin catalogue covers more than 330 common industrial assets".
- Reliability. The asset reliability page says "Reliability analytics provides a comprehensive set of analytical tools to help better understand causes" and "APM supports Reliability-Centered Maintenance (RCM) and risk-based approaches."
- Integrity and strategy. The main page lists the ability to "create asset strategies, identify risk, perform condition-based maintenance, deploy connected worker solutions" and to "ensure fixed asset compliance with mechanical integrity workflows".
The output of APM is a decision about an asset: watch it, fix it now, fix it at the next stop, or change its strategy. The APM Health page closes that loop with "Send recommendations directly to EAM systems for seamless work order execution".
How the two relate: a data layer and an asset health layer
The cleanest way to read this pair is as a stack. Machines and sensors produce values. A data layer such as PI System collects them, keeps them with their original time stamps and gives them context, for example "Pump 2 on Press 4". An asset health layer such as GE Vernova APM reads values like these and asks whether a given asset is drifting toward failure, what the risk is, and what work should follow. GE Vernova's own words put historians on the input side of APM; AVEVA's put BI, analytics and AI tools on the output side of PI.
The Institute of Asset Management (accessed 14.11.2026) quotes ISO 55000 on asset management as "the coordinated activity of an organisation to realize value from assets." That is the job APM software is sold into: strategy, risk and work on physical assets. Collecting and storing tags is a different job, and a plant with a weak data layer will struggle with any asset health tool, whoever makes it.
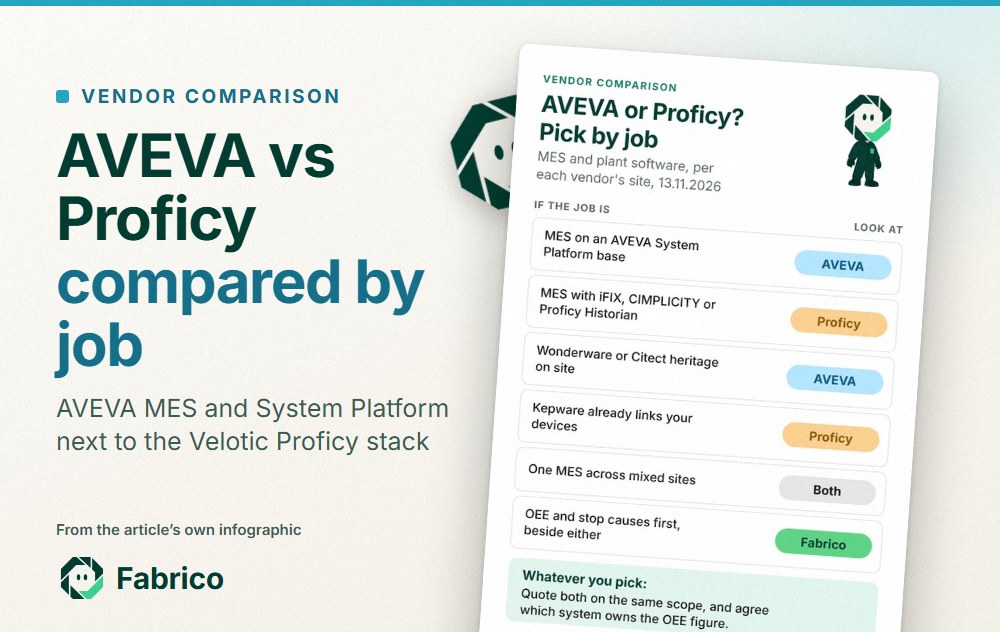
Two cautions follow from the stack. First, both vendors also reach into the other layer: AVEVA lists failure prediction among PI System use cases, and GE Vernova's portfolio also includes a historian of its own, Proficy Historian, linked from the APM page. If both families are in the plant already, see the existing comparison of AVEVA vs Proficy. Second, a link between the two layers is integration work. Ask each vendor to show the connector live, name the tags it carries and state the rate at which they arrive.
AVEVA PI System vs GE Vernova APM, job by job
Getting data in. AVEVA's answer is breadth of collection: three connectivity families, hundreds of protocol options and buffering at the source. GE Vernova's APM page talks about ingestion from "sensors, edge devices, IT systems, OT systems" and integration with historians. In practice the PI side answers "how does a value get from the PLC into history", and the APM side answers "which stored values does each asset model need". Protocols matter on both sides; the OPC Foundation (accessed 14.11.2026) presents OPC UA as a service-oriented architecture built for platform independence, and calls information modelling the fundamental element of OPC UA, the part that "turns data into information".
Keeping history and context. PI Server keeps the archive and the asset framework holds the models, so "Press 4, hydraulic pump, oil temperature" can be found by asset rather than by a tag code. APM keeps a different kind of context: asset strategies, risk and a health score per asset. The two models overlap in the asset list, and someone has to own the master list of assets and tag names so both stay in step.
Watching asset health. This is the core of APM Health: near real-time health and condition status, rules that "trigger alerts", and a score refreshed nightly. PI Server can also raise real-time alerts on events and anomalies, so the question to settle is not whether alerts exist but where the health logic for a critical asset should live, and who maintains it.
Forecasting failures. SmartSignal compares sensor readings with predicted normal values; its page says "Anomaly detection models compare sensor readings to a particular machine's normal, predicted values" and that "Notifications provide prioritized diagnostics with a localized, apparent cause for each developing problem". AVEVA lists AI-based failure prediction among PI System use cases. For either, ask for a back-test on one past failure from your own history before trusting the warnings.
Reliability and integrity work. GE Vernova covers reliability analytics, RCM and risk-based approaches, and mechanical integrity workflows for fixed assets. These are reliability engineering tasks: failure frequencies, costs and trends per asset class. PI's role in that work is to supply the operating history those analyses read.
Logging downtime events. PI event frames can record downtime as an event with a start and an end, built from rules on tags. APM records the asset's side of a failure. Neither event is yet a line OEE figure: that needs planned time, the ideal rate of the product running and the reason the operator gives, as the worked example shows.
Sites and deployment. AVEVA describes integrated "edge, on-prem and cloud components" and an Edge Data Store that keeps collecting through outages. GE Vernova describes APM modules deployed alone or together on AWS services. For a multi-site group, map which sites have a data layer today and which assets justify an APM model, before any licence talk.
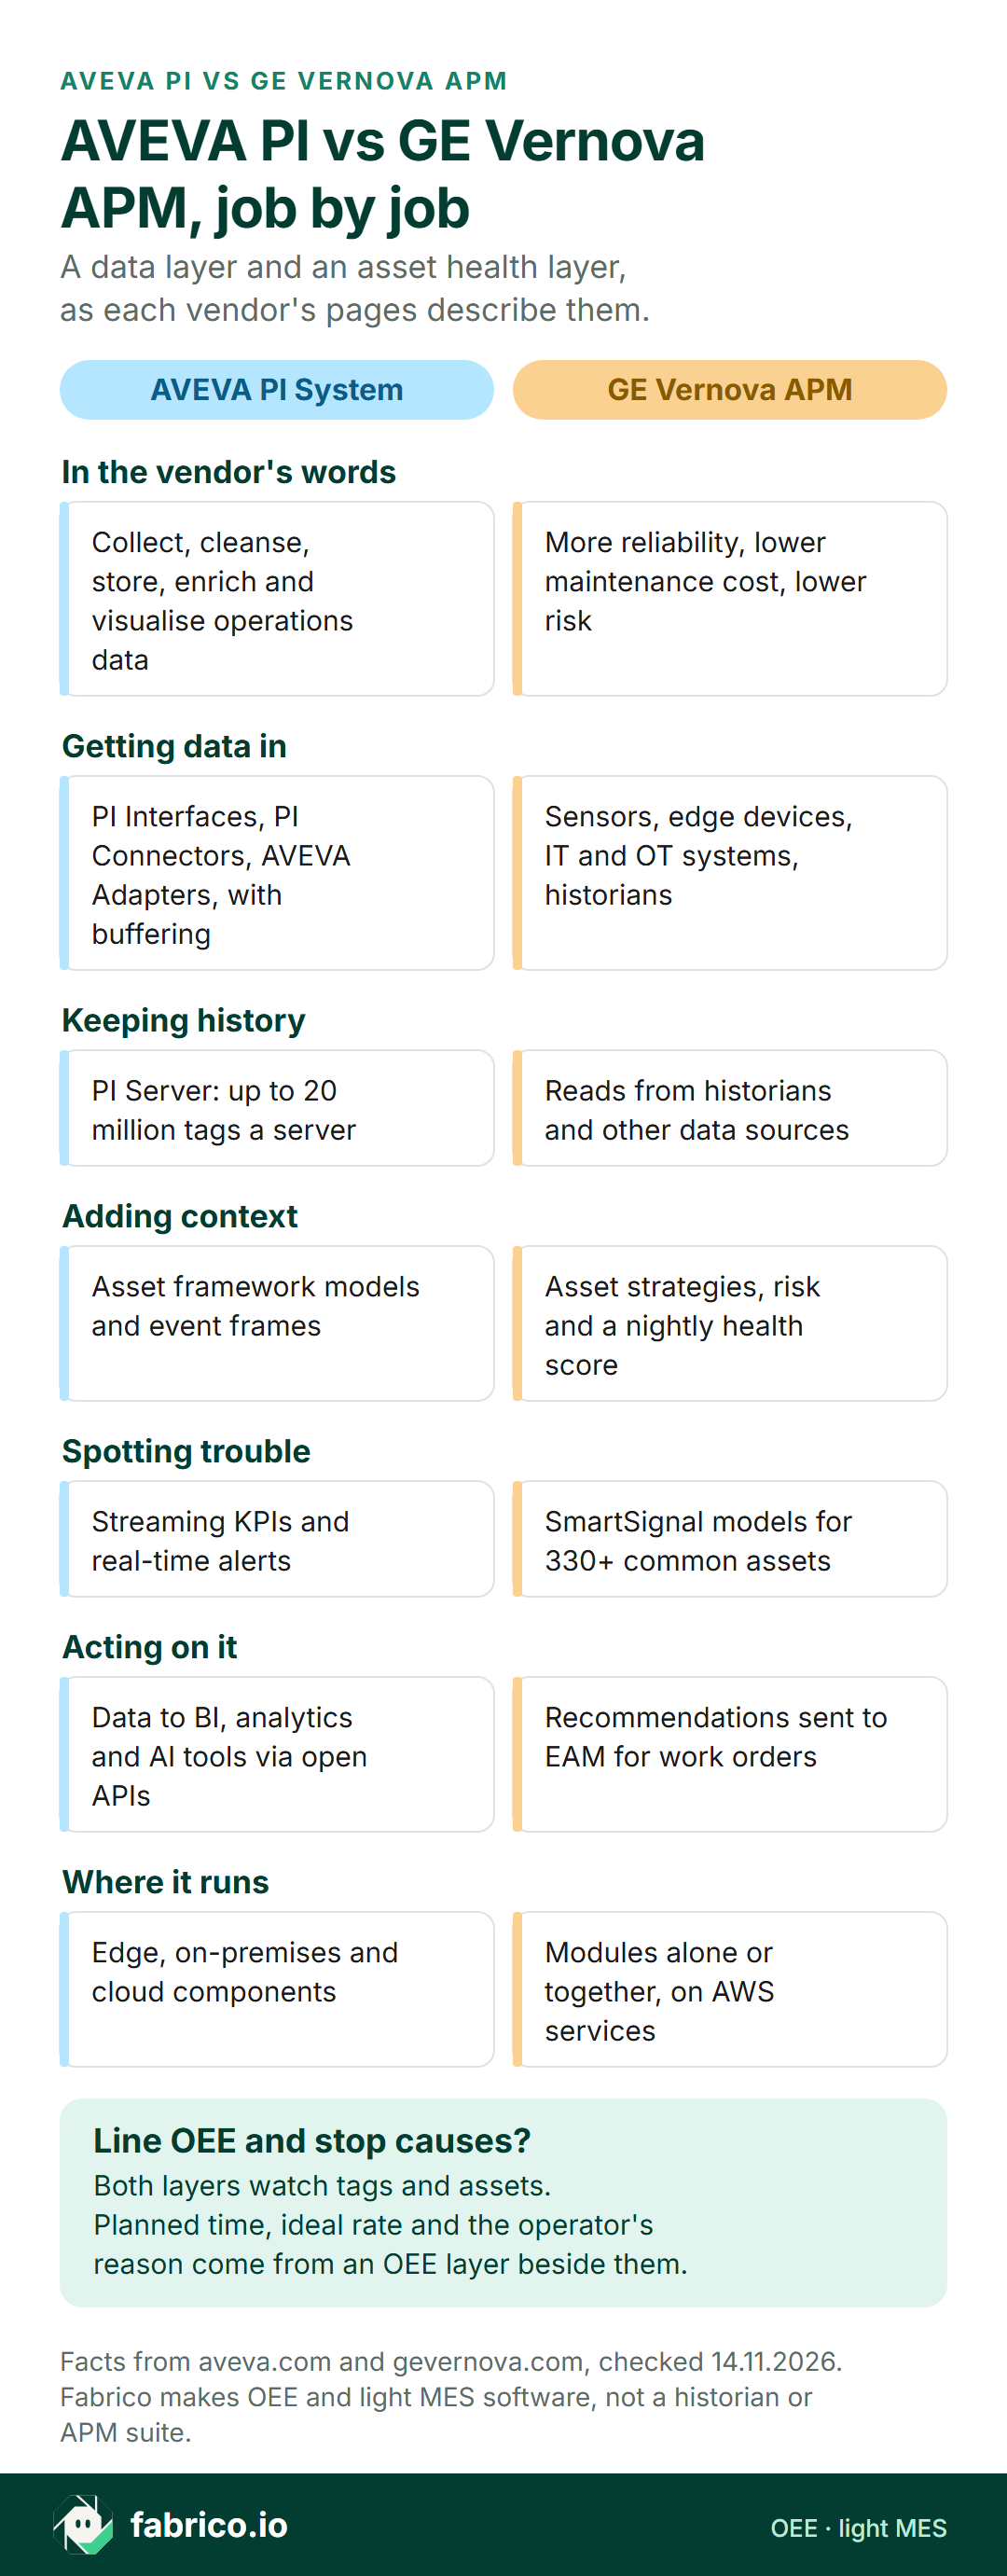
Text version of this infographic
- Job by job: AVEVA PI System and GE Vernova APM. A data layer and an asset health layer, side by side.
- In the vendor's words. AVEVA PI System: Collect, cleanse, store, enrich and visualise operations data. GE Vernova APM: More reliability, lower maintenance cost, lower risk.
- Getting data in. AVEVA PI System: PI Interfaces, PI Connectors, AVEVA Adapters, with buffering. GE Vernova APM: Sensors, edge devices, IT and OT systems, historians.
- Keeping history. AVEVA PI System: PI Server: up to 20 million tags a server. GE Vernova APM: Reads from historians and other data sources.
- Adding context. AVEVA PI System: Asset framework models and event frames. GE Vernova APM: Asset strategies, risk and a nightly health score.
- Spotting trouble. AVEVA PI System: Streaming KPIs and real-time alerts. GE Vernova APM: SmartSignal models for 330+ common assets.
- Acting on it. AVEVA PI System: Data to BI, analytics and AI tools via open APIs. GE Vernova APM: Recommendations sent to EAM for work orders.
- Where it runs. AVEVA PI System: Edge, on-premises and cloud components. GE Vernova APM: Modules alone or together, on AWS services.
- Line OEE and stop causes? Both layers watch tags and assets. Planned time, ideal rate and the operator's reason come from an OEE layer beside them.
- Facts from aveva.com and gevernova.com, checked 14.11.2026. Fabrico makes OEE and light MES software, not a historian or APM suite.
Decision matrix: AVEVA PI System or GE Vernova APM for your plant
Read the rows as first jobs. A plant may well run a data layer and an asset health layer together; the matrix shows where each one's own pages put the weight and what a pilot should prove.
| If this is you | Look first at | Why (vendor page) | Prove it in the pilot by |
|---|---|---|---|
| Tags sit in PLCs and SCADA screens, with little long-term history | AVEVA PI System | PI Server page: one server for up to twenty million tags | Loading 30 days of one line's tags and finding them by asset, not by tag code |
| Remote or weak-network sites lose data in outages | AVEVA PI System, Edge Data Store | Edge Data Store page: stores locally, then forwards | Pulling the network cable for an hour and checking for gaps |
| Downtime needs a start, an end and a rule behind it | AVEVA PI System, event frames | PI Server page: event frames for shifts, start-ups and downtime | Matching a week of event frames against the operator log |
| History exists, but critical rotating assets still fail by surprise | GE Vernova APM, APM Health | APM Health page: health and condition status in near real time | A health score for five critical assets, checked against last year's failures |
| Reliability engineers want early warnings from sensor patterns | GE Vernova APM, SmartSignal | SmartSignal page: models for more than 330 common industrial assets | A back-test on one known failure from your own history |
| Fixed assets carry inspection and compliance duties | GE Vernova APM, integrity | APM page: mechanical integrity workflows | One inspection plan run end to end in the test system |
| Maintenance recommendations must land in the EAM | GE Vernova APM | APM Health page: recommendations sent to EAM systems | One recommendation turned into a work order in a test EAM |
| Both layers are wanted, PI under APM | Both, side by side | APM page lists historians as a source; PI System page lists open APIs and an SDK | A named list of PI tags arriving in APM at an agreed rate |
| The plant needs line OEE with stop causes from operators | An OEE or light MES layer next to both | ISA-95 page: operations sit above control | Shift OEE matching a hand count on one line for two weeks |
For a wider view of historians, the manufacturing data historian guide covers what to check before buying one. For the asset side, the asset performance management guide explains the discipline and its pieces.
Where OEE and stop causes fit beside either
Asset health and line performance overlap less than buyers expect. An APM model watches a pump, a gearbox or a compressor. A line stops for many reasons that have nothing to do with asset condition: a changeover, a late material delivery, a missing operator, a quality hold, a jam at the conveyor. OEE multiplies availability, performance and quality for the whole line, and three of its inputs are not tags at all: planned production time, the ideal rate of the product on the line, and the reason the line stopped.
The ISA-95 standard page (accessed 14.11.2026) says the ISA-95 model "consists of five layers or levels", and that the standard is mainly about the interface between levels 3 and 4, where operations meet the business. Historians sit close to control. Asset health and OEE both sit in operations, but they serve different owners: reliability and maintenance on one side, production and CI on the other.
The money behind both is large. A NIST study of manufacturing machinery maintenance (accessed 14.11.2026) estimated USD 57.3 billion of machinery maintenance spending in 2016 for the sectors it covered, and preventable losses of "18.1 billion due to downtime". Those are US figures for 2016, from a survey, so use them as scale, not as a benchmark for one plant. The figure that matters comes from the plant stop log, which is what the worked example below builds.
The OEE arithmetic itself is set out in OEE calculation, and reduced speed loss vs minor stops explains why slow cycles and short stops deserve separate treatment.
Where Fabrico fits beside PI System or APM
Fabrico is neither a historian nor an APM suite and sells no SCADA, HMI or connectivity products, so PI System and GE Vernova APM stay where they are. What Fabrico does is cloud OEE and light MES for production teams; the solution overview spells out the scope.
- Signals from the line. Each line's run state, stops and counts arrive from a PLC, a retrofitted sensor or a counter, and the machine connectivity page names OPC UA and MQTT as supported protocols.
- Reasons from people. Operators tap in why the press or filler stopped, using a tablet or phone beside the machine. Fabrico turns that into OEE, downtime and lost money per line and per shift, viewable in a browser or the iOS and Android apps.
- Work orders. A work order opens from a logged stop in one tap, and you can set chosen stop reasons to create that work order automatically as soon as the reason is logged.
- Manual steps. Hand-fed stations without a usable signal can get the camera add-on, which tallies finished pieces; letting the camera add-on suggest a stop reason is planned work on the Roadmap. The computer vision guide for FMCG plants shows where the camera add-on earns its place.
- Data out. Shift results reach other systems via webhooks, the REST API, or an Excel or CSV download.
Fabrico claims no ready connector to PI System or GE Vernova APM; prove that hand-off in a pilot. Buyers comparing OEE tools can start with OEE software, and for what sits between a full MES and nothing, light MES vs full MES. To see shift OEE with operator stop reasons, book a demo.
Worked example: a pump trip on a PET preform press, priced in euros
Sample data, made up for this page; not a customer and not a product screen. A packaging plant runs a PET preform injection moulding machine with a 48-cavity mould. The ideal cycle is 8.0 seconds, so 7.5 cycles a minute and 360 preforms a minute at best. The plant runs two 12-hour shifts a day.
The three layers in this plant. The data layer stores the machine's hydraulic oil temperature, pump outlet pressure, motor current and cycle counter, and an event frame records the start and end of a stop. The asset health layer runs a model on the hydraulic pump. The OEE layer holds the shift plan, the ideal rate per mould and the reasons operators pick at the press.
The shift. 720 minutes with two 20-minute breaks: 680 planned minutes, so at most 680 x 360 = 244,800 preforms. Stops: the hydraulic pump tripped on high oil temperature and was down 58 minutes; a planned colour change took 35 minutes; 18 short stops of 1.5 minutes each, mostly a low resin hopper and a sticking preform at the take-out robot, took 27 minutes. Total stops 120 minutes, leaving 560 running minutes. The machine made 3,900 cycles, or 187,200 preforms, at about 8.6 seconds a cycle. 3,744 preforms went to the reject bin, leaving 183,456 good.
The OEE arithmetic. Availability is 560 / 680 = 82.35%. Ideal output in the running time is 560 x 360 = 201,600, so performance is 187,200 / 201,600 = 92.86%. Quality is 183,456 / 187,200 = 98.00%.
OEE is 82.35% x 92.86% x 98.00% = 74.94%, which matches 183,456 good preforms / 244,800 possible.
Carried to money. Assume, as sample data, a contribution margin of EUR 9.00 per 1,000 good preforms. The gap to ideal is 244,800 minus 183,456 = 61,344 preforms, so 61,344 x EUR 0.009 = EUR 552.10 a shift. With two shifts on each of 30 production days a month, that is 60 shifts, or EUR 33,126 a month and EUR 397,509 over 12 such months. The pump trip alone cost 58 x 360 = 20,880 preforms of capacity, or EUR 187.92.
What each layer saw. The data layer has the oil temperature climbing for days and the stop logged to the second. The asset health layer, in this sample, raised a warning on the pump four days earlier. The OEE layer shows that the pump was 58 of 120 lost minutes; the other 62, the colour change and the short stops, are line losses outside what an asset model watches. If the warning had been acted on by swapping the pump inside the colour change, adding 20 minutes to it, the pump's availability loss would have been 20 minutes instead of 58. That saves 38 x 360 = 13,680 preforms of capacity, EUR 123.12 for that one event, and lifts availability from 82.35% to 598 / 680 = 87.94%.
The lesson for this pair. PI System and APM together help explain and prevent the pump trip. The short stops at the take-out robot still need a reason and a cost in front of the shift lead, and that is line performance work. That is why the line's stop log and its price in euros belong in the same review as the asset alerts. More on the unplanned side in unplanned downtime, and on tools that log it in equipment downtime tracking software.
Questions to ask both vendors
- Which layer is your product built for, and which of our current systems would it replace or feed?
- Which data sources can the product read today, shown live on your own pages or in a running system, and at what rate do values arrive?
- Where is the master list of assets and tag names kept, and what happens to history and models when a tag is renamed?
- How are alerts tuned, who owns each rule or model, and how do we measure false alarms in the first three months?
- Can you back-test on one failure from our own history, and show what the product would have flagged and when?
- How does a recommendation or event become a work order in our EAM or CMMS, and who closes the loop?
- Which system will hold shift plans, ideal rates and operator stop reasons, and whose OEE figure goes to the plant review?
What to do this week
- Name the missing layer. One sentence each for history and context, asset health, and line performance: what exists today and who owns it.
- Pick five critical assets and one line. List the tags each asset has today, and the last three failures on each.
- Price one stop. Take last month's longest unplanned stop on that line and carry it to euros with your own margin per unit, the same way the preform example does.
- Send both vendors the same question list, with your five assets and one line attached, and ask for answers in writing.
- Agree the pilot test before the pilot. For example: named PI tags arriving in APM at an agreed rate, one back-tested failure, and shift OEE that matches a hand count.
What people ask next
Is GE Vernova APM a replacement for AVEVA PI System?
They are described for different jobs. AVEVA describes PI System as a portfolio to collect, store, enrich and visualise operations data. GE Vernova describes APM as software for asset health, reliability, integrity and failure forecasting, and lists historians among the data sources it integrates with.
Can GE Vernova APM use data from AVEVA PI System?
GE Vernova's APM page says APM can integrate with EAM, CMMS, historians and other data sources. Ask GE Vernova to show the PI System connection in a running system, with named tags and the rate at which values arrive, before you rely on it.
Does AVEVA PI System do asset health monitoring?
AVEVA's PI System page lists AI-based analytics to predict asset failures among its use cases, and PI Server can send real-time alerts on events and anomalies. Compare that with GE Vernova's APM Health and SmartSignal pages job by job for the assets that matter.
Is AVEVA PI System the same as OSIsoft PI?
Yes, it is the same product family. AVEVA now presents it as AVEVA PI System, with PI Server at its core, and many plant documents still use the OSIsoft name.
Where does OEE come from if we run both?
OEE needs planned time, the ideal rate of the product running and the reason the line stopped, on top of machine signals. That usually sits in an OEE or light MES layer, fed by the same signals the historian stores.
Does Fabrico replace AVEVA PI System or GE Vernova APM?
No. Fabrico covers OEE and light MES in the cloud, using run, stop and count signals from each line plus the reasons operators pick, so a plant can keep PI System, GE Vernova APM or both for history and asset health.
Want shift OEE with stop reasons and lost money per line, next to the historian and asset health tools you already run? Book a demo.
Related articles



Latest from our blog



Real Fabrico tiles, sample data.