


 Login
 Blog
6 Best Performance (OEE) Software Tools for Power Generation & Renewables (2026 Review)

Key Takeaways
-
Availability is the Currency: In power gen, OEE is often synonymous with "Availability Factor" or "Capacity Factor." A stopped turbine or a dirty solar panel is direct revenue loss.
-
The remote challenge: Wind and Solar assets are distributed across miles. Teams need availability and downtime per unit, on web or phone, to protect the performance curve.
-
Performance Ratio (PR): For renewables, OEE calculates "Actual Output" vs. "Theoretical Potential" (based on weather). Software must integrate weather data.
-
Top Picks: We review Fabrico, Power Factors, GE Vernova, AlsoEnergy, Aveva, and SparkCognition.
In the Power Generation industry, you don't produce "parts." You produce Kilowatt-hours (kWh).
But the principles of OEE (Overall Equipment Effectiveness) apply just as strictly here as they do in a car factory.
-
Availability: Is the turbine spinning?
-
Performance: Is it hitting the ideal power curve for this wind speed?
-
Quality: Is the power frequency and voltage within grid code?
The challenge in Energy, especially Renewables, is that your factory floor is spread across 5,000 acres of desert or 20 miles of ocean.
Standard manufacturing OEE tools fail here because they expect a machine to be under a roof. You need software that handles Geospatial Data, Weather Normalization, and Mobile Workforce Management.
Here are the 6 best Performance and OEE software tools for the Energy sector.
1. Fabrico (Best for Generating Unit Downtime and Availability)
Power assets lose revenue to forced outages and derates on turbines, inverters and balance of plant.
Fabrico applies the OEE method to those units, logging stops from a PLC or IoT sensor, with the cause tagged by operators.
Key Features for Power Gen:
-
Outage Log: Start time and length come from the signal, and staff add the cause from an agreed list.
-
Derate Tracking: Running under rated output is shown as lost Performance rather than hidden in the total.
-
Site Comparison: Several plants share one screen, which makes the weak site obvious.
-
Alert Rules: Decide which events reach which people, through in-app messages, push or email.
Best For: Asset owners who want availability losses per unit, by cause.
2. Power Factors (Unity) (Best for Renewable Portfolio Management)
Power Factors is the industry standard for managing mixed renewable portfolios (Solar, Wind, Storage).
Their Unity platform normalizes data. It doesn't matter if you have Vestas turbines, SMA inverters, and Tesla batteries. Power Factors brings it all into one dashboard.
They excel at Performance Analysis. They calculate the "Lost Energy" categories rigorously: How much did we lose due to curtailment? Soiling? Snow? Grid unavailability?
It is a data analyst's dream, but it relies on external tools (like Fabrico) to actually manage the repair work.
Best For: Asset Managers overseeing large, mixed renewable portfolios.
3. GE Vernova (APM) (Best for Thermal & Turbine Health)
GE Vernova (formerly GE Digital/Predix) is the heavyweight for rotating equipment.
If you run Gas Turbines, Steam Turbines, or massive Hydro plants, GE APM is the gold standard.
It uses Digital Twins, physics-based models of the turbine, to predict failures. It knows exactly how thermal stress affects the blade life.
It calculates OEE based on "Thermal Efficiency" and "Heat Rate." It is expensive and complex, but for high-value assets, the predictive capabilities are unmatched.
Best For: Thermal plants (Gas/Coal) and large Wind fleets using GE turbines.
4. AlsoEnergy (PowerTrack) (Best for C&I Solar)
AlsoEnergy is a dominant player in the Commercial & Industrial (C&I) and Utility Solar space.
Their PowerTrack platform is hardware-integrated. They often provide the onsite dataloggers (DAS).
It is excellent for Performance Benchmarking. It overlays "Actual Power" against "Modeled Power" (using satellite weather data) to show your Performance Ratio (PR) in real-time.
It is simpler than Power Factors, making it great for monitoring hundreds of smaller solar rooftops or carports.
Best For: Solar PV fleets (Commercial & Utility scale).
5. Aveva (PI System) (Best for Operational Data History)
Aveva PI System is the "Data Historian" found in almost every Nuclear, Coal, and Gas plant (and many wind control centers).
It ingests massive amounts of high-frequency time-series data.
For OEE, PI is the raw engine. It allows engineers to build custom "Event Frames" to track start-up curves and trip events.
It is not positioned as an out-of-the-box OEE tool; it is a development platform for data engineers who want to analyze long-term operational trends.
Best For: Utilities with large engineering teams and diverse assets.
6. SparkCognition (Ensemble) (Best for AI Predictive Analytics)
SparkCognition uses Artificial Intelligence to maximize production.
In Wind Energy, "Yaw Misalignment" is a silent killer of OEE. If the turbine isn't facing the wind perfectly, you lose 5-10% of power.
SparkCognition’s AI analyzes the SCADA data to detect this misalignment without needing extra sensors.
It focuses purely on Prescriptive Analytics, telling you exactly what to tweak to squeeze more kWh out of the asset.
Best For: Wind Farm owners looking for AI-driven performance optimization.
Comparison: Managing the Grid
Which tool fits your fleet?
| Feature | Fabrico | Power Factors | GE Vernova | AlsoEnergy | Aveva (PI) | SparkCognition |
| Primary Strength | Unit Availability (Downtime) | Portfolio Data (Renewables) | Asset Health (Turbines) | Solar Monitoring (DAS) | Data History (Historian) | AI Analytics (Optimization) |
| Metric Focus | Availability & Downtime | Performance Ratio (PR) | Heat Rate / Health | Actual vs. Expected | Time-Series Trends | Power Curve Opt. |
| Mobile App | Native (iOS/Android) | Limited | Limited | Limited | None | None |
| Maintenance Link | Native (CMMS) | Integration | APM Module | Ticket System | Integration | None |
| Industry | Solar/Wind/Hydro | Renewables | Thermal/Wind | Solar PV | Utilities | Wind/Solar |
Conclusion: Data vs. Dirt
In Power Generation, you have plenty of data. The SCADA systems are screaming at you.
If you need to analyze that data for financial reporting, Power Factors or AlsoEnergy are excellent.
If you need to predict turbine failure using physics, GE Vernova is the king.
But when a turbine stops or an inverter fails, the first question is how long and why. Fabrico logs stops as availability and downtime, with the reason operators tag, so your team can get the asset back online and generating revenue.
Ready to boost Availability?
See how Fabrico measures availability and downtime on generating units.
See Fabrico live. Book a demo.
Request a demoRelated articles





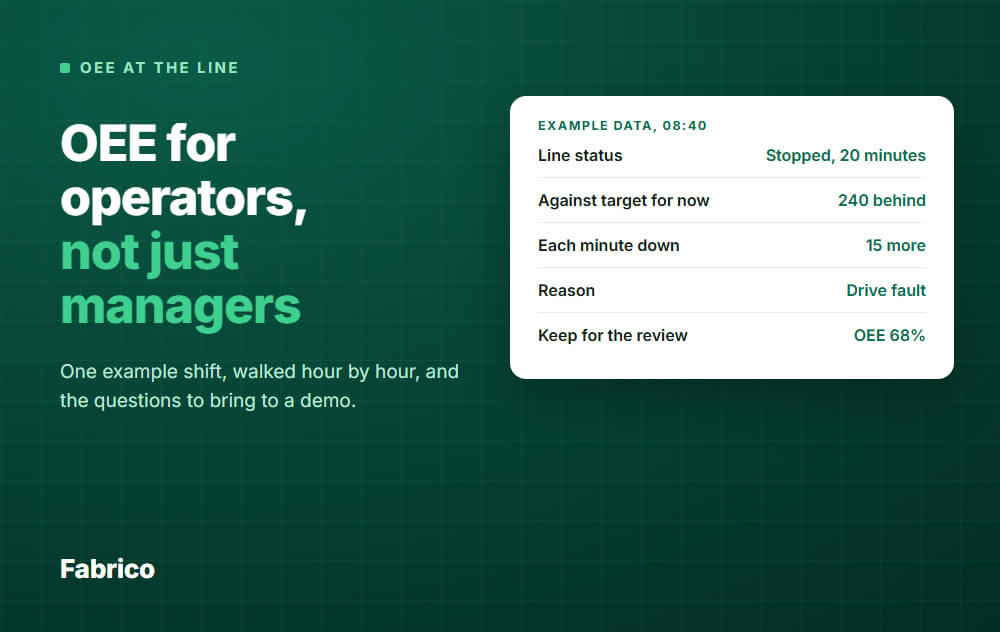


Real Fabrico tiles, sample data.