







 Login
 Blog
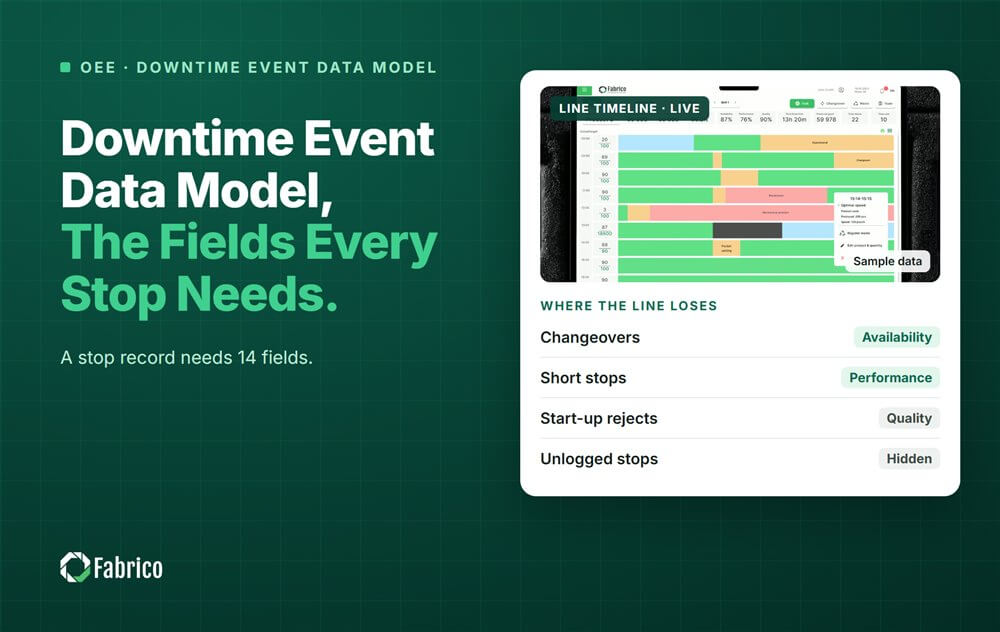
Downtime Event Data Model: The Fields Each Stop Record Needs

Key takeaways
- One stop, one row, with one start, one end and one reason.
- Timestamps come from the machine or gateway clock, not from the database.
- The OEE loss is fixed per reason code in setup. The operator never picks it.
- Starved and blocked are states, linked to the stop that caused them.
- Price every row, so the list can be sorted by money, not only by minutes.
Each stop on a line should land as one row with the same fields, whatever machine it came from and whoever logged it. Get those fields right once, and the Pareto, the OEE and the cost of each loss all come out of the same table.
Fabrico, OEE and light MES software with AI cameras, logs each stop automatically and asks the operator to confirm the reason in one tap. The record below is the vendor-neutral version. Use it to check any system, including a spreadsheet you build yourself.
What is a downtime event?
A downtime event is one unbroken period in which a machine did not produce, with one start time, one end time and one confirmed reason.
Very short stops need a rule of their own. No standard fixes the cutoff, so each plant sets one. A common rule flags any cycle that runs 1.5 to 2 times longer than the ideal cycle.
Stops under the plant's cutoff count as minor stops in Performance. They are counted and timed, but nobody asks the operator for a reason each time.
Which fields does each stop record need?
These 14 fields cover the stop, its cause, its context and its price.
| Field | Example | Filled by |
|---|---|---|
| 1. Event ID | E-1106-0417 | System |
| 2. Plant, line, machine | Plant 2, line 4, filler | Setup |
| 3. Start time | 06:41:12 on the machine clock | Machine or gateway |
| 4. End time | 06:49:40 | Machine or gateway |
| 5. Machine state | Breakdown, starved, blocked, changeover, off | Machine signal |
| 6. Linked event | The upstream stop that starved it | System |
| 7. Reason code | Capper jam | Operator, in one tap |
| 8. OEE loss | Availability, Performance, Quality or planned | Setup, per reason code |
| 9. Planned? | No | Setup and the shift calendar |
| 10. Order and SKU | Order 5512, 1 litre bottle | The order system |
| 11. Shift | Shift B | Shift calendar |
| 12. Confirmation | Confirmed 06:52, edits kept with their time | System |
| 13. Evidence | Link to the camera clip | Camera, where fitted |
| 14. Cost | Lost minutes times the price of a minute | Calculated |
Record the shift, not a named operator. A stop log is there to fix the process. It should never become a way to rank people.
How should reason codes link to OEE losses?
Each reason code belongs to exactly one OEE loss, and that link is set once in setup. If operators choose the loss themselves, the same jam lands in Availability on one shift and in Performance on the next.
- Keep the list short: 10 to 20 codes per line. More than 30 makes the operator's choice unreliable.
- Split the quality stop: a quality check that halts the line is Availability; the rejected units are Quality.
- Watch "Other": above 5% of stops, it signals missing categories, not lazy operators. Read the free text each month and promote clusters to codes.
- Test the list: three operators code the same five stops. Rewrite any pair of codes they disagree on.
Our guide to downtime reason code design goes deeper, and operator friendly reason codes shows how to keep the list usable on a tablet.
How do you record starved and blocked time?
A machine that waits for product is not broken. Give it the state "starved" or "blocked", and link the row to the stop that caused the wait.
OPC UA for Machinery draws the same line. Its state OutOfService means a technical reason inside the machine, such as a breakdown. NotExecuting means the machine is fine but waits, for an outside reason like starvation, a changeover or no order.
With the link in place, you can report two Availability figures for each machine: all causes, and its own causes only. Only the second is that machine's to fix.
Worked example: one hour of stops on a filler
Sample line (illustrative numbers, not a customer). A filler runs at 600 bottles a minute. The contribution margin is USD 0.12 a bottle (about EUR 0.11), so one lost minute at the filler costs USD 72 (about EUR 66). The plant's cutoff for minor stops is 30 seconds.
| Start | Minutes | State | Reason | OEE loss | Cost |
|---|---|---|---|---|---|
| 06:41 | 8 | Breakdown | Capper jam | Availability | USD 576 (EUR 530) |
| 07:02 | 3 | Starved | Linked to a depalletiser stop | Availability | USD 216 (EUR 199) |
| 07:05 to 07:55 | 4 | Running | 11 minor stops under 30 seconds | Performance | USD 288 (EUR 265) |
| 07:20 | 12 | Changeover | Format change over its standard | Availability | USD 864 (EUR 795) |
| 07:40 | 5 | Breakdown | Other: "sensor" | Availability | USD 360 (EUR 331) |
In one hour the filler lost 8 + 3 + 4 + 12 + 5 = 32 minutes, worth USD 2,304 (about EUR 2,120).
Of the 28 minutes that needed a reason, 23 have a specific one. The other 5 sit in "Other". Reason coverage = 23 / 28 = 82.1%.
Sorted by minutes, the capper jam looks like the biggest problem. Sorted by money, the changeover overrun comes first at USD 864. And the 3 starved minutes belong on the depalletiser's list, not the filler's.
Which mistakes break a downtime data model?
- Database timestamps. Stamp each event with the machine or gateway clock at the moment it happens.
- One row per shift. A daily total hides which stop cost the most.
- The operator picks the OEE loss. Fix it per code in setup instead.
- Fifty codes. A long list pushes everyone to "Other".
- No edit history. Keep the first reason and every change, each with its time.
- Starved time on the wrong machine. Link it to the stop that caused it.
- Names in the report. Report by line and shift, never by person.
For the wider picture of how stops, counts and shifts fit together, see our OEE data model. For the short stops, read our guide to micro stops.
Where does Fabrico fit?
Fabrico is a computer vision enabled Manufacturing Performance Platform. OEE and light MES come first. Each stop becomes one record of this kind, without retyping.
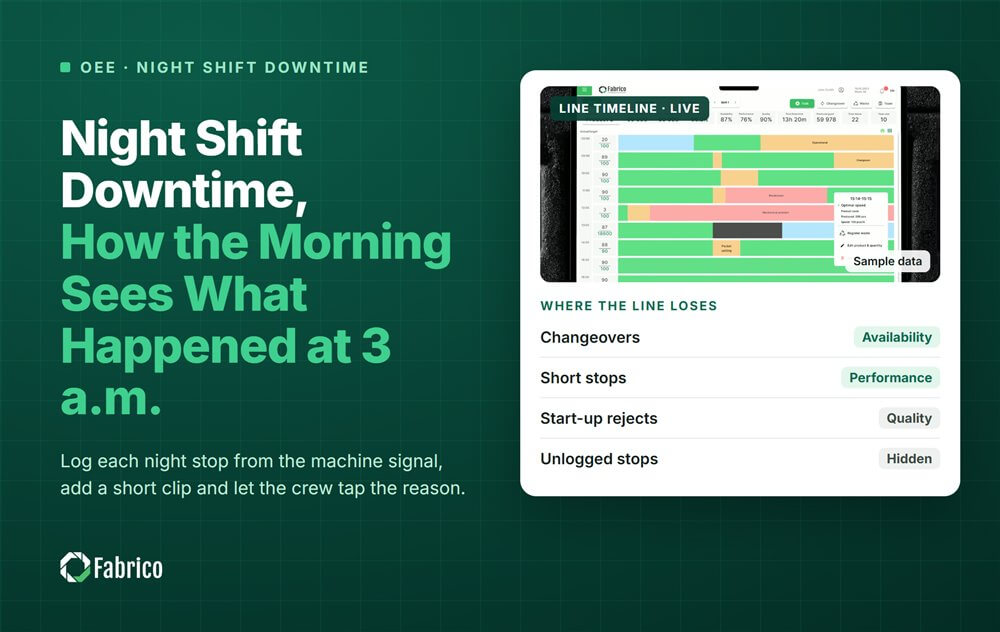
- Automatic downtime logging from the machine signal, with start and end times.
- The operator confirms the reason in one tap, from a short list per line.
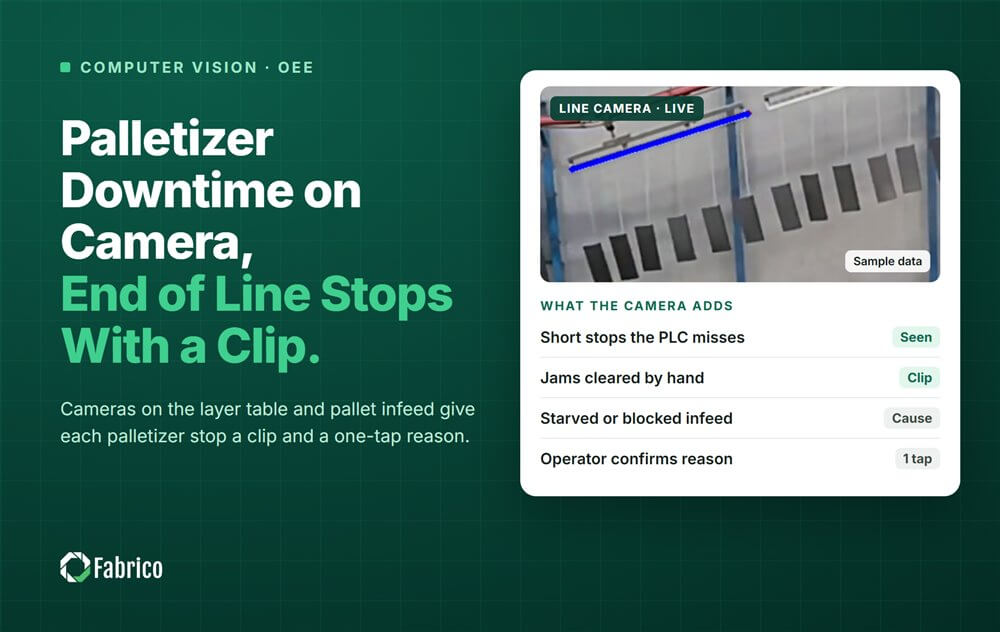
- A camera clip as evidence for a stop, where a camera watches the station.
- Every loss priced in money and ranked, so the costliest stop rises to the top.
- A work order to the right technician, with its cost, when the stop is a breakdown.
It is the OEE and downtime layer of a light MES, and it starts with a pilot on one line. There is no free plan and there are no tiers: each plant gets a quote.
Frequently asked questions
What fields should a downtime log have?
Start with the machine, the start and end time from its clock, the machine state and the reason code. Add the OEE loss it maps to, and whether it was planned. Add the order and SKU, the shift, the confirmation time, a camera clip where you have one, and the cost of the stop.
What is the difference between machine state and downtime reason?
The state is what the machine signal says: running, stopped on a fault, starved, blocked or off. The reason is why, such as a capper jam or a missing label reel. The machine can give the state on its own. The reason usually needs a person to confirm it.
How many downtime reason codes should a line have?
Aim for 10 to 20 codes per line, grouped under the big loss types. More than 30 makes the operator's choice unreliable, and the "Other" code starts to grow. Review the list every month in the first months, then whenever "Other" climbs again.
Should micro stops get a reason code?
Usually not one by one. Set a cutoff, often 1.5 to 2 times the ideal cycle, and count stops under it as minor stops in Performance. Look at them as a group by machine and SKU. Ask for a reason only for stops above the cutoff.
Can I build this downtime table in Excel?
You can build the table, but filling it is the hard part. Typed stop logs miss short stops and get rounded. Times typed after the shift do not match the machine. A spreadsheet works as a first model; the data needs to come from the machine signal.
See your stops as one clean table
Bring one line's current stop log. We will show the same stops as records with reasons, clips and costs.
Related articles





Real Fabrico tiles, sample data.