


 Login
 Blog
Kitting vs Line Stocking: Feeding an Assembly Line, Costs Worked Out

In short: kitting in manufacturing moves part picking off the assembly line into a kit area, while line stocking keeps bins of every part number at the station. Choose per part, not per plant: kit the variant parts that slow the constraint or cause wrong fits, and keep two-bin or kanban for the rest.
- Kitting rarely saves labour: the assembler gains about 1 to 2 seconds a part, the kitter spends 2.9 to 22.4.
- It pays through line-side space, fewer wrong-variant errors and more output at the constraint.
- In the worked example a mix lifts OEE from 75.56% to 84.44% for 3.3 kitter hours a shift.
- Measure waiting-for-material stops by station for a week before you move a single bin.
An assembly line can be fed in two basic ways. Either every part number sits at the station and the assembler picks the right one for each unit, or someone picks the parts for each unit into a kit and the kit arrives with the job. Most plants end up with some of both, often by accident.
What follows is a decision aid for the plant or production manager who has to choose. It prices each method in labour, floor space, stock at the line, errors and stops for missing parts, then runs one heat pump assembly line three ways with the money carried through.
Kitting in manufacturing vs line stocking: what changes on the floor
The research names are precise. In a 2012 Chalmers doctoral thesis on in-plant materials supply (Hanson, case studies at Swedish vehicle assembly plants), kitting means parts are delivered and presented to assembly in pre-sorted kits, each kit holding parts for one assembly object. Continuous supply, the academic name for line stocking, means a number of parts of each part number are presented at the station, so in mixed-model assembly the assembler has to pick the right parts for each object.
Line stocking is not one method either. The refill loop decides how it behaves:
- Two-bin: two containers per part at the station. When one empties, it goes back as the refill signal while the operator works from the second.
- Kanban: a card or electronic signal per container, sized to demand; see the kanban system guide for loop sizing.
- Periodic line stocking: large unit loads topped up on a fixed round, whether the station needs them or not.
A 2023 open-access paper in Production and Manufacturing Research (Ostermeier, Jaehnert and Deuse, TU Dortmund, BMW and UTS, automotive practice) sums up why line stocking is the default: in the automotive industry it is the most prevalent parts supply strategy because of its simplicity and low material handling effort, at the cost of higher space use and no time saving for the assembler when picking parts.
| Factor | Kitting | Line stocking | Mix |
|---|---|---|---|
| Who picks | Kitter, off the line | Assembler, at the station | Kitter for variant parts, assembler for the rest |
| Labour | Kit picking plus kit transport | Bin refills, assembler search and walk | Small kit area, fewer refills |
| Line-side space | One kit per unit | Two bins per part number | Racks only for common parts |
| Stock at the line | Low, but kits waiting in a queue | Two bins or more per part | Low for variants |
| Errors | Kit errors found late, at the line | Wrong variant picked at the station | Kit errors on few parts |
| Stops for missing parts | Late or short kits | Empty bin not refilled in time | Both, on fewer parts |
How the parts travel to the line, by tugger or forklift, is a separate choice covered in tugger trains vs forklifts. How the line pulls from a stock point is covered in FIFO lane vs supermarket. This page is about what the assembler finds at the station.
What each method costs: labour, space, stock, errors and stops
Labour: kitting moves work, it rarely removes it
This is the number most kitting projects skip. Across the Chalmers studies, the thesis reports that the average saving for the assembler, per part presented in a kit instead of in component racks, was relatively small in most of the studies: around 1 to 2 seconds. It adds that in manual kit preparation it is difficult to get the picking time per part that low, and that transport from the kit area adds more.
How long kit picking takes varies more than most plants expect. A 2019 study of 15 kit preparation areas in the International Journal of Production Research (Hanson and Medbo, Chalmers, filmed industrial cases) measured average picking times of 2.9 to 22.4 seconds per component. The fast cases had dense picking areas, kit carriers that move with the picker and small parts. The slow ones used heavy stationary racks as kit carriers, with the picker walking back and forth.
So the labour bill turns on your kit area design. Priced at the Eurostat hourly labour cost figures for 2025, which give a whole-economy range of EUR 12.0 an hour in Bulgaria to EUR 56.8 in Luxembourg, and EUR 40.3 an hour for industry in the euro area, picking alone costs EUR 9.67 to EUR 353.42 per 1,000 parts kitted. The low end is a fast area in a low-cost country, the high end a slow area in the most expensive one.
Floor space and stock at the line
Line stocking needs a rack face for every part number used at the station, two bins deep. With many model variants that rack face grows fast, stretches the station and adds walking to each cycle. The Chalmers thesis reports kitting is linked to lower inventory and space at the assembly stations, and in two of its cases the shorter racks helped shorten the stations themselves, which cut the assembler's walk back to the start of each cycle.
The stock does not vanish. It moves to the kit area, plus a queue of finished kits that has to cover the travel time and any disruption. Count both before you claim a stock saving.
Errors: the wrong variant, or the wrong kit
Line stocking errors happen at the station: the assembler picks the left-hand bracket from the right-hand bin. Kitting removes that choice, which is its main quality case. But the thesis warns that the benefit depends on kit quality. A wrong or short kit is found at the line, and fixing it costs more than a wrong pick at the rack. Worse, operators borrow the missing part from the next kit, which the literature calls cannibalisation, and the shortage moves downstream.
Stops for missing parts
Both methods can starve a station. A simulation study by Thürer, Fernandes and Stevenson (Lancaster University repository, two-stage assembly) found limited operational performance differences between kitting and line stocking in make-to-stock systems, with the main difference being where stock is located. Read that as a warning: the stops come mostly from the refill loop, the kit release rule and the stock point, not from the label on the method. Fix a broken two-bin loop and the stops may go without any kitting at all; the water spider role is the usual first fix.
Where the stops land in OEE is a separate question, answered in waiting for material in OEE. On a balanced line, a starved station also blocks the stations behind it; see starvation and blocking.
Worked example: one heat pump assembly line fed three ways
Sample figures for illustration only. A mixed-model line builds indoor units for air-to-water heat pumps in three models. Six manual stations; station 3, where the refrigerant and wiring parts go in, is the constraint at an ideal cycle of 88 seconds. A shift is 480 paid minutes less 18 minutes of breaks: 462 planned minutes, so the ideal is 462 x 60 / 88 = 315 units. Eleven operators work the line. Today everything is line stocked in two-bins, and a material handler spends 4.0 hours a shift refilling them.
The three options:
- A, line stocking today: two-bin for all 140 part numbers.
- B, full kitting: kits for the 22 variant parts at stations 2, 3 and 5; two-bin for common parts.
- C, mix: kits only for the 7 variant parts at station 3, the constraint; two-bin for everything else.
A, line stocking. A week of stop data shows 34 minutes a shift of waiting for material and 22 minutes of other stops. Run time is 462 minus 34 minus 22 = 406 minutes. Availability: 406 / 462 = 87.88%. The line makes 247 units against 276.82 possible at ideal pace in that run time: performance 89.23%. The real cycle at station 3 is 406 x 60 / 247 = 98.62 seconds; the gap to 88 is mostly the assembler finding the right variant among the racks. Nine units fail test, six of them with a wrong-variant part: 238 good, quality 96.36%. OEE: 87.88% x 89.23% x 96.36% = 75.56%, the same as 238 / 315.
B, full kitting. The assembler at station 3 now takes 7 parts from a kit and saves 1.0 second on each, the low end of the Chalmers range: the cycle drops to 91.62 seconds. Late or short kits still cause 18 minutes of waiting, so run time is 422 minutes and availability 91.34%. Output: 422 x 60 / 91.62 = 276.35, so 276 units; performance 95.92%. Rejects fall to four, one of them a kit error: 272 good, quality 98.55%. OEE 86.35%.
C, mix. Same cycle at station 3. Stations 2 and 5 still wait on bins now and then: 24 minutes of waiting, run time 416, availability 90.04%. Output 416 x 60 / 91.62 = 272.42, so 272 units; performance 95.90%. Six rejects, two of them wrong-variant parts at stations 2 and 5 and one a kit error: 266 good, quality 97.79%. OEE 84.44%.
The kit labour. Kit picking is priced at 7.2 seconds a part, the median of the 15 measured cases, and the Eurostat euro area industry rate of EUR 40.3 an hour.
- B: 276 units x 22 parts x 7.2 seconds = 12.14 hours, plus 0.6 hours of kit delivery, minus 2.5 hours of bin refills no longer needed: 10.24 hours, EUR 412.83 a shift.
- C: 272 x 7 x 7.2 seconds = 3.81 hours, plus 0.3 delivery, minus 0.8 refills: 3.31 hours, EUR 133.31 a shift.
The money, if the extra units sell. The sample unit sells at EUR 395 ex works. The margin comes from a sourced range: the NYU Stern margin dataset by industry (Aswath Damodaran, January 2026 data, 112 US electrical equipment firms) shows a gross margin of 31.82%. Gross margin still carries the plant's fixed costs, so it understates what one extra unit adds, which keeps the example on the safe side: EUR 395 x 31.82% = EUR 125.69 a unit.
| Per shift | A, line stock | B, full kitting | C, mix |
|---|---|---|---|
| Waiting for material | 34 min | 18 min | 24 min |
| Availability | 87.88% | 91.34% | 90.04% |
| Performance | 89.23% | 95.92% | 95.90% |
| Quality | 96.36% | 98.55% | 97.79% |
| OEE | 75.56% | 86.35% | 84.44% |
| Good units | 238 | 272 | 266 |
| Extra margin | base | EUR 4,273.46 | EUR 3,519.32 |
| Net kit labour | base | EUR 412.83 | EUR 133.31 |
| Net gain | base | EUR 3,860.63 | EUR 3,386.01 |
Reading it. If the units sell, full kitting wins by EUR 474.62 a shift. The mix keeps 88% of full kitting's net gain for 32% of the kitter hours, a smaller kit area and fewer kits that can go wrong. Over 42 shifts a month (two shifts, 21 working days) the mix is worth EUR 142,212.32 a month, EUR 1,706,547.83 a year at 12 months. Full kitting: EUR 162,146.33 a month. These are large because every extra unit is valued at margin, and that holds only if the market takes the units.
If kit picking is slow. At 22.4 seconds a part, the slowest of the 15 cases, kit labour rises to EUR 1,446.02 a shift for B and EUR 457.29 for C. Net gain: EUR 2,827.44 for B, EUR 3,062.03 for C. The mix now wins outright. The kit area design decides the answer, not the feeding method.
If demand is fixed. Say the plant must ship 9,996 units a month, what A makes in 42 shifts. Then extra output is not sales, it is crew time freed. A shift of the 11-person crew costs 11 x 8 x EUR 40.3 = EUR 3,546.40. B makes the month in 36.75 shifts and frees 5.25, worth EUR 18,618.60, but its kitters work 376.5 net hours for EUR 15,171.62: net EUR 3,446.98 a month. C needs 37.58 shifts, frees 4.42 worth EUR 15,678.82, and costs EUR 5,009.74 of kit labour: net EUR 10,669.08 a month. With flat demand, the mix pays about three times as much as full kitting. Every figure is taken at station 3, the constraint, so a minute it loses is a line minute lost; the OEE calculation guide shows why.
Kitting, line stocking or a mix: options, costs and who should pick which
The ranges below come from the sourced inputs above: 2.9 to 22.4 seconds a part for kit picking, EUR 12.0 to EUR 56.8 an hour for labour, picking only. The example line figures are sample figures.
| Option | Cost range | Choose it if |
|---|---|---|
| Fix the refill loop, keep line stocking | A week of measurement and a new refill round. Sample line: refills cost EUR 161.20 a shift today (4.0 h at EUR 40.3) | Few variants, stops come from empty bins, space is not tight |
| Full kitting | EUR 9.67 to EUR 353.42 per 1,000 parts. Sample line: 6,072 parts a shift, EUR 58.70 to EUR 2,145.98 | Many variants at many stations, no rack space, units sell, kit area can be fast |
| Mix: kit variant parts at the constraint | Same rate per part, fewer parts. Sample line: 1,904 parts a shift, EUR 18.41 to EUR 672.92 | A few variant parts slow the constraint or cause wrong fits; demand is flat |
| Sequence or point-of-use stock for big parts | Handling per unit, not per part; price it with the same labour rate | Bulky or heavy parts, one per unit, that will not fit a kit carrier |
Who usually picks which. A production manager with a starving line and few variants should fix the refill loop first; it is the cheapest option and the simulation evidence says the method itself changes less than people hope. A plant with many variants squeezed into short stations has a space problem only kitting solves. A CI lead with one slow constraint and a flat order book should start with the mix and measure the kit area before widening it.
Questions to put to your own team or to any vendor of kitting carts, picking systems or line software:
- What is our measured kit picking time per part, filmed for one shift, and how does it compare with 2.9 to 22.4 seconds?
- How many minutes a shift does each station wait for material today, and how many of those come from empty bins rather than late deliveries?
- Which parts cause our wrong-variant rejects, and are they fitted at the constraint?
- How will a short or wrong kit be caught before it reaches the line, and who fixes it?
- Will the extra units sell, or does the gain show up as fewer shifts? Finance should answer before the project starts.
- How will the waiting-for-material data reach the people who plan the kits? Testing that with one week of your shortage log is worth more than a slide.
Have one week of your shortage log at hand? Book a demo to see stops, waiting time and output by station on one screen.
Six checks that decide it, part by part
Run these per part number at each station, not once for the whole line. A line usually ends up with a short kit list and a long two-bin list.
- Variants: How many versions of this part across the models on the line?
- Size: Does it fit a kit carrier, or is it one big part per unit?
- Station: Is it fitted at the constraint station?
- Space: How many part numbers fit at the station today?
- Errors: How many wrong-variant rejects a shift does it cause?
- Starving: How much waiting-for-material time sits at this station?
A part that changes with the model, fits a carrier, is fitted at the constraint and causes errors is a kit candidate. A common part with plenty of rack space stays in a two-bin. Large parts go to point of use or sequence. Anything that starves should get its refill loop fixed before anyone redesigns the feeding.
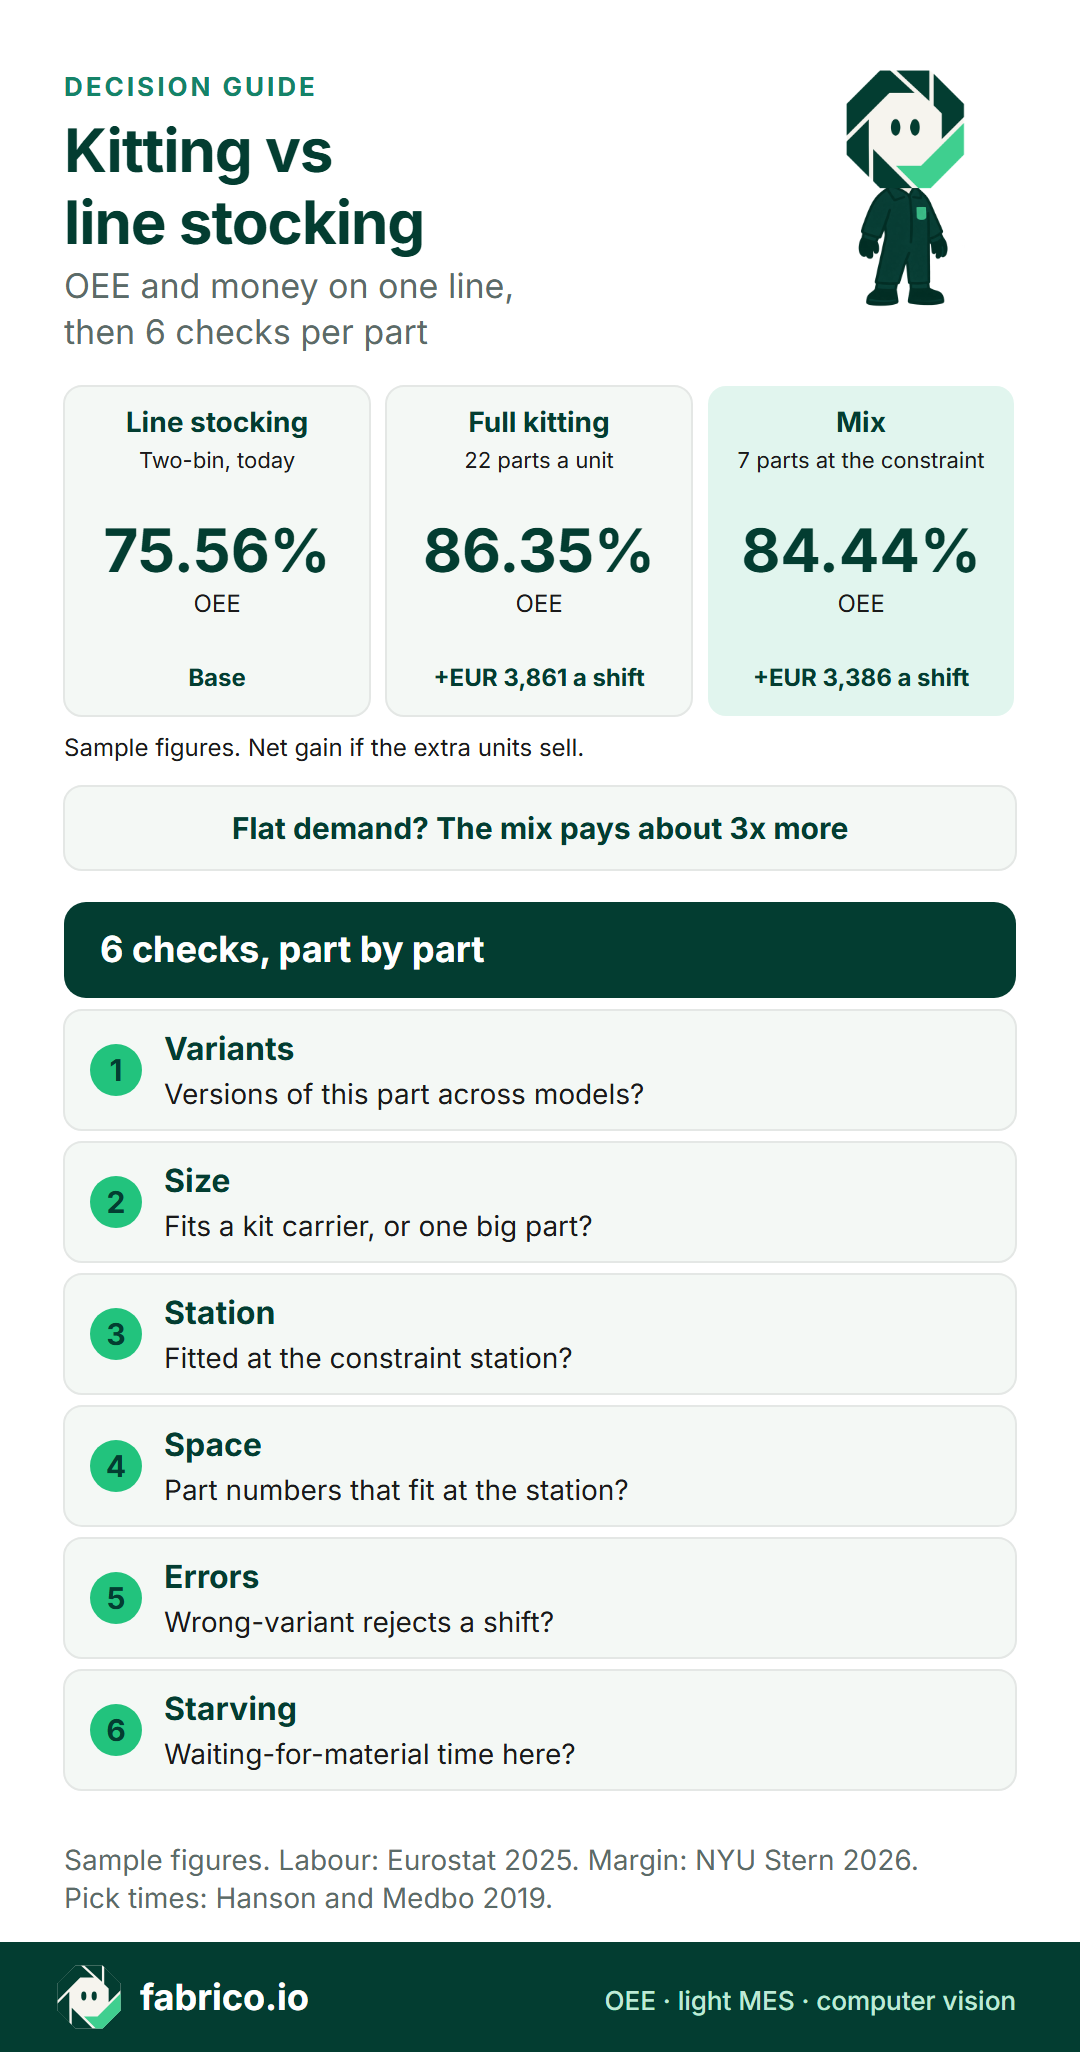
Text version of this infographic
- Line stocking today: OEE 75.56%.
- Full kitting: OEE 86.35%, net EUR 3,861 a shift if the units sell.
- Mix: OEE 84.44%, net EUR 3,386 a shift if the units sell.
- Check 1, Variants: How many versions of this part across the models on the line?
- Check 2, Size: Does it fit a kit carrier, or is it one big part per unit?
- Check 3, Station: Is it fitted at the constraint station?
- Check 4, Space: How many part numbers fit at the station today?
- Check 5, Errors: How many wrong-variant rejects a shift does it cause?
- Check 6, Starving: How much waiting-for-material time sits at this station?
- Sample figures. Labour: Eurostat 2025. Margin: NYU Stern, January 2026. Pick times: Hanson and Medbo 2019.
What to measure first: waiting-for-material stops at each station
Every number in the worked example came from a week of line data. Without it, the choice rests on opinion, and the loudest opinion is usually about the method, not the cause. Four measures settle most debates:
- Waiting for material, by station: its own stop reason, never mixed into a general bucket. Split it into empty bin, late kit, short or wrong kit, and no delivery round.
- Output at the constraint, by hour: so you see whether search time slows the cycle even when nothing stops.
- Rejects by cause: wrong-variant parts kept apart from other faults.
- Kit picking time: film one shift in the kit area, count parts, divide.
A clean reason list makes or breaks the first point; downtime reason code design covers how to keep it short enough that operators use it. On manual stations with no machine signal, counting output is the hard part, which is where AI visual counting and the methods in OEE for manual and hybrid assembly come in.
With OEE software, the stop and its duration come from the signal at the station, and the operator adds the reason on a tablet or phone at the line, so a week of waiting-for-material time by station is a report, not a project. The walkthrough below shows the line screen and how a stop waits for its reason.
What you see: a shift timeline, unclassified time waiting for a reason, and the operator's line-down screen, on sample lines. Book a demo.
Plays from YouTube. Google may set cookies when you press play. Privacy policy.
This week and this quarter: a plan for the line
This week:
- Add waiting for material as a stop reason with the four sub-reasons, by station.
- List the part numbers at the constraint station and mark which change with the model.
- Pull last month's rejects and tag the wrong-variant ones by part.
- Ask finance one question: would extra output sell, or would it save shifts?
This quarter:
- After four weeks of data, fix the refill loop where empty bins cause the stops.
- Film one shift of kit picking, in a trial area if you have none, and work out seconds per part.
- Run the six checks per part at the constraint and kit only the parts that pass.
- Compare OEE, waiting for material and wrong-variant rejects for four weeks before and after, at the constraint, then decide whether to widen the kit list.
Where Fabrico helps when you change how the line is fed
Fabrico is light MES and OEE software for the plant floor. It does not run the kit area or the warehouse; it measures what the feeding choice does to the line:
- Stops and counts come from a PLC or IoT device with sensors, and the operator picks the stop reason from a grouped list, linked to the machine, on a tablet or phone. That is how waiting for material gets a separate row in the report. The OEE and light MES solution page shows the screens.
- OEE, downtime and losses by line and shift, with losses shown in money from your own prices and margins, so the before-and-after of a kitting trial is in euros, not opinions.
- On manual stations with no usable signal, the camera add-on counts output; see MES and OEE with computer vision and computer vision OEE for manual assembly. Where the camera add-on covers the station, the video for the minute of a stop can be opened from the shift timeline, streamed on request and not stored in Fabrico.
- Data leaves through a REST API, webhooks and Excel or CSV export, so the shortage data can reach the people who plan kits and refills.
Sources, accessed 15.11.2026: Hanson 2012, Chalmers; Hanson and Medbo 2019; Ostermeier et al. 2023; Thürer, Fernandes and Stevenson; Eurostat hourly labour costs; NYU Stern margins by sector.
Questions plant teams ask about kitting
What is kitting in manufacturing?
Kitting means a picker collects the parts for one unit, or one small batch, into a kit away from the line, and the kit travels to the assembly station with the job. The assembler takes parts from the kit instead of from racks of every part number.
What is the difference between kitting and line stocking?
With line stocking, each part number sits at the station in bins or boxes, refilled by a two-bin, kanban or reorder point loop, and the assembler picks the right part for each unit. With kitting, that picking moves to a kit area and the station receives only the parts for the unit in front of it.
Is kitting cheaper than line stocking?
Rarely on labour alone. Studies at Swedish vehicle plants found the assembler saves around 1 to 2 seconds per part presented in a kit, while manual kit picking took 2.9 to 22.4 seconds per part across 15 cases. Kitting pays through line-side space, fewer wrong-variant errors and output at the constraint.
When does a mix of kitting and two-bin make sense?
When a few variant parts at the constraint cause most of the search time and errors, and the rest are common parts. Kit those few, keep two-bins for the rest. In the sample line on this page the mix kept 88% of the full-kitting gain for 32% of the kitter hours.
How do I measure line stops caused by missing parts?
Give waiting for material its own stop reason, split by station and by part where you can, and time it from the machine signal or a counter at the station. A week of that data shows which stations starve and whether the cause is the feeding method or the refill loop.
Does kitting reduce assembly errors?
It can, because the assembler only sees the parts for the unit in front of them. It only holds if the kits are right: a wrong or short kit is found at the line, far from the kit area, and parts borrowed from other kits create new shortages.
Want to see waiting-for-material time by station on a live line screen? Book a demo.
Related articles








Real Fabrico tiles, sample data.