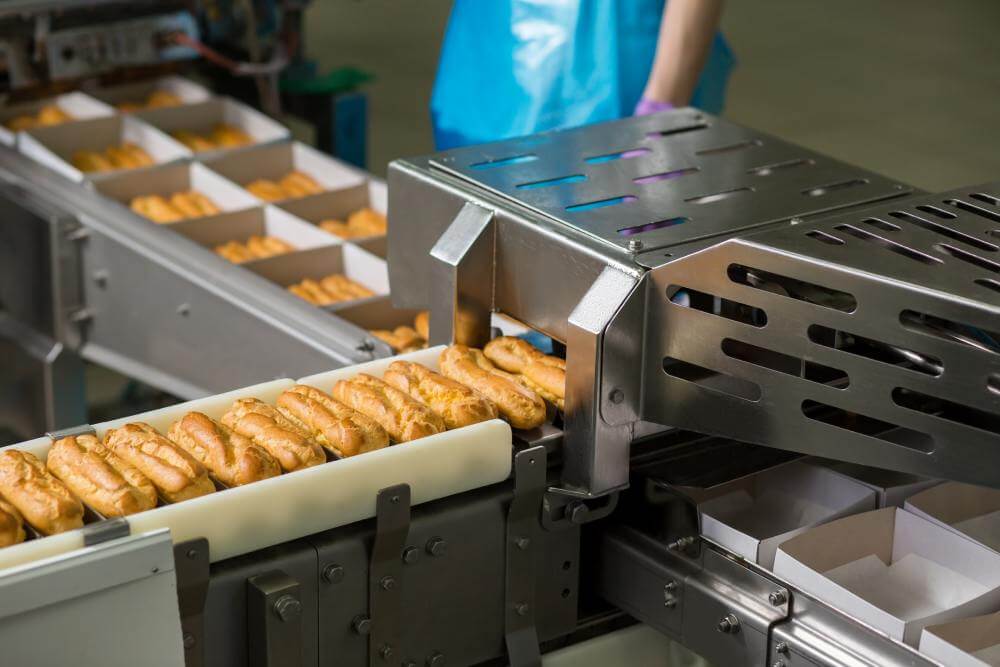

The "Blink" Problem: Human inspectors get tired. They miss defects. Cameras never blink. Automated Visual QC allows for 100% inspection, not just random sampling.
See our roundup of analytics tools that build on this kind of data.
Quality = Maintenance: A defect is rarely a random event; it is usually a symptom of machine degradation (e.g., a loose mold, a drifting sensor).
See OEE & CMMS live in 15 minutes.
Book a demoThe "Closed Loop": Most vision systems just reject the bad part. Fabrico goes further: when a defect trend is spotted, it automatically triggers a Maintenance Work Order to fix the machine.
Visual Traceability: Save video clips of defects to protect yourself against customer claims. "Show me the tape" becomes your defense.
In most factories, Quality Control (QC) is a game of probability.
You produce 10,000 units. You inspect 50 of them. If the 50 are good, you ship all 10,000.
This is Statistical Process Control (SPC). It works, until it doesn't.
If a machine drifts out of alignment for 10 minutes between inspections, you produce 500 bad parts that go straight to the customer.The cost of that recall dwarfs the cost of the inspection software.
In 2026, the standard is moving from "Sampling" to "100% Visual Inspection."
Visual Quality Control Software uses Computer Vision to look at every single unit. But crucially, it shouldn't just be a "Reject Gate." It should be a diagnostic tool for your Maintenance Department.
Here is how to turn your QC cameras into machine health sensors.
If you have a defect, you have a machine problem.
Burrs on plastic? -> Worn tool.
Crooked label? -> Loose guide rail.
Under-filled bottle? -> Valve timing drift.
If your Quality Software (Vision) is disconnected from your Maintenance Software (CMMS), you are just throwing away money (Scrap) without stopping the bleeding (Repair).
Fabrico unifies them. We treat "Quality Loss" as a maintenance trigger.
Humans are subjective. "Does this look red enough?" varies by person. Cameras are objective.
The Technology: Fabrico’s visual modules use AI-based pattern recognition.
The Application: Detecting deviations in shape, color, assembly integrity, or label placement.
The Scale: It inspects 100% of throughput at line speed. It catches the single defect that a human sampling plan would statistically miss.
This is the Fabrico difference. A vision system shouldn't just say "Bad Part." It should say "Bad Machine."
The Logic: You set a threshold. "If > 3 consecutive labels are crooked..."
The Action: Fabrico automatically generates a Corrective Work Order: "Check Labeler Alignment - High Defect Rate."
The Result: The machine is stopped and fixed before you produce a thousand more bad units.
Customer complaints are expensive. When a client says, "You sent us a broken part," how do you defend yourself?
The Old Way: "Our paper logs say we checked that batch." (Weak defense).
The Visual Way: Fabrico stores the video/image record of production. You can pull the timestamp and show the video proof that the unit left your line in perfect condition (proving the damage happened in shipping).
Calculating OEE (Overall Equipment Effectiveness) requires accurate Quality data.
Availability x Performance x Quality = OEE.
In many plants, "Quality" is calculated at the end of the shift by counting the scrap bin. This is too late.
Fabrico’s Visual QC feeds the "Q" metric in real-time.
Dashboard: "Quality Rate dropped to 85% at 10:00 AM."
Insight: You see the correlation instantly, did the drop happen right after a speed increase? Or after a material change?
| Feature | Manual Inspection | Standalone Vision System | Integrated QC (Fabrico) |
| Coverage | Sampling (5-10%) | 100% | 100% |
| Consistency | Low (Fatigue) | High | High |
| Response | "Reject the part" | "Reject the part" | "Reject part + Fix machine" |
| Data Link | Clipboard | Siloed Database | Linked to Asset History |
| Root Cause | Guesswork | None | Video Evidence |
Detect: Camera identifies a non-conformity (e.g. Dent).
Reject: Diverter arm removes the product.
Alert: If the defect persists (Trend), Maintenance is notified instantly via Push Notification.
Repair: Technician uses the video clip to identify which part of the machine caused the dent.
Verify: Camera confirms the next 100 units are defect-free.
A filter (Quality Control) catches bad parts. A cure (Maintenance) stops them from being made.
Visual Quality Control Software is the ultimate bridge between the product you sell and the machine that makes it.
Inspect 100%.
[Request a Demo] and see how Fabrico automates quality and maintenance together.
The same vision pipeline that inspects units can also count them; see our guide to AI visual counting in manufacturing.
Want OEE captured straight from your machines, no manual logs?
See it liveTeams comparing quality inspection software are usually choosing between two different jobs: catching a defect at the station, and understanding why it happened at all. Most quality control inspection software does the first job well. The checklist below is for judging the second.
Fabrico approaches this from the production side. Its Computer Vision module watches the line for events that machine signals and operator inputs miss, such as unrecorded micro-stops and manual interventions, and ties what it sees to the OEE loss it caused.




















 Login
Login
 Blog
Blog