








 Login
 Blog

The Iceberg Effect of Downtime: Why You Underestimate Downtime Losses

Key Takeaways
-
Visible vs. hidden costs: Most downtime reports only track direct labor and maintenance parts. This is just the tip of the iceberg (10% of total cost).
-
The Opportunity Cost: The biggest loss isn't what you spent fixing the machine; it's the revenue you didn't make while the machine was stopped. In sold-out plants, this is pure profit loss.
-
The ripple effect: Downtime causes quality defects (startup scrap), energy waste (idling machines), and employee burnout. The best way to stop the bleeding is to Automate Data Collection to see the full financial picture.
The 3 Hidden Cost Categories
1. Opportunity cost. The biggest hidden category. In a sold-out plant, every minute of downtime is a minute of margin lost forever.
- Math: planned production rate × idle minutes × margin per unit
- For example: €220/hour in sold-out condition, as in the worked example below
- Why it is hidden: revenue you did not make does not appear in any cost report
2. Quality cascade. Restarting after downtime is not free. Startup defects, parameter drift, and rework eat 5-15% of the next batch.
- Math: scrap units × full unit cost (material + labor + overhead)
- For example: €90/hour cascade cost, as in the worked example below
- Why it is hidden: scrap is logged in the next shift, not the downtime event
3. Labor reallocation. Operators stay on payroll during the stop. Catch-up shifts add overtime. Other lines wait for upstream throughput.
- Math: (idle operator-hours × loaded hourly cost) + (overtime hours × 1.5x premium)
- For example: €110/hour, as in the worked example below
- Why it is hidden: payroll is fixed and looks separate from the event
The Iceberg: 10% Visible, 90% Hidden
Quick answer: The iceberg effect of downtime means the visible costs (lost production, labor idle time) are typically only 20-30% of the total. The hidden 70-80% includes scrap, expedited shipping, overtime, customer penalties, and capital tied up in safety inventory.
World-class plants budget downtime cost at 4× the visible number when justifying CMMS or OEE investment.
Related deep-dives: 6 root causes of unplanned downtime · how to calculate true cost of downtime · Pareto analysis · closing the OEE-CMMS loop.
Most plant downtime reports track labor hours and replacement parts. That is the visible 10% of the iceberg.
The other 90% never appears in the Excel report:
- Opportunity cost: revenue you did not make while the machine was stopped
- Quality cascade: defects after restart, scrap from startup, rework
- Labor reallocation: idle operators on payroll, overtime to catch up
For example, a report showing €120/hour can hide a full cost of €540/hour once all four parts are added. That gap is the iceberg.
See OEE benchmarks for what a good OEE score means.
How to Calculate the True Cost
True cost per downtime hour =
(Visible: labor + parts) + (Opportunity cost) + (Quality cascade) + (Labor reallocation)
For example, with illustrative numbers, take 1 hour of unplanned downtime in sold-out condition:
- Labor + parts (visible): €120
- Opportunity cost (margin × production rate): €220
- Quality cascade (startup defects on 30-minute restart curve): €90
- Labor reallocation (8 operators idle + 4-hour overtime catch-up): €110
- True cost: €540/hour
In this example, the Excel report shows €120 and the full cost is €540. The 4.5x gap is the iceberg.
See how to calculate OEE with a real-world example using the same numbers.
Why Excel Hides 88% of the Cost
Excel does not hide costs maliciously. It hides them structurally.
Each hidden cost category lives in a different system: opportunity cost in the ERP, quality cascade in the QMS, labor reallocation in payroll. The downtime event lives in maintenance.
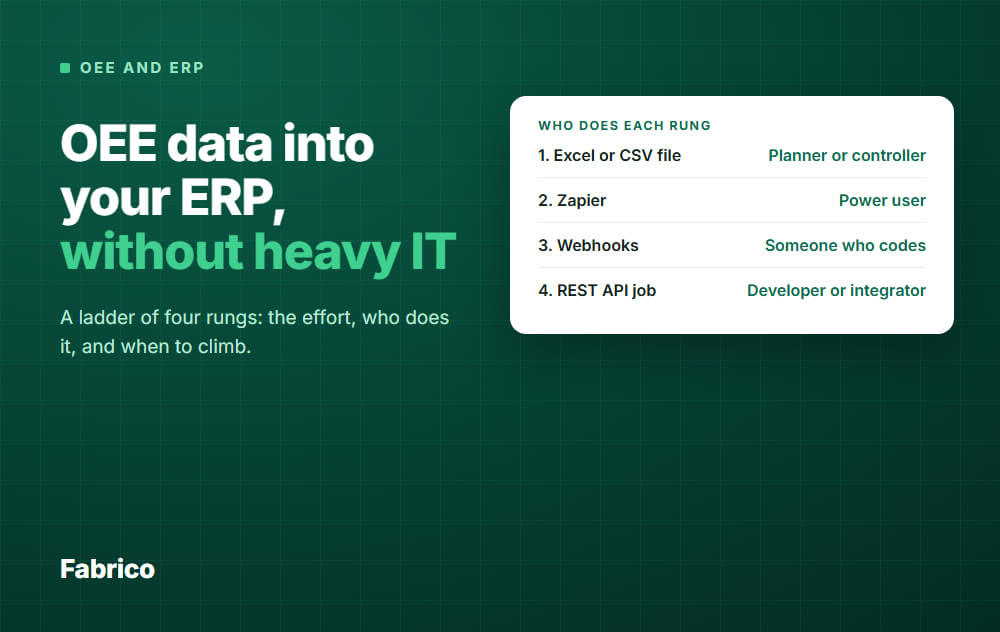
A modern OEE solution with native CMMS records downtime events with their reason and duration. The REST API and webhooks can pass that event to your other systems, where your team adds margin, scrap and idle cost.
That is the difference between Fabrico and four disconnected spreadsheets. The iceberg becomes visible.
Turn downtime into a number your team can actually act on.
Request a demoRelated articles









Real Fabrico tiles, sample data.