


 Login
 Blog

OEE Data Quality for Manufacturers: From Pencil Whip to Precision

Every manufacturer talks about improving OEE. Far fewer can trust the numbers on the screen. The gap is usually not about formulas or dashboards, it is about data quality at the source: how availability, performance, and quality are actually captured on the shop floor.
This article looks at how OEE data gets distorted by pencil-whipped logs, wrong cycle times, and invisible micro-stops. It also shows how accurate, machine-captured data in a platform like Fabrico turns OEE from a debatable KPI into a reliable driver for action in production and maintenance.
For a primer on what to track and why, see this guide to OEE tracking on the shop floor.
Why OEE data quality decides everything
OEE is only as good as its inputs. If downtime is underreported, cycle times are wrong, or small stops disappear, then:
- Availability looks better than reality
- Performance losses are buried inside an inflated theoretical capacity
- Quality issues are isolated from process and equipment context
As a result, the plant focuses on the wrong bottlenecks, makes incorrect investment decisions, and cannot prove the impact of improvement projects. Arguments about which number is right consume more time than fixing the problems behind the numbers.
High quality OEE data has three characteristics:
- Captured directly from machines, not reconstructed from memory
- Time-stamped and granular, including micro-stops and speed losses
- Linked to actions in production and maintenance so that each loss is addressed
This is exactly the gap that Fabrico targets: it connects to machines, collects production and downtime data in real time, and helps teams turn losses into clear actions for operators, planners, and maintenance teams. Its built-in maintenance management capabilities help teams turn chronic losses into structured work, not just comments in a report.
The problem with pencil-whipped downtime logs
Pencil whipping is one of the most common sources of bad OEE data. When operators fill out downtime and production logs manually, typical patterns emerge:
- Short stops are ignored or grouped into vague categories like “adjustment”
- Durations are rounded to the nearest 5 or 10 minutes
- Reasons are simplified to “mechanical” or “operator” with little diagnostic value
- End-of-shift backfilling introduces guesswork and hindsight bias
The result: availability looks reasonable on paper, yet experienced supervisors know that machines are “always stopping for something.” The plant loses the ability to distinguish between genuine major breakdowns and countless minor interruptions and setups that consume more time overall.
With Fabrico, machines send runtime and stop signals directly into the platform. Stops are detected automatically, time-stamped to the second, and presented to operators in real time. Instead of creating the record from scratch, the operator only confirms or refines the reason on a tablet or terminal. This changes the behavior:
- On connected machines, stops are captured, so less production time goes unexplained
- Operators classify, rather than invent, downtime events
- Supervisors can see unclassified stops and coach teams quickly
Over time, the plant gains a realistic picture of which asset, product, shift, or team drives the majority of lost time, both in volume and frequency.
Wrong cycle times: the silent OEE killer
Performance in OEE depends on an accurate ideal cycle time or standard rate. When that input is wrong, performance numbers are misleading even if uptime and scrap counts are perfect.
Typical issues include:
- Old standards that do not reflect current products or tooling
- Average rates used as “ideal” rates, hiding real speed losses
- Generic rates across diverse SKUs with different complexity
- Best-possible rates defined on paper but never verified on the line
When ideal cycle time is too slow, performance appears artificially high, so speed losses disappear from the OEE waterfall and planning assumptions become optimistic. When ideal cycle time is too fast, the team constantly “misses target” and loses trust in the metric.
Fabrico addresses this by learning and validating actual cycle times from machine signals. Because the platform sees every part or stroke as it happens, it can:
- Calculate real running rates by product, shift, and machine
- Highlight gaps between standard and achieved rates
- Support data-driven updates for routing and standards
Planners and industrial engineers gain a factual baseline for capacity, and continuous improvement teams can see if an improvement sustained real speed gains or simply pushed operators into unsustainable behavior.
Missing micro-stops and speed losses
Reports that show mainly long breakdowns hide a significant portion of real losses. Micro-stops and speed losses rarely show up in manual logs because:
- Operators prioritize recording major events over minor irritations
- Short interruptions feel normal and become part of the routine
- Speed differences are hard to observe without precise timing
These losses might include:
- Frequent sensor misreads that cause 10 second stops
- Micro-jams on a conveyor that operators clear instinctively
- Standard work sequences that force operators to slow the line
- Slow warm-up periods at the start of shifts or after breaks
A platform that collects signals directly from machines does not rely on memory or perception. Fabrico detects micro-stops and slow cycles across entire shifts. It distinguishes genuine “running at rate” periods from stop-and-go or slow-running conditions, all tied to the exact timestamp and machine state.
With this visibility, teams can prioritize:
- Chronic micro-stops that consume more time than large breakdowns
- Equipment that runs consistently below standard even without formal downtime
- Products or tooling configurations that trigger repetitive minor issues
This is only possible when every machine state and cycle is captured at source, not when events are summarized at the end of the shift.
Real-time OEE vs yesterday’s story
Once data quality improves, the timing of that data becomes crucial. Many plants still create OEE reports the next day, in spreadsheets or static dashboards. By the time problems appear on a chart, the shift is over and the team cannot react.
Real-time OEE transforms this into a live operational tool. Supervisors and operators can see at a glance:
- Which lines or cells are drifting off target right now
- Whether a current stop is eroding the shift goal
- How a changeover or product mix change is affecting actual performance
Fabrico is built around real-time OEE views and alerts. Because data comes directly from machines, the platform provides current OEE, downtime, and speed insights without waiting for manual entry or end-of-shift reconciliation.
If you want to explore how to make OEE data useful in the moment on the shop floor, see this overview of real-time OEE for manufacturers.
Connecting OEE losses to maintenance and production actions
High quality OEE data is valuable only if it leads to consistent action. Many plants still treat OEE as a reporting metric for monthly reviews, rather than as a driver of daily, weekly, and strategic decisions.
Because Fabrico combines OEE, production tracking, and built-in maintenance management in a single platform, a loss can lead to targeted responses across functions.
Examples include:
- Repeated minor stops from the same sensor lead to a maintenance work request, not just a comment in the log
- Chronic speed losses on a specific product initiate a standard work or method review on that line
- Frequent changeover overruns prompt a SMED or setup reduction project with clear before and after impact on OEE
- Patterns of unplanned stoppages on a critical asset drive preventive or condition-based tasks in the maintenance schedule
Supervisors and reliability engineers work from the same real-time and historical data, so they can validate whether actions reduced the loss or simply shifted it elsewhere in the process.
From IoT data to practical improvement on the floor
For many manufacturers, the barrier to high quality OEE data is not intention, it is infrastructure. Connecting equipment, collecting signals, and turning raw data into usable insights has traditionally required complex projects with multiple vendors.
Fabrico simplifies this by combining IoT connectivity, OEE analytics, and maintenance workflows in one cloud-based platform. It connects to machines, captures production counts and downtime events, calculates OEE in real time, and links recurring losses directly to maintenance and continuous improvement tasks.
This approach lets plant teams move step by step:
- Start with a critical line or cell and get automatic OEE and downtime data from the machines
- Clean up standards and cycle times using real-world production behavior
- Use real-time dashboards during daily huddles and shift handovers
- Convert patterns of loss into maintenance plans and focused improvement projects
- Scale to more assets and plants with a common model for reasons, standards, and actions
For a deeper look at how IoT and smart manufacturing capabilities support this journey, see how Fabrico drives OEE excellence through IoT and smart manufacturing.
What good looks like: OEE as a trusted operational KPI
When OEE data is precise and action-driven, behavior changes across the factory:
- Operators no longer argue about whether OEE is “fair,” because data comes from machines, not memory
- Supervisors focus conversations on specific losses, not on whose spreadsheet is correct
- Maintenance teams prioritize jobs based on real impact on availability and performance
- Leadership can use OEE to compare lines and plants with confidence, and to justify investments
The plant moves from chasing yesterday’s numbers to managing today’s reality. OEE becomes a shared language across production, engineering, and maintenance.
Getting started: from pencil whip to precision
You do not have to fix every data problem at once. A practical approach is:
- Identify one line where OEE numbers are frequently debated or adjusted
- Connect key machines on that line to capture runtime, counts, and stops automatically
- Run your existing manual OEE in parallel for a short period and compare the differences
- Use the insight from those differences to improve standards, loss categories, and workflows
- Embed the improved OEE view into daily management routines and maintenance planning
If you want to see how Fabrico can support this step-by-step improvement in your own environment, you can Book a demo or Contact us.
See how Fabrico unifies OEE and maintenance in one platform.
Request a demoRelated articles



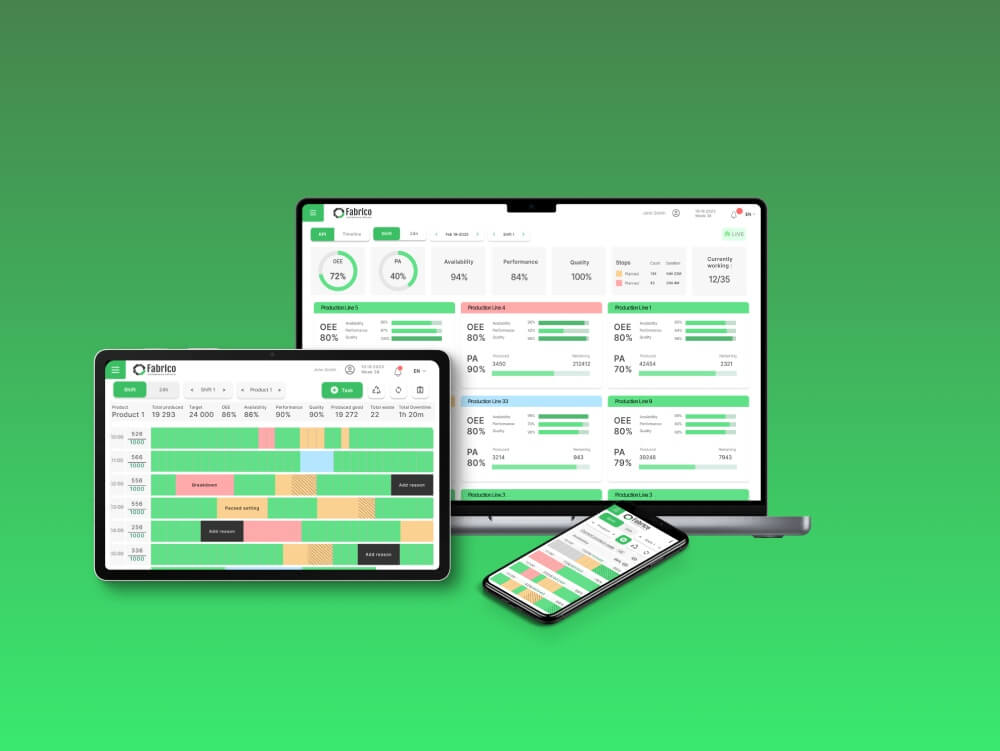









Real Fabrico tiles, sample data.