


 Login
 Blog
Debottlenecking a Production Line: Study, No-Capex Fixes, Then Capex

In short: debottlenecking raises the output of a line by removing the losses at its constraint, in a fixed order: prove the constraint with measured data, fix what costs no capital, then buy equipment only for the gap that is left.
- Study first: one count at the constraint, stops by reason, starved and blocked time, over several weeks and the full product mix.
- Price every loss in constraint hours and EUR before choosing a fix.
- Changeovers, minor stops, speed loss and staffing at the constraint usually come before any purchase. Measure each fix.
- Re-run the study after the fixes. The constraint may move.
- The capex request carries a money bridge from the study gap to the gap that is left.
Sales wants more cases than the line can make, and the first proposal on the table is a new machine. A debottlenecking project answers that request in order: find the step that limits output, recover the hours that need no capital, and size any capex on what is left. Fabrico, which we make, measures OEE; the method works with any trusted record.
For the groundwork, see bottleneck analysis in manufacturing and bottleneck vs constraint. This page starts where they stop: deciding what to fix, in which order, and whether to spend.
Stage 1: the debottlenecking study
A 2021 review in the Journal of Manufacturing Systems, by researchers at Chalmers University of Technology, sorts throughput bottleneck work into four categories: identify, diagnose, predict and prescribe. A debottlenecking project needs the first two before it can prescribe anything.
Measure the line at the constraint, not at the end of the line: one count at that machine, checked against a hand count, plus stop time by reason, starved and blocked time, rated speed per format and rejects. OEE software that reads the machine signal gives you this record shift by shift; a stopwatch audit gives you one shift. The study ends with OEE at the constraint split into availability, performance and quality.
What you see: a shift timeline, unclassified time waiting for a reason, and the operator's line-down screen, on sample lines. Book a demo.
Plays from YouTube. Google may set cookies when you press play. Privacy policy.
Do not name the constraint from one good week. In a 2018 study in Computers and Industrial Engineering, tested on data from an automotive line, Subramaniyan and colleagues note that the operational dynamics of a production system cause bottlenecks to shift among resources between production runs. On a food or FMCG line, a new pack format, film reel or crew can move the limit from cartoner to wrapper and back.
Roser and colleagues, in a 2021 paper on shifting bottleneck detection, write that many bottleneck detection methods do not work well with shifting bottlenecks, even though shifting bottlenecks are very common in industry. Their active period method treats a machine as active whenever it is not waiting for parts or material; the machine with the longest uninterrupted active period is the bottleneck at that moment. Without code: note which machine most often had the longest run without being starved or blocked.
That is why starved and blocked time belong in the study. A machine often starved is waiting on the step before it; one often blocked is waiting on the step after it. The constraint is rarely either. See starvation and blocking in line balance. Log both at the constraint as their own stop reasons: starved time at the cartoner is output lost to the wrapper, and its fix sits at the wrapper.
Worked example: the study on a biscuit cartoning line
Sample figures for illustration only. A biscuit plant packs flow-wrapped packs into cartons. The line runs 5 days of 22 hours, so planned production time is 6,600 minutes a week. The study shows the cartoner is the constraint on most shifts, rated at 100 cartons a minute, so the line could make 6,600 x 100 = 660,000 cartons a week. Sales needs 520,000 good cartons a week.
| Loss at the cartoner | Measured in the week | OEE factor |
|---|---|---|
| Changeovers | 10 a week, 50 minutes each: 500 minutes | Availability |
| Repeat faults | 420 minutes | Availability |
| Waiting for materials | 230 minutes | Availability |
| Starved by the flow-wrapper | 210 minutes | Availability |
| Blocked by the case packer | 120 minutes | Availability |
| Minor stops under 2 minutes | 620 minutes, 62,000 cartons | Performance |
| Speed set at 92 instead of 100 | 36,000 cartons | Performance |
| Rejected cartons | 6,000 cartons | Quality |
- Availability: 1,480 minutes of stops, so run time is 6,600 minus 1,480 = 5,120 minutes. 5,120 / 6,600 = 77.6%.
- Performance: 414,000 cartons counted against 5,120 x 100 = 512,000 possible in the run time: 80.9%. The 98,000 cartons lost are 62,000 from minor stops and 36,000 from the lower speed setting (4,500 minutes x 92 = 414,000).
- Quality: 6,000 rejects, so 408,000 good cartons: 408,000 / 414,000 = 98.6%.
- OEE at the constraint: 0.776 x 0.809 x 0.986 = 61.8%. Check: 408,000 / 660,000 = 61.8%.
The gap to demand is 520,000 minus 408,000 = 112,000 good cartons a week. At rated speed the cartoner makes 6,000 cartons an hour, so the gap equals 18.7 constraint hours a week. Starved and blocked time are counted here as stops, because a lost minute at the constraint is a lost minute for the whole line. Our guide to OEE calculation covers the conventions: each lost carton is counted once, at the constraint.
Price the constraint hour before you fix anything
A list of losses in minutes is not yet a decision. In the sample, finance puts the contribution margin at EUR 0.15 a carton and the line is sold out, so each constraint hour at rated speed is worth 6,000 x EUR 0.15 = EUR 900. The study gap is worth 112,000 x EUR 0.15 = EUR 16,800 a week, or EUR 806,400 a year over 48 production weeks.
Two rules keep the price honest. Value only hours at the constraint: an hour won at the case packer is worth nothing unless it was blocking the cartoner. And a recovered stop minute runs at today's speed and quality: in the sample, performance x quality = 80.9% x 98.6%, so a recovered stop minute brings about 80 good cartons, not 100.
If the line is not sold out, the hour is worth only the cost it avoids, such as overtime or a weekend shift, and the case for capex usually disappears. See new production line cost vs recovering capacity.
Stage 2: no-capex fixes at the constraint
Work the losses at the constraint in order of their price, and measure each fix over the same window as the study. The wider method is in zero capex OEE capacity reclamation; these fixes most often decide the project on a food or FMCG line.
Changeovers
Time each changeover from last good carton to first good carton, per product pair. The spread tells you more than the average. In a 2018 case study at a chocolate confectionery plant, from Tomas Bata University in Zlín, one selected changeover was timed each time it ran: the times of the individual changeovers ranged from 195 minutes to 375 minutes before the team standardised it. The average fell from 244 to 194 minutes, then settled at 210 minutes in the long run, and the plant counted 21 tons a year of released production. Plan for that drift: re-measure a month after the standard goes live.
A 2022 case study at a ready-meal manufacturer in South Yorkshire, published in Sustainability, applied SMED and line hopping: changeover time fell by nearly 30% and OEE rose to over 70%. The largest single saving, 310 seconds, came from pre-heating the sealing head, which depended on a spare sealing machine. Some no-capex fixes need a spare part; name that cost in the plan. Method: changeover standards and SMED for FMCG.
Minor stops and speed loss
On cartoners, wrappers and case packers, short stops at a magazine, glue nozzle or infeed often cost more than the breakdowns people remember. Count them per hour at the constraint, by station, and keep them apart from speed loss, which takes output with no stop at all; see reduced speed loss vs minor stops. Raise speed in steps and check rejects after each step.
Starvation, blocking and materials
Starved time at the constraint is fixed at the feeder: a film splice standard at the wrapper, or a rule for how full the accumulation table must be before a break. Blocked time is fixed downstream: set the case packer to run faster than the constraint. Waiting for materials is a supply rule: what sits line-side, and who calls the next pallet before the magazine runs low.
Staffing at the constraint
People are often the cheapest capacity. Eurostat estimates 2025 hourly labour costs, and in the euro area industry was the highest paying sector at EUR 40.3 per hour. In the sample, a second person on 10 changeovers of 35 minutes costs about 5.8 hours x EUR 40.3 = EUR 235 a week. The changeover row, SMED and pre-staged parts included, is worth EUR 1,793 a week. Use your own rates. Relief cover for breaks and a technician on call for the constraint are the other common staffing fixes.
Sometimes the constraint is a staffing gap. A 2023 Scientific Reports study from Iran University of Science and Technology simulated a soybean and sunflower oil line and found the bottlenecks sat in two deodorising sections, mainly for lack of operators. The team tested one to four extra operators in the model; with three, average queue waiting time there fell by nearly 50%. Add people one at a time, while the margin on the extra output covers the cost.
The debottlenecking decision matrix
One row per loss type at the constraint: the evidence, the fix, whether it needs capex, and the constraint hours a week it should recover (good cartons recovered divided by 6,000, one constraint hour at rated speed). Replace expected values with measured ones after each fix.
| Loss type and evidence | Fix | Capex? | Hours a week |
|---|---|---|---|
| Changeovers Last good to first good, per product pair | SMED, a second person, pre-staged parts | No, or a spare part | 2.0 |
| Waiting for materials Stops coded as waiting, by material | Line-side stock rule, call before empty | No | 1.6 |
| Starved by the wrapper Starved time at the cartoner, wrapper state | Film splice standard, buffer rule | No, at first | 1.2 |
| Blocked by the case packer Blocked time at the cartoner | Case packer set faster than the cartoner | No | 0.8 |
| Repeat faults Fault list by station and week | Fix the top three repeat faults | Sometimes, worn parts | 1.6 |
| Minor stops Short stops per hour, by station | Magazine refill and glue routine | No | 3.6 |
| Speed loss Speed setting log vs rated speed | Speed steps with reject checks | No | 3.0 |
| Rejects Rejects by hour and cause | Start-up and board checks | No | 0.5 |
| Total, no-capex or low-cost | 14.3 |
Planned recoveries a week: changeovers from 50 to 35 minutes each (150 minutes), materials 230 to 110, starved 210 to 120, blocked 120 to 60, faults 420 to 300, minor stops 620 to 380, and half the speed loss (18,000 cartons) and rejects (3,000). Stop minutes convert at today's speed and quality, about 80 good cartons a minute. A recovered minor-stop minute is already run time, so it runs at the set speed of 92: 240 x 92 x 98.6% = 21,760 good cartons. Together: 85,529 good cartons, 14.3 of the 18.7 hours the line is short, from fixes that need no capex or only a spare part.
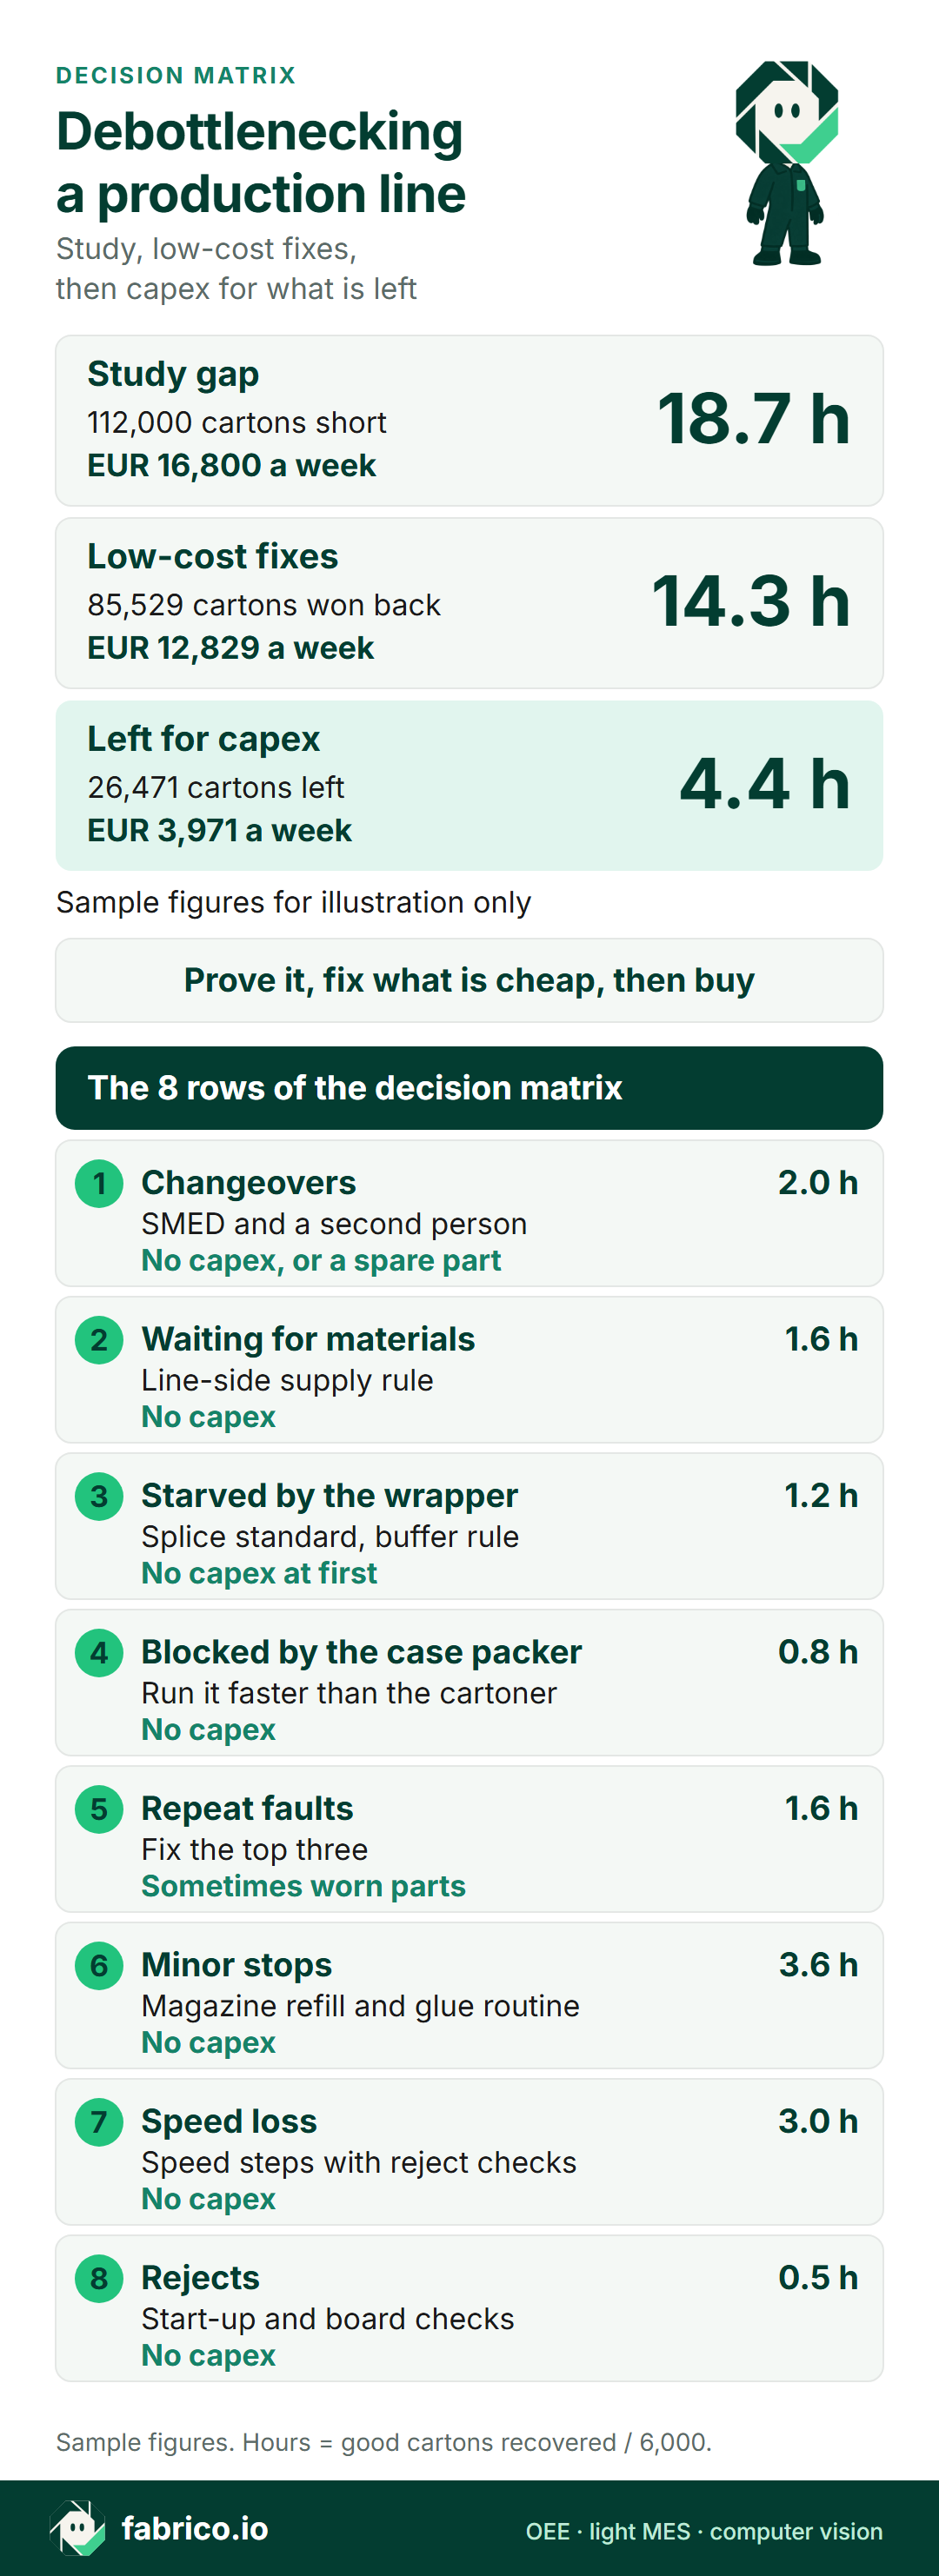
Text version of this infographic
- Title: debottlenecking decision matrix.
- Sample figures for illustration only.
- Study gap: 18.7 constraint hours a week, 112,000 good cartons short, EUR 16,800 a week.
- Low-cost fixes (no capex or a spare part): 14.3 hours, 85,529 cartons won back, EUR 12,829 a week.
- Left for capex: 4.4 hours, 26,471 cartons, EUR 3,971 a week.
- Prove it, fix what is cheap, then buy.
- Changeovers: SMED and a second person, no capex or a spare part, 2.0 h.
- Waiting for materials: line-side supply rule, no capex, 1.6 h.
- Starved by the wrapper: splice standard and buffer rule, no capex at first, 1.2 h.
- Blocked by the case packer: run it faster than the cartoner, no capex, 0.8 h.
- Repeat faults: top three faults fixed, sometimes worn parts, 1.6 h.
- Minor stops: magazine refill and glue routine, no capex, 3.6 h.
- Speed loss: speed steps with reject checks, no capex, 3.0 h.
- Rejects: start-up and board checks, no capex, 0.5 h.
Book a demo to see how losses at the constraint show by cause and in money while the line runs.
Re-run the study: the constraint will move
Once the cartoner loses fewer hours, another machine may set the pace. In the sample, the re-study shows starved time at the cartoner rising on shifts that run the large pack, with the flow-wrapper running longest without waiting. On that product, the wrapper is now the constraint. The fixes worked, and the next fix, and any capex, belongs at the wrapper on that format.
Keep the re-study rules identical: same planned time, rated speeds and reason list. Otherwise the bridge shows a change in the rules, not in the line.
Stage 3: capex, only for what is left
Now the capex question has a size. In the sample, the no-capex and low-cost fixes recover 85,529 good cartons, worth EUR 12,829 a week. That leaves 26,471 cartons, about 4.4 constraint hours or EUR 3,971 a week, which is about EUR 190,600 a year over 48 weeks. If finance asks for a two-year payback, the most the plant should spend to close that gap is about EUR 381,000, before running costs. Measure the gap left as line output against demand: on large-pack shifts, those hours belong to the wrapper, not the cartoner. The sample assumes measured results match the plan; in a real project, use the re-study figures.
The money bridge goes into the capex request as it is: the study gap, each no-capex fix with its measured result, and the gap left. Finance sees the request sized on what is left, with the cheap hours taken first. Before a purchase, also check hidden capacity before buying a production line, and see the capacity release business case for presenting released hours.
Sensitivity. At a margin of EUR 0.10 a carton instead of EUR 0.15, a constraint hour is worth EUR 600, the gap left EUR 2,647 a week, and the two-year ceiling about EUR 254,000. If the no-capex and low-cost fixes deliver half the plan, the hours left grow from 4.4 to about 11.5 a week. Run both cases before the request goes to the board.
Size the capex on the new constraint. In the sample, a faster wrapper for the large pack, or a second wrapper feeding the cartoner, closes the gap only on shifts where the wrapper leads. Ask the machine builder for rated speed per format, and track the start-up with a weekly OEE curve, as in our new line ramp-up plan.
Failure modes in debottlenecking projects
| What goes wrong | Early sign in line data | Fix |
|---|---|---|
| Fixing a machine that is not the constraint | Line output flat after the fix | Check starved and blocked time at the constraint first |
| Naming the constraint from one week | A different machine leads the next week | Study across shifts and the full product mix |
| Speed raised, rejects follow | Rejects per hour climb after a speed step | Raise speed in steps, check rejects at each |
| Changeover gains fade | Changeover times drift back over the months | Written standard, re-measured monthly |
| Capex sized on the study gap | Request counts hours already recovered | Use the money bridge, sized on the gap left |
| Causes hidden as unclassified | Large share of stop time without a reason | Short reason list, reviewed at each shift |
Debottlenecking study checklist with pass marks
Agree these eight points before stage 2. The pass marks are sample values; set your own.
- One count at the constraint. Pass: within 1% of a one-hour hand count.
- Stop reasons on a short list. Pass: unclassified time below 5% of stop time.
- Starved and blocked logged as their own reasons. Pass: both visible per shift.
- The constraint named across shifts, crews and products. Pass: one machine leads most shifts, or the pattern is written down.
- Rated speed per format. Pass: one source document for everyone.
- The hour priced with finance, sold out or not. Pass: signed off before fixes are ranked.
- Fixes measured over equal windows. Pass: each matrix row has a measured value.
- The bridge from study gap to gap left. Pass: the capex request uses the gap left.
What to do this week and this quarter
This week:
- Name the machine you think is the constraint, then walk the line each shift: which machine is starved, blocked or running?
- Check the output count at that machine against a hand count for one hour.
- Add starved and blocked as stop reasons at the constraint, apart from faults and changeovers.
- Ask finance for the contribution margin per unit, and whether the line is sold out.
This quarter:
- Run the study over several weeks and the full product mix, and write OEE at the constraint as availability x performance x quality.
- Build the decision matrix: loss, evidence, fix, capex or not, expected hours.
- Run the no-capex fixes in order of their EUR value, and measure each one.
- Re-run the study, find where the constraint has moved, and draw the money bridge.
- Only then write the capex request, sized on the gap that is left.
Where Fabrico helps in a debottlenecking project
Fabrico keeps the study and the re-study in one record.
- The study from machine data: OEE is calculated from data collected at the machine, from a PLC or IoT device with sensors, split into availability, performance and quality.
- Causes at the constraint: operators tag stop reasons on a tablet or phone, so waiting for materials, starved and blocked can sit on the reason list next to changeovers. Micro-stops are detected from the machine signal.
- Before and after: OEE tracking shows each machine over the current shift or a past period, so a fix can be compared with the weeks before it.
- The money bridge: losses are shown in money, and the OEE calculator prices the gap between current OEE and the target.
- Hand-pack steps after the line: with no machine signal there, the camera add-on counts output, and camera add-on video is streamed on request and not stored in Fabrico. Stop-reason suggestions are on the camera add-on roadmap.
More on the MES and OEE solution overview, OEE software, light MES, computer vision for OEE, MES for snack food manufacturing and computer vision for food manufacturing.
Questions plant managers ask about debottlenecking
What is debottlenecking in manufacturing?
It is a project to raise the output of a line by removing the losses at its constraint, the machine that sets the pace. A sound project runs in three stages: a study that proves the constraint with measured data, fixes that need no capital, and capex only for the gap that is left.
What does a debottlenecking study include?
One trusted count at the constraint, stop time by reason, starved and blocked time, rated speed per format and rejects, over several weeks and the full product mix. It ends with OEE at the constraint and the gap to demand priced in EUR.
How long should a debottlenecking study run?
At least one full product wheel, so every product and format runs, across every crew and shift pattern. Keep it running until the same machine leads, or the same pattern repeats, in two cycles in a row. Keep the same rules for before and after.
When is capex justified in a debottlenecking project?
When the no-capex fixes are made and measured, the study is re-run, and the gap left, priced at the constraint, pays back within the period finance sets. The request shows that bridge, not the first study gap.
How do you price a constraint hour?
If the line is sold out, an hour at the constraint is worth the good units it makes at rated speed times their contribution margin. If not, it is worth only the cost it avoids, such as overtime. Agree the figure with finance first.
What if the bottleneck keeps moving?
Log which machine is the constraint shift by shift, using starved and blocked time or the longest uninterrupted active period, and fix the one that leads most often. Re-run the study after each fix; a constraint that moves after a fix shows the fix worked.
Book a demo to see how a debottlenecking study looks as OEE at the constraint, with losses priced in money.
Related articles




Latest from our blog






Real Fabrico tiles, sample data.