


 Login
 Blog
FourJaw Alternatives: Utilisation, Full OEE or Energy, by Metric

In short: the right FourJaw alternative depends on the number you need most. FourJaw reads machine power draw and, per its own pages, reports utilisation, downtime by cause, OEE and energy per machine. Factbird, Amper, TeepTrak and Fabrico are the alternatives compared here, sorted by the number each one leads with; ask every vendor, FourJaw included, how each OEE factor is defined.
- FourJaw is a manufacturing analytics and production monitoring platform based in Sheffield; its about page names the University of Sheffield AMRC as its origin, in 2020.
- Its MachineLink device clips around a machine's power cable, so it reads machines of any age without the controller.
- Energy cost and carbon per machine sit next to downtime in the same platform.
- All vendor facts were read on each vendor's own site on 13.11.2026 and are linked in place. No prices, verdicts or ranking.
Picture a precision engineering firm with 40 machines bought over three decades: manual lathes, a few CNC mills with FANUC controls, presses and a grinding cell. A sensor on each power cable has shown, for the first time, how often the machines actually run. Now the ops director is asking why a busy machine still ships late, and the finance lead wants the energy bill split by machine.
Those are three different numbers. This page sorts FourJaw and four alternatives by which number each one is built to give you, drawing on what each vendor publishes. We make Fabrico, one of the four, which is why nobody here gets a rank, Fabrico included.
What FourJaw is (as of 13.11.2026, per fourjaw.com)
The FourJaw home page says it gives manufacturers real-time visibility of production performance by collecting data from machines of any age or type. Its about page says the company began in 2020, spun out of the Advanced Manufacturing Research Centre (AMRC) at the University of Sheffield. Per its pages, as of 13.11.2026:
- Hardware. The MachineLink device clips onto the power cable with no connection to the machine controller. High current draw marks the machine as under load, and data is hosted in the cloud.
- Operators. A tablet wakes when productivity drops and asks for a reason from a predefined list, in two taps per its downtime page. Reports rank lost time by machine, shift and cause.
- OEE. Its OEE page covers availability tracking, with a downtime Pareto of the top causes, and quality reporting: a Production Quantity report shows good parts, scrap and quality by job reference.
- Energy. The energy page shows energy cost and carbon footprint by machine, cell or factory, and ranks machines by an energy efficiency metric. It states the current clamps were tested at +/- 5.5% accuracy between 1 and 100 amps.
- Alerts. Email and in-app alerts for machine faults, machines going offline and downtime left without a reason.
- Scope. The home page says it works without replacing your ERP or committing to a large MES implementation.
Worth asking FourJaw: how a machine that idles under power is told apart from one that is cutting, and where part counts come from.
Signs FourJaw is still the right tool
- Most machines have no usable controller, or nobody wants to touch the ones that do.
- Utilisation is the number the board asks for, to decide whether to buy a machine or add a shift.
- Energy is a live topic, and per-machine cost and carbon in the same tool saves a second system.
- Shift leads want stop reasons on a tablet with little training.
If your questions have moved on since the first install, compare the alternatives below by the number each one leads with.
Utilisation, OEE or energy: decide the number first
Power draw shows whether a machine is working. That is enough for utilisation and for stop time. Full OEE needs two more inputs, a reliable part count and an ideal cycle time per part, so that slow running shows up as a loss. Energy needs current or power readings over time. Our OEE vs utilization guide and energy monitoring vs OEE go deeper.
None of these is the wrong number. The mistake is buying a system for one and expecting it to answer another.
FourJaw and four alternatives at a glance
Paraphrased from each vendor's site on 13.11.2026, with links in the sections that follow. Rows are unranked and cells are kept brief on purpose; anything you need beyond them is a question for that vendor. The FourJaw row is there for reference; ours comes next because we publish this page.
| Tool | Main numbers, per its site | How machines connect | Ask the vendor |
|---|---|---|---|
| FourJaw (for reference) | Utilisation, downtime, OEE, energy | Clamp on the power cable | Where do part counts come from? |
| Fabrico | OEE by line and shift, losses in money | PLC, IoT device, camera add-on | How is the ideal cycle set? |
| Factbird | OEE1, OEE2, OEE3, TCU | Sensor device, PLC over MQTT | Which OEE level fits a job shop? |
| Amper | Uptime, downtime, OEE, cycle counts | Universal IoT sensors, PLC links | How does it link to the ERP? |
| TeepTrak | Live OEE, micro-stops, scrap | Sensors, OPC UA, MQTT, Modbus | How are slow cycles detected? |
To see OEE worked out from real counts, book a demo; one shift of part counts from any machine is enough to start.
Fabrico: OEE by line and shift, with losses in money
We make Fabrico, so weigh this section accordingly. Fabrico is OEE software and a light MES, hosted in the cloud. Its pages center on OEE and on losses shown in money. From our MES and OEE overview:
- Performance. Actual output is compared with what the ideal cycle allows in the run time, so slow cycles and micro-stops appear as a loss.
- How machines connect. Automated machines through their PLC; older machines through a Fabrico IoT device fitted with external sensors. See how machines connect for protocols.
- Why it stopped. The signal supplies stop times, and whoever runs the machine adds the reason from a phone or tablet.
- Losses in money. Downtime by cause, machine and shift, with the losses shown in money.
- Manual work. Benches without any signal can be counted by the camera add-on. Click a stop on the shift timeline to open the video for that minute from the camera add-on; by default the footage is streamed on request, not stored (about the camera add-on).
- Repairs. A recurring stop can be turned into a work order for the maintenance team.
- Exports. REST API, webhooks, Excel and CSV. ERP links, SAP among them, are scoped with each customer.
- Timing. Devices connected in about a month; full rollout in 3 to 4 months.
- Left with the ERP: dispatching of jobs, plus routings and BOMs.
Fits plants that already know their utilisation and now need to know why good output trails it, in money. EU customers are hosted on AWS in Frankfurt. Many begin with a single-line pilot; for background, read what OEE software does.
Factbird: layered OEE from the cloud
Factbird describes cloud-based OEE software on its OEE page, used since 2016. Its about page traces the company's start to a project for a Danish brewer. The company was called Blackbird until a 2023 rebrand and has offices in the US and Denmark. As of 13.11.2026:
- A live dashboard tracks OEE1, OEE2, OEE3 and TCU, with an OEE waterfall showing where time is lost.
- Stop categories follow one built-in structure, so lines and sites stay comparable, and operators report the cause.
- On its hardware page: the DUO device for digital or analog sensors, PLC data over MQTT, and the EDGE device for AI vision that tracks units on the line. Data goes to a general or a private cloud.
Compared with FourJaw: both use their own devices and cloud software. Factbird's pages lead with layered OEE figures; FourJaw's lead with power-based utilisation and energy.
Fits plants that want several OEE views, including TCU, and a choice of sensor, PLC or vision input.
Amper: IoT monitoring inside an ERP family
Amper is now an ECI Software Solutions product. Its product page describes a platform for production monitoring and intelligence, aimed at job shops, OEMs and contract makers. As of 13.11.2026:
- Universal IoT sensors capture uptime, downtime and cycle counts on machines of any age or brand.
- Operators log setups, scrap and downtime on a touchscreen that also shows shift targets and how the job is going.
- Ready-made ERP and MES integrations connect jobs, parts and standards with the machine signals.
Compared with FourJaw: both use non-invasive sensors and operator touchscreens. Amper's pages add cycle counts and a route into ECI's ERP products.
Fits shops that run, or plan to run, an ECI ERP and want monitoring tied to jobs.
TeepTrak: sensor-based OEE with open protocols
TeepTrak sells real-time OEE monitoring and production analytics, per its English site, founded by François Coulloudon. As of 13.11.2026, it says:
- Its sensors fit machines of any make or model with no PLC work, and open protocols include OPC UA, MQTT, Modbus, PROFINET, Ethernet/IP, Profibus and dry contact I/O.
- Stops, micro-stops, slow cycles and scrap are captured live, down to 2-minute events, and operators tag the cause on the floor.
- Standard APIs and exports reach SAP, Oracle and Power BI, with reports for ISO 9001 audits.
Compared with FourJaw: both avoid PLC work by default. TeepTrak's pages name slow cycles and protocol options; FourJaw's name energy and carbon.
Fits plants that want sensor-based OEE that can also read PLCs over standard protocols.
Which FourJaw alternative fits
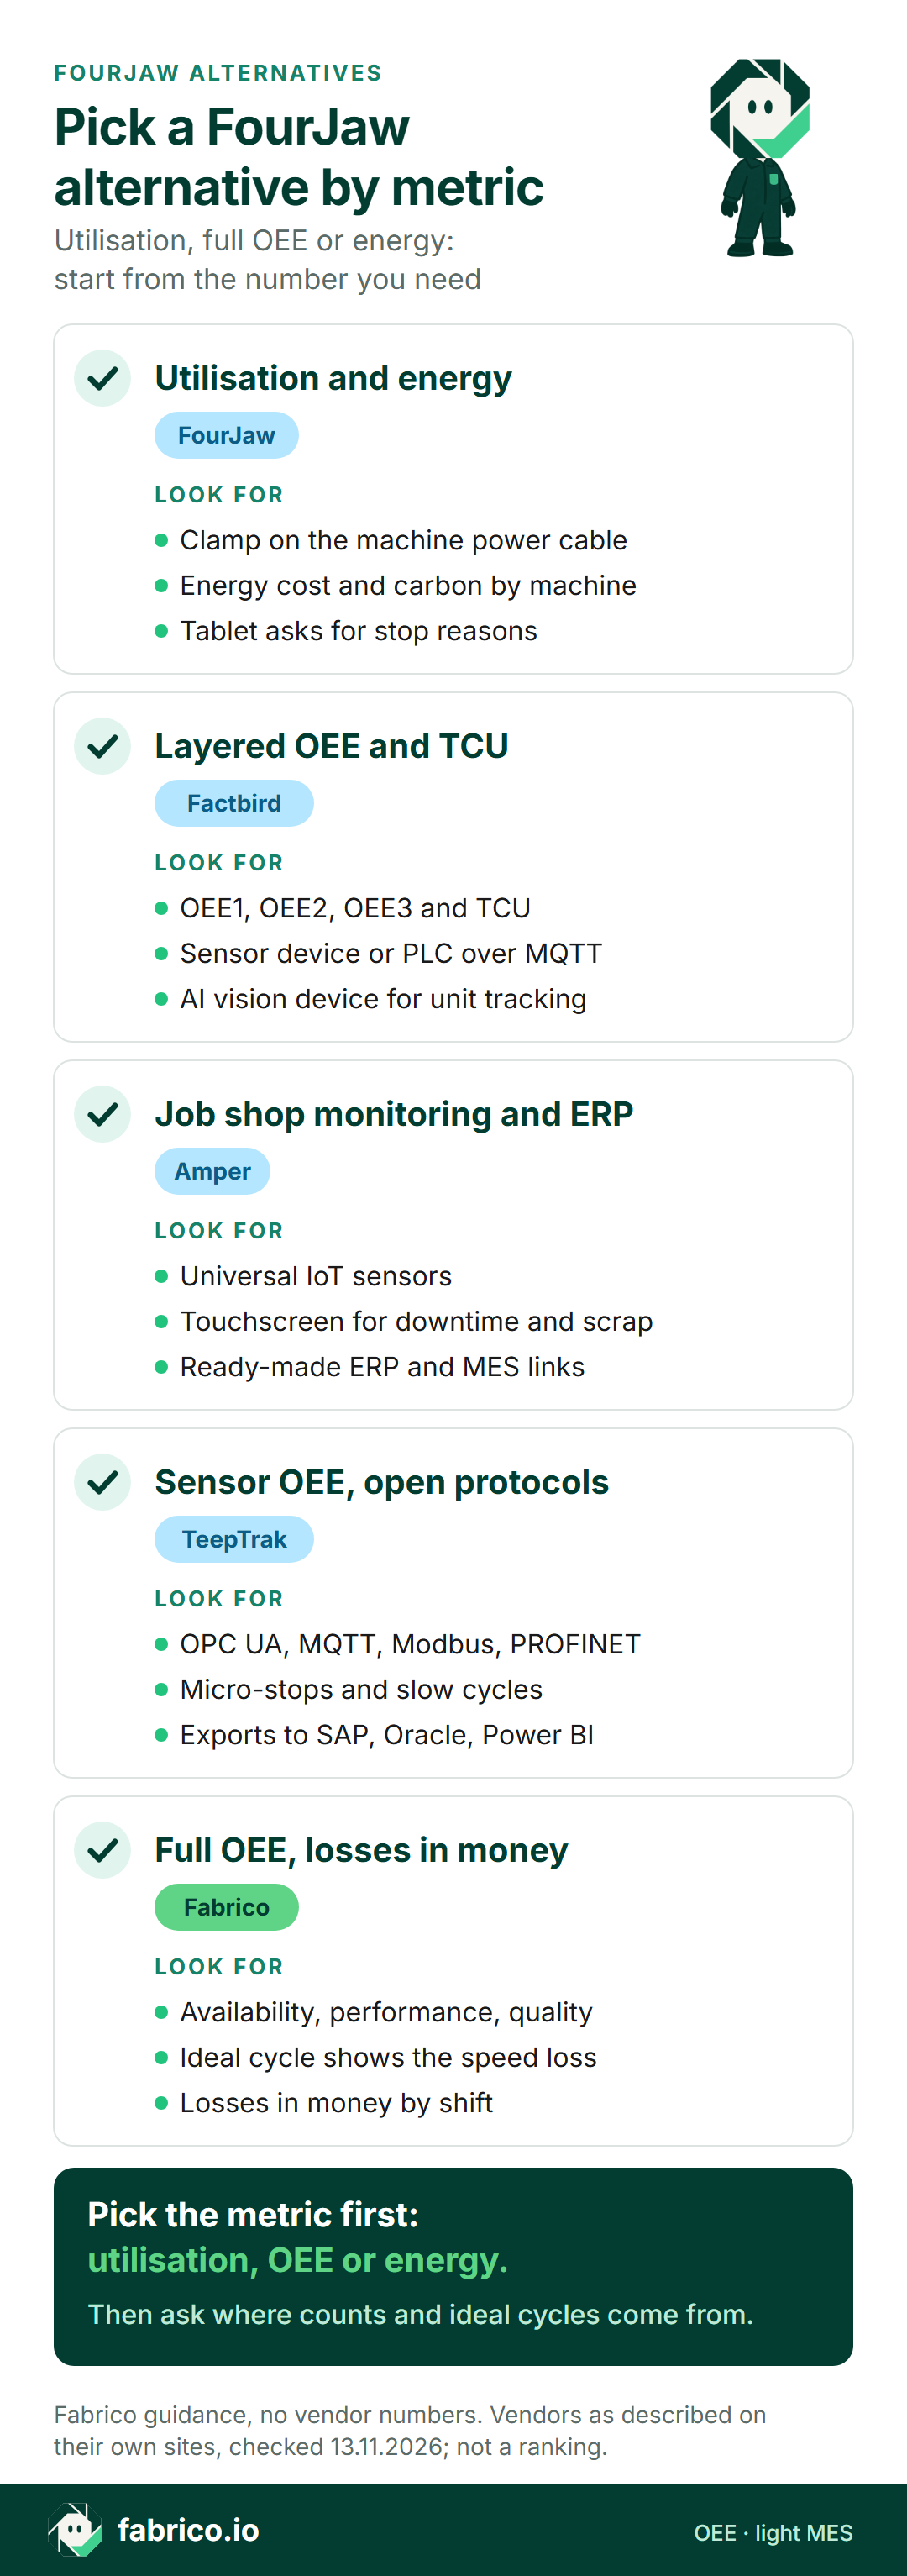
- Utilisation, downtime and energy per machine from power draw: FourJaw.
- Layered OEE figures and TCU, with sensors, PLC data or vision: Factbird.
- Job-linked monitoring that connects to an ECI ERP: Amper.
- Sensor-based OEE with open protocols and slow cycles captured: TeepTrak.
- OEE from PLC or IoT signals, with losses shown in money: Fabrico.
Our machine monitoring software review covers more names, and the guide for small manufacturers helps a smaller firm size the job. Food and household goods plants can start from our FMCG computer vision hub instead.
Worked example: one shift, three different numbers
Made-up figures for one shift on a CNC machining centre; no customer data, no product screenshot. The plan allows 450 minutes and the ideal cycle is 2 minutes a part.
The machine was under load for 360 minutes and stopped for 90. The running share, the utilisation view, is 80.0%, which here equals availability.
It made 150 parts, and 6 were scrapped, so quality is 96.0%.
At 2 minutes a part, 360 minutes allow 180 parts, so performance is 150 / 180 = 83.3%. Full OEE is 80.0% x 83.3% x 96.0% = 64.0%, the same as 144 good parts x 2 minutes over 450 minutes. The 60 minutes of slow running, worth 30 parts, shows up as performance loss once a part count and an ideal cycle time are set for that machine, whichever system you use. Our OEE calculation page shows the method.
What to ask before you switch
Put the same questions to each vendor, Fabrico included, for five machines of different ages.
- Which factors do you calculate? Utilisation, availability, performance, quality, energy, and how each is defined.
- Where does the part count come from? Control, PLC, sensor, operator entry or camera.
- Who sets the ideal cycle, and can it differ by part number?
- How is idling under power handled, such as warm-up or a spindle turning with no cut?
- What happens to history if you leave? Export formats and API access.
- Does it run next to your ERP, and which data goes each way?
What people ask next
Where is FourJaw based?
In Sheffield, England. Its about page says FourJaw began in 2020, spun out of the AMRC at the University of Sheffield, and its contact address is on Hawley Street in Sheffield.
How does FourJaw connect to machines?
Its MachineLink device takes a sensor clipped around the machine's power cable and joins the factory Wi-Fi. FourJaw says no connection to the machine controller is needed, and a high current draw marks the machine as productive.
What does FourJaw's OEE page cover?
It covers availability tracking with a downtime Pareto, and quality reporting through a Production Quantity report of good parts, scrap and quality by job. For any vendor on your list, ask how each of the three OEE factors is defined and where the counts come from.
Is machine utilisation the same as OEE?
No. Utilisation asks how much of the scheduled time a machine was working. OEE multiplies availability, performance and quality, so it also shows slow running and scrap. Many shops track both: utilisation for capacity talks, OEE for improvement work.
How is Fabrico different from FourJaw?
FourJaw reads power draw and adds energy cost and carbon per machine. Fabrico takes its signal from the PLC, or from its own IoT device on older kit, calculates availability, performance and quality against an ideal cycle, and shows the losses in money by line and shift. Its pages center on OEE and downtime cost.
Can Fabrico and an energy monitor run side by side?
Yes. They answer different questions, so plants often keep both. Use one machine list and one shift calendar in each, so stop time and energy use line up when you compare them.
Want to see OEE figures from a machine similar to yours? Book a demo; questions go to our contact page.
Related articles



Latest from our blog



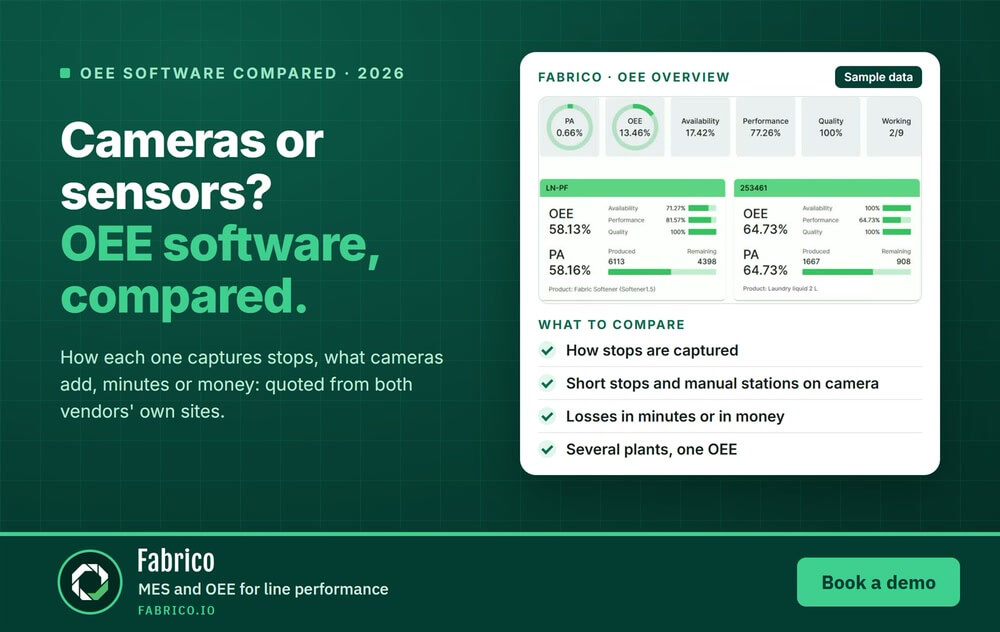
Real Fabrico tiles, sample data.