


 Login
 Blog
ArchFX and Arch Systems Alternatives: AI Guidance, SMT Dashboards or OEE

In short: the right Arch Systems alternative depends on where you want the answer to lost line time to come from. Arch Systems' current site presents the Arch Platform: a data model, guided workflows and AI on top of machine and system data. Similar data and AI layers include Sight Machine; SMT dashboards on connectivity include Cogiscan Factory Insights and iTAC.MA.Suite. If you first need stops timed by the machine and explained by the operator, that is what Fabrico, a light MES with OEE, does.
- If you know the product as ArchFX: Arch Systems' current pages do not use that name, and its old /archfx-platform/ address now redirects to the Arch Platform page.
- The Arch Platform names three parts: Arch Data Twin, Arch GLO and Arch AI, and lists electronics among its industries.
- This page sorts the alternatives by where the explanation of a stop comes from.
- Each vendor is described from its own pages, read 13.11.2026 and linked in place. Prices, verdicts and rankings are left out.
An electronics plant has connected its SMT lines and built dashboards. Everyone can see OEE, but the weekly meeting still argues about why it moved. Some want an AI layer that labels downtime and tells each role what to do. Others want operators to give the reason at the line, so the plant agrees on what happened before anyone automates it.
Arch Systems sells the first approach. This page covers what its platform is today, from its own pages, then three alternatives that work from factory data, then Fabrico, which takes the second approach. We make Fabrico, so we rank nobody. If you need an MES to run electronics production itself, our FactoryLogix alternatives page fits better.
What Arch Systems offers today (as of 13.11.2026, per its site)
If you know Arch Systems' platform as ArchFX, note that its current pages do not use that name. On archsys.io today, the old /archfx-platform/ address redirects to a page titled Arch Platform. Its pages say, as of 13.11.2026:
- Arch Data Twin. It collects and structures raw signals from machines, MES, ERP, SCADA and operator input, through prebuilt interfaces to hundreds of machine types and factory systems (Data Twin page).
- Arch GLO. It takes structured data from the Data Twin and turns it into real-time, role-based actions, and its KPI sets standardize metrics across lines, products and plants (GLO page).
- Arch AI. The Arch AI page calls it the agentic intelligence layer of the platform. It captures and classifies downtime events in real time from a blend of machine and human input, and triggers guided, role-specific actions.
- Deployment. The platform page says it works on premises, in the cloud or hybrid, and is compatible with existing MES, SCADA and dashboard tools.
- Electronics. Its electronics page covers SMT and component placement, AOI and process monitoring, downtime alerts and escalations based on cycle classifications, and IPC standards and traceability.
Its case studies cite OEE and savings figures reported by the vendor; we leave them out.
Ask in the demo: how a downtime label is confirmed when machine data and the operator disagree, and which machines connect in a first phase.
When the Arch Platform is the right pick
- Your data already flows from machines, MES and SCADA, and the gap is turning it into action.
- Several plants should share the same KPIs and playbooks.
- You want AI to label downtime and send role-specific actions, with people in the loop.
If most are true, a data and AI layer fits the plan. If the reasons for stops are not yet agreed at the line, read on.
Where the explanation of a stop comes from
Every tool on this page shows OEE in some form. They differ in where the explanation of a stop comes from. Our guide to OEE in electronics manufacturing covers the loss categories they all use.
Comparison table: the Arch Platform and four alternatives
Our summary of what each vendor's site said on 13.11.2026; the sources are linked further down. No ranking is implied, and Fabrico leads only as the author. If a cell looks thin, the pages were thin on it: ask the vendor.
| Tool | Built around, per its site | Stop causes, per its site | Worth asking |
|---|---|---|---|
| Arch Platform (for reference) | Data Twin, GLO workflows, Arch AI | Machine and human input, classified in real time | Who confirms a label? |
| Fabrico | OEE and light MES | Operators tag from your reason list | How are untagged stops shown? |
| Cogiscan Factory Insights | Dashboards on Co-NECT SMT connectivity | Thresholds and alerts on KPIs | How is a stop defined? |
| iTAC.MA.Suite | SMT.Edge, IIoT.Edge, Asset.Analyzer | Causes of availability, performance and quality losses | Which machines need SMT.Edge? |
| Sight Machine | Context layer for AI agents | Reason codes, operator notes, telemetry | Which systems feed it first? |
Book a demo to see stops and reasons in Fabrico; bring a downtime log that includes the stops nobody explained.
Fabrico: stops timed by the signal, explained at the line
Fabrico wrote this page. It is a cloud-based OEE and light MES platform. Where an AI layer works on data that is already flowing, Fabrico starts at the line: the machine signal records the stop, the operator gives the reason, and the loss gets a price. Per our MES and OEE overview:
- Machine data, three ways. From the PLC, from a Fabrico IoT device with external sensors on older machines, or from AI cameras, an add-on, at manual steps. Protocols include OPC UA, Modbus, PROFINET, MQTT and EtherNet/IP (machine connectivity).
- Stops with reasons. Connected machines report when a stop started and how long it lasted, and short stops are detected from the signal. Operators tag the cause on a tablet or phone from your own list of reason codes, so downtime by cause builds up shift after shift.
- OEE by machine, line and shift, with losses measured in money, on the web, iOS and Android.
- The camera add-on counts output at manual stations, such as rework benches. In the standard setup, video from the camera add-on is streamed on request, not stored in Fabrico (how the camera add-on works).
- Maintenance built in. When a stop needs a repair, a technician opens a work order from the stop, on the same machine record.
- Data out. REST API, webhooks and Excel or CSV export, so an analytics or AI layer can read the labelled stops. A connection to SAP or another ERP can be scoped per customer.
- Rollout. Devices connected in about a month; full rollout in 3 to 4 months.
- Roadmap, not live: a camera add-on that detects stops and offers a likely reason, and production planning and scheduling.
Ask in the demo: how a stop with no reason shows up, and who is asked to fill it in.
Fits plants that want downtime ranked by cause, with reasons the line agrees on, and losses priced by line and shift. EU customers are hosted on AWS in Frankfurt. Quoted per plant. Start with a one-line pilot. See our OEE software guide.
Cogiscan Factory Insights: dashboards on SMT connectivity
Cogiscan's analytics page describes Factory Insights, which calculates and shows data from SMT machines of any brand, from site OEE down to machine-specific KPIs. As of 13.11.2026, its pages say:
- Users set thresholds and alerts so status updates and outliers reach the right people.
- Under it sits Co-NECT, which Cogiscan describes as a standalone, neutral connectivity layer with over 250 adapters for SMT machines (connectivity page).
- Co-NECT handles CAMX, CFX, SECS/GEM or vendor-specific interfaces.
Compared with the Arch Platform: both connect mixed SMT equipment and show OEE. Cogiscan's analytics sit on its own SMT connectivity and traceability stack; Arch's pages put an AI layer on a data model of many systems.
Fits plants that want SMT dashboards on the same connectivity as their traceability and process control.
iTAC.MA.Suite: analytics from iTAC's machine integration
iTAC's manufacturing analytics page says the iTAC.MA.Suite combines iTAC.SMT.Edge, iTAC.IIoT.Edge and iTAC.Asset.Analyzer. As of 13.11.2026, it says:
- It collects, processes and combines data from machines, production lines and plants, with live dashboards, historical trends and KPIs.
- The page describes manufacturing analytics as showing the causes of availability, performance and quality losses.
- Its typical uses include electronics manufacturing, SMT and THT.
- Machine data comes through iTAC.SMT.Edge, which links equipment of mixed brands and ages (SMT.Edge page).
Compared with the Arch Platform: both bring mixed-brand machine data into one view. iTAC's analytics sit next to its MOM suite; Arch's platform sits next to the MES you already run. iTAC and Cogiscan are both in the Dürr group.
Fits plants that run or plan the iTAC.MOM.Suite and want analytics from the same vendor.
Sight Machine: a context layer for AI agents
Sight Machine describes an agentic manufacturing platform. As of 13.11.2026, its pages say:
- Its Manufacturing Context Layer turns raw signals into production events and KPIs, ready for agents to act on.
- It reads controls, historians, MES, ERP and document repositories, and ties every signal to an asset in a semantic layer (semantic model page).
- Downtime is modelled with reason codes, operator notes and machine telemetry, and OEE as availability times performance times quality.
- It publishes manufacturing intelligence as an MCP server for other AI agents.
Compared with the Arch Platform: both build a model of the plant for AI to act on. Arch's pages name electronics and SMT use cases; Sight Machine's describe the model and the agents in general plant terms.
Fits plants that want a plant data model that their own and third-party AI agents can query.
Which Arch Systems alternative fits your plant
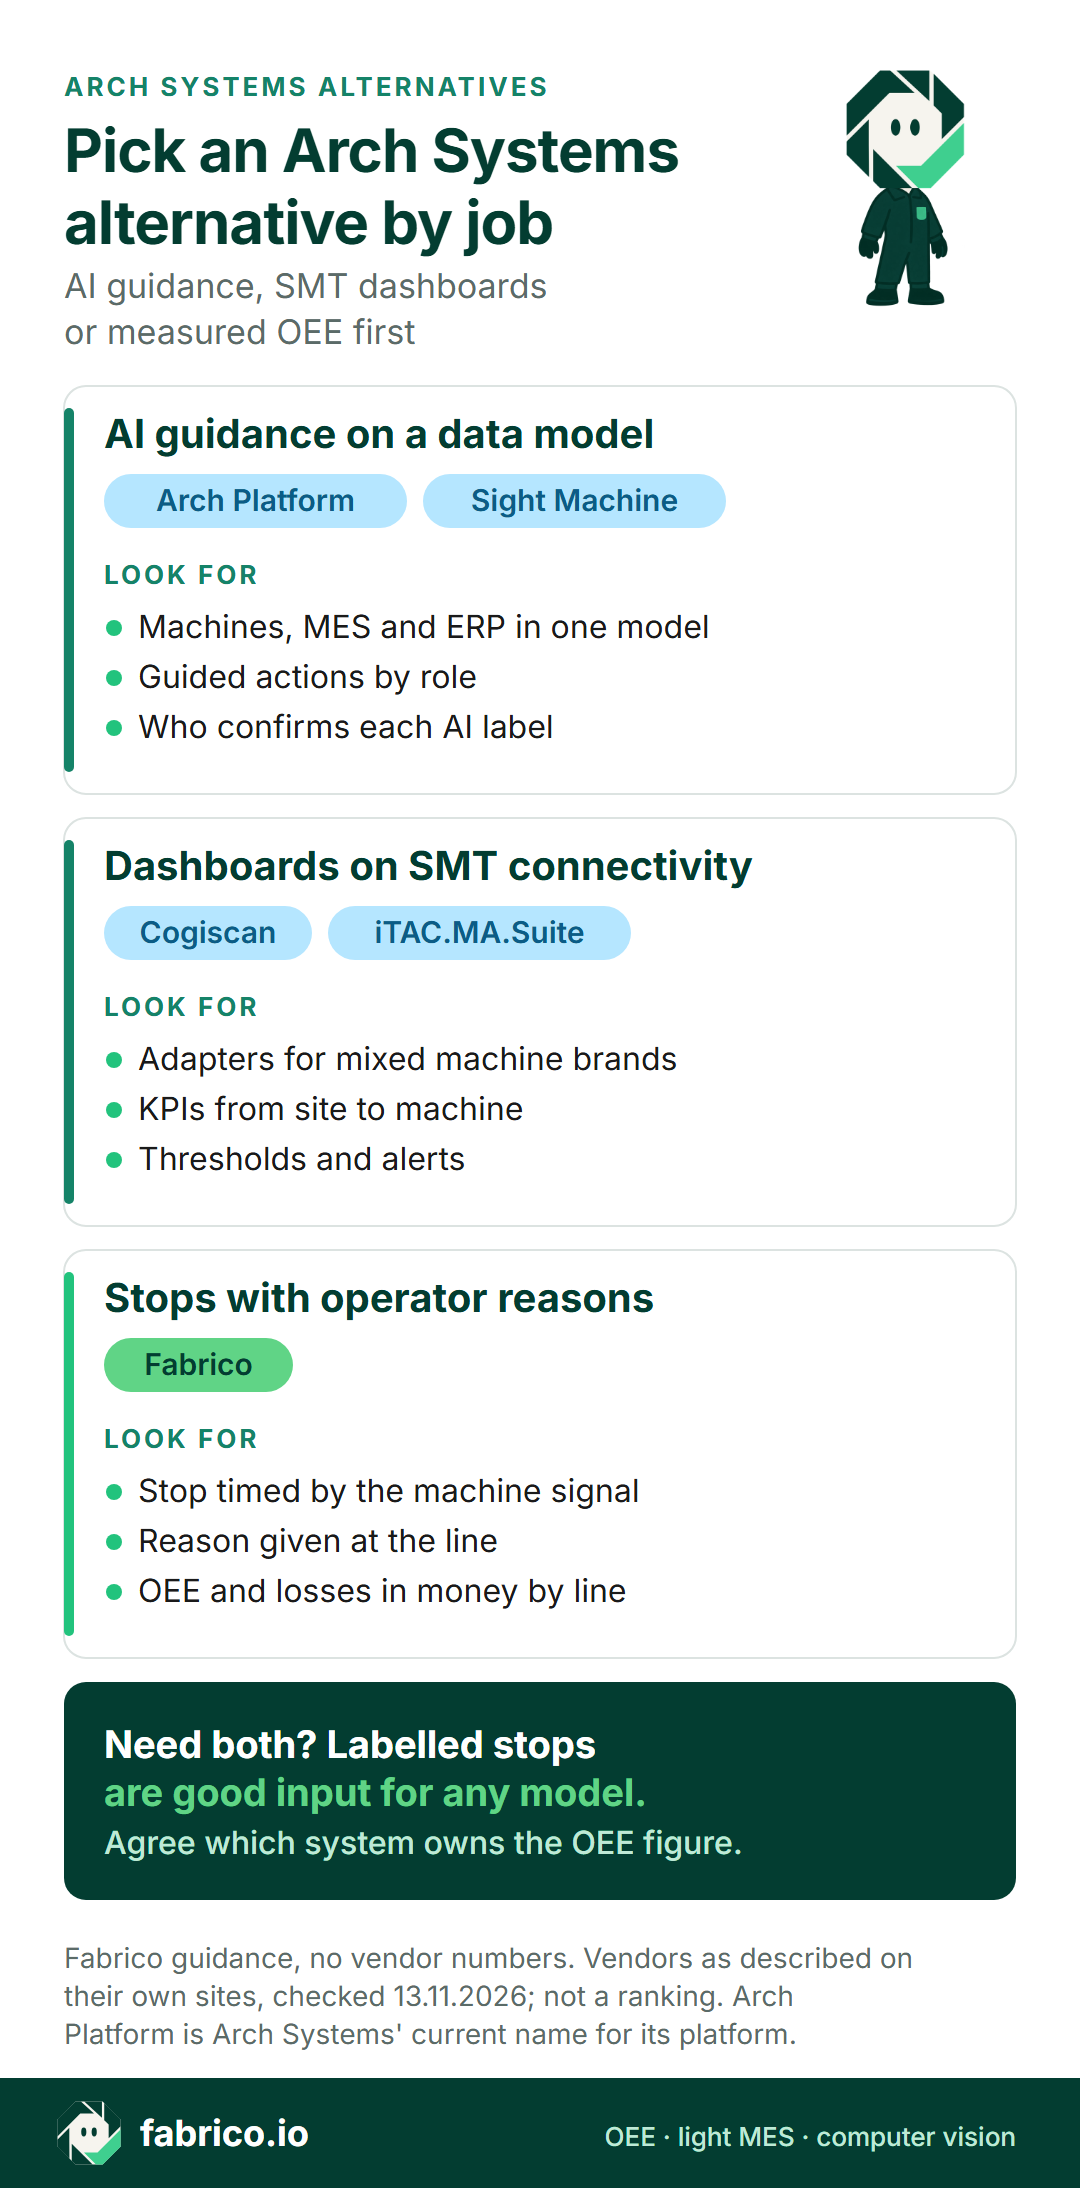
- A data model, guided workflows and AI that labels downtime, for electronics and discrete plants: Arch Platform.
- A plant context layer published to AI agents: Sight Machine.
- SMT dashboards on the same connectivity as traceability: Cogiscan Factory Insights.
- Analytics from the vendor of your MOM suite: iTAC.MA.Suite.
- Stops timed by the signal, reasons from the operator, OEE and the money lost per shift: Fabrico.
An AI layer and an OEE layer can work together: labelled stops are good input for any model. See OEE vs MES and MES for electronics and EMS manufacturing.
Worked example: the minutes nobody explained
Sample data, invented for this page and not taken from a customer or a product screen: an SMT line over a single 8 hour shift, 450 minutes planned. Placement is the slowest step; its ideal cycle is 0.5 minutes per panel.
Stops took 72 minutes, so run time was 378 minutes and availability 84.0%. In 378 minutes the ideal is 756 panels. The line built 700, so performance is 92.6%.
Fourteen panels went to rework, leaving 686 good: quality is 98.0%. OEE is 84.0% x 92.6% x 98.0% = 76.2%, equal to 686 good panels at 0.5 minutes each, divided by 450 minutes.
The OEE figure is the same whether or not the stops have reasons. What changes is what the plant can act on. Here 18 of the 72 stop minutes, a quarter, have no reason. Ask how those minutes get a cause, and who confirms it. Our OEE calculation page walks through the formula, and the SMT first pass yield guide covers quality.
Questions for every shortlist vendor
Ask every vendor, Fabrico included, about the same line.
- Where does the reason for a stop come from? The operator, a model, or both, and who confirms it.
- What does phase one connect? Machines by brand and interface, plus MES, ERP or SCADA.
- What does the OEE math assume? The machine whose rate counts as ideal, and how short stops and changeovers are booked.
- What happens to a stop with no reason? Is it shown, chased, or labelled for you.
- Who maintains the data model? When a line, a product or the reason list changes, who updates it.
What people ask next
Is ArchFX the same as the Arch Platform?
Arch Systems' current pages do not use the name ArchFX. They present the Arch Platform, with Arch Data Twin, Arch GLO and Arch AI, and the old /archfx-platform/ address redirects to the Arch Platform page. Ask Arch Systems how earlier ArchFX modules map to the current platform.
What does the Arch Platform do?
Per its site, Arch Data Twin structures signals from machines, MES, ERP, SCADA and operators, Arch GLO turns them into role-based actions and KPIs, and Arch AI classifies downtime events and triggers guided actions.
What are the main Arch Systems alternatives for electronics plants?
For a plant data model for AI agents, Sight Machine. For SMT dashboards on connectivity, Cogiscan Factory Insights or iTAC.MA.Suite. For stops with operator reasons and OEE in money, Fabrico's light MES.
Does the Arch Platform run on premises?
Its platform page says it works on premises, in the cloud or hybrid, and the Data Twin page lists hybrid and on-prem options for compliance or control.
How is Fabrico different from the Arch Platform?
Arch describes an AI layer that labels downtime and guides actions on top of existing data. Fabrico times stops from the machine signal, takes the reason from the operator, and shows OEE with the money lost per line and shift. Its labelled stops can feed an analytics layer through the REST API.
Can an OEE layer feed an AI or analytics platform?
Yes. Stops with agreed reasons are useful input for any model. Decide which system is the source of the OEE number, then export the labelled stops through the API or a file.
Want to see how Fabrico handles stops and reasons? Book a demo or get in touch.
Related articles




Real Fabrico tiles, sample data.