


 Login
 Blog
Annual Operating Plan in Manufacturing: Build Capacity From Real OEE

In short: the capacity side of an annual operating plan in manufacturing should start from demonstrated capacity, which is nameplate rate times measured OEE over planned production time, line by line, and not from nameplate speed. Then convert the gap into line hours and price five ways to close it.
- Demand turns into line hours through five numbers: planned time, demonstrated OEE, changeovers, planned maintenance and the rate.
- In the sample three-line plant, nameplate says the 2027 plan is 59% loaded; measured OEE says it is 1,213,840 bottles short.
- Left open, that gap costs about USD 1,486,905 of gross profit a year at a sourced household products margin.
- Closing it costs USD 92,000 to 785,000 depending on the option, so the choice is worth an hour of the AOP meeting.
November is planning season. Corporate sends the annual operating plan (AOP) template, sales sends next year's volume, and the plant has a few weeks to say whether it can make it and what that will cost. Most plants answer with last year's budget plus a growth factor, and with line capacity taken from the machine's nameplate. That is how a plant signs up for a plan it cannot run, then spends the year paying for overtime nobody budgeted.
This guide covers the plant's capacity side of the AOP: how to turn demand into line hours, why measured OEE beats nameplate as the planning basis, how a capacity gap flows into labour, overtime, shift and outsourcing lines, and what to bring to the meeting. The worked example is a three-line household products plant with every number carried to dollars. The monthly sales and operations cycle that follows the AOP is covered in the S&OP guide.
What the plant owes the annual operating plan
Finance owns the AOP document. The plant owns the numbers that make it true: how much each line can make next year, how many people and hours that takes, and what the plant will spend to close any gap. Three answers matter most.
- Can we make the volume? Per line, per quarter, at rates the lines have actually shown.
- What does it cost? Labour hours, overtime, a shift change, outsourced volume and projects, each as a budget line.
- What has to be true? The OEE improvements, hires and investments the plan depends on, with dates.
The first answer drives the other two. If line capacity is overstated, the labour budget is too low, overtime turns up as a variance in March, the co-packer is booked in a panic at spot prices and the capex request arrives a year late. One wrong input, four wrong budget lines.
From demand to line hours: five numbers per line
A capacity plan is a chain. Demand in units becomes required hours on each line, and required hours are compared with available hours. Five numbers per line carry the chain.
- Planned time. The shift pattern times the working days, minus holidays and shutdown weeks. This is a decision, not a measurement.
- Planned maintenance. The hours booked for preventive work and cleaning windows, taken out before the line is asked to produce.
- Nameplate or ideal rate. The rated speed for the product family, in units per hour.
- Demonstrated OEE. Availability times performance times quality, measured on the line over recent weeks. It already contains this year's breakdowns, short stops, slow running, rejects and changeovers.
- Changeover change. Only the difference from this year: new SKUs, smaller batches or a new format add changeovers that this year's OEE does not yet contain.
Demonstrated capacity is then the rate times OEE times planned production time. Required hours are demand divided by the demonstrated rate. The order matters: planned maintenance comes out of planned time, changeovers stay inside OEE, and only next year's extra changeovers are subtracted on top. Do not count this year's changeovers twice: they are already inside OEE. The OEE calculation guide covers the formula and its time categories; the changeover time guide covers how to measure them.
The Federal Reserve uses the same idea for national capacity statistics. Its capacity indexes aim at sustainable maximum output, which it defines as the greatest level of output a plant can maintain within a realistic work schedule, after normal downtime (Federal Reserve Board, G.17 notes on capacity utilization). A nameplate figure has no downtime in it, so it is not capacity in that sense. It is a ceiling.
Nameplate, last year's average or demonstrated rate: pick the planning basis
Plants use one of three bases, and the choice decides how honest the AOP is.
- Nameplate. Easy, always available, and always optimistic. It assumes no stops, full speed and no rejects.
- Last year's average. Better, but often typed from shift sheets, and a single plant figure hides a weak line behind a strong one.
- Demonstrated rate per line. Nameplate times OEE measured from the machine over at least 13 recent weeks, with the same definitions on every line. This is the basis that survives a challenge from finance.
Speed loss is the part nameplate planning hides best. A study of OEE data from 98 Swedish manufacturing companies, gathered between 2006 and 2012, found that operational efficiency losses had the largest impact on OEE, followed by availability losses (Chalmers University of Technology, International Journal of Productivity and Performance Management, 2017). A plan that only subtracts known breakdowns from nameplate still assumes the line runs at full speed between them.
The demonstrated rate needs data the plant can defend. When OEE software measures the line from the machine signal and operators add the stop reason at the line, the 13-week figure is a sum of timed events that finance can open down to the line, the shift and the loss. That is the difference between "we think line 3 runs at about 55%" and a number the plant controller will sign.
What you see: a shift timeline, unclassified time waiting for a reason, and the operator's line-down screen, on sample lines. Book a demo.
Plays from YouTube. Google may set cookies when you press play. Privacy policy.
Worked example: a three-line household products plant
Sample figures for illustration only. A US plant fills 1 litre bottles of liquid detergent and surface cleaner on three lines. It runs two 8-hour shifts, five days a week, 50 weeks a year, and books 4 hours of planned maintenance per line each week.
- Planned time per line: 250 days times 2 shifts times 8 hours = 4,000 hours.
- Planned maintenance: 4 hours times 50 weeks = 200 hours.
- Planned production time: 4,000 less 200 = 3,800 hours per line.
OEE is measured per line over the last 13 weeks, and the demonstrated rate is nameplate times OEE.
| Line | Nameplate (bottles/h) | Measured OEE | Demonstrated (bottles/h) |
|---|---|---|---|
| Line 1 | 6,400 | 61% | 3,904 |
| Line 2 | 4,800 | 57% | 2,736 |
| Line 3 | 3,600 | 53% | 1,908 |
| Line | On nameplate (bottles a year) | Demonstrated (bottles a year) |
|---|---|---|
| Line 1 | 24,320,000 | 14,835,200 |
| Line 2 | 18,240,000 | 10,396,800 |
| Line 3 | 13,680,000 | 7,250,400 |
| Plant | 56,240,000 | 32,482,400 |
Next year brings 120 extra changeovers on line 2 for a new range of refill packs. At a measured three quarters of an hour each, that is 90 hours, or 246,240 bottles at line 2's demonstrated 2,736 bottles an hour. Demonstrated capacity for 2027 is 32,482,400 less 246,240 = 32,236,160 bottles.
Sales asks for 33,450,000 bottles. On nameplate the plan is 59.5% loaded, with 22,790,000 bottles to spare, and nobody asks a question. On demonstrated capacity the plant is 1,213,840 bottles short, 3.8% of what it can make. At line 1's demonstrated 3,904 bottles an hour, that is about 311 line hours.
What is the gap worth? Take a sample net selling price of USD 2.40 a bottle. US household products companies report a gross margin of 51.04% (NYU Stern, Damodaran margins by sector, 110 firms, data as of January 2026). Gross margin is a floor for the contribution a lost bottle takes with it, because cost of goods also carries fixed cost. Unmade volume: 1,213,840 times USD 2.40 = USD 2,913,216 of revenue, and 2,913,216 times 51.04% = USD 1,486,905 of gross profit a year. That is the cost of doing nothing, and the yardstick for every option below.
What a 5-point OEE assumption costs in the AOP
Plans often carry an improvement target inside the capacity number: "line 1 will run at 66% next year". If the target is in the plan but the work is not, the plan is short by the difference. On line 1, 5 OEE points are 5% of 24,320,000 nameplate bottles, or 1,216,000 bottles. At USD 2.40 and a 51.04% gross margin, that is USD 2,918,400 of revenue and USD 1,489,551 of gross profit that the budget already counts.
The fix is to keep two numbers apart. Plan capacity on the demonstrated rate. List the improvement as a project with an owner, a cost, a quarterly gate and a fallback. If the project delivers, the plant beats the plan. If it does not, the fallback is already budgeted. The capacity release business case explains how freed hours turn into cash, and only then into a target.
From capacity gap to budget lines: labour, overtime, shifts and outsourcing
Every way of closing a gap lands in a different budget line, and each has a sourced price driver. Start from the labour base, then price the extra hours.
Labour base. US employers paid USD 39.25 an hour in total compensation for production occupations in manufacturing, of which USD 25.64 was wages and salaries (BLS, Employer Costs for Employee Compensation, June 2026). The sample plant crews each line with 7 operators on each shift: 42 people times 2,000 hours worked times USD 39.25 = USD 3,297,000 a year. That is the line the AOP labour budget starts from.
Overtime. Under federal law, covered employees must receive overtime pay for hours over 40 in a workweek at not less than time and one-half their regular rate (US Department of Labor, Wage and Hour Division). A Saturday after a five-day, 40-hour week is overtime: 1.5 times USD 25.64 = USD 38.46 an hour in wages, before payroll taxes. Overtime also carries a cost the payroll does not show. A NIOSH review of 52 studies found that in 16 of 22 studies on general health, overtime was linked to poorer health, more injuries, more illness or higher mortality (NIOSH, Overtime and Extended Work Shifts, 2004). Long overtime runs also eat the weekend maintenance windows. The overtime and weekend shift diagnostic shows how to check what existing overtime is really buying.
A second or third shift. A new shift is priced at full employer cost, not wages, because the people are permanent: USD 39.25 an hour per person in the BLS figure, plus any shift premium your agreement sets. Night work needs a risk assessment as well; UK HSE guidance on managing shift work sets out employers' legal duties to assess the known and associated risks (HSE, HSG256). Hiring lead time belongs in the plan as a date.
Outsourcing. A co-packer's price carries its own margin, freight and quality control on top of the variable cost you avoid. The premium per unit is the budget line. The make or buy guide covers how to test a co-packer's offer against the in-house line.
Capex. Investment enters the AOP as depreciation and cash, and it needs a measured gap behind it. US household products companies spent capital expenditure equal to 106.72% of depreciation (NYU Stern, Damodaran capital expenditures by sector, data as of January 2026), so the sector mostly replaces what wears out. A request that adds capacity has to show the board the hours it cannot find any other way. The capex avoidance business case covers the board side; hidden capacity before buying a production line covers the measurement.
Closing a capacity gap: improve OEE, overtime, a shift, outsourcing or capex
The sample plant needs 1,213,840 more bottles, about 311 hours of line 1. These are the five options with sample cost ranges built on the sourced rates above. The ranges are for this gap only; your own crew sizes, premiums and quotes replace them.
| Option | Cost to close 1.21M bottles (sample) | Choose it if | Watch out for |
|---|---|---|---|
| Improve OEE | USD 60,000 to 180,000 in the year: engineering time, spares, OEE software | A measured, named loss covers the gap and you can gate it by quarter | Gains arrive late; book a fallback |
| Overtime | USD 92,612 to 132,302 for 43 Saturday shifts | The gap is small and seasonal | Fatigue, lost maintenance windows, weekend OEE |
| Add a shift | USD 549,500 to 785,000 a year for a third shift on line 1 | The gap is 10% or more and lasts two years | Hiring lead time, night work risk, spare capacity |
| Outsource | USD 121,384 to 303,460 at a USD 0.10 to 0.25 premium a bottle | The gap is short or tied to a few SKUs | Margin, quality control, freight, minimum volumes |
| Capex | USD 250,000 to 600,000 to speed up line 3; a new line is a separate, larger case | The gap lasts for years and the line is near its practical ceiling | Lead time; the gap must be measured first |
How the ranges are built. Improve OEE: 2 points on line 1, 3 on line 2 and 2 on line 3 add 1,307,200 bottles, which covers the gap with 93,360 to spare; the cost is a sample range for engineering time, spares and an OEE system for one year. Overtime: weekend OEE is set 5 points under the weekday 61% (sample), so line 1 makes 3,584 bottles an hour and needs 338.7 hours, or 43 Saturday shifts of 8 hours. That is 344 hours times 7 operators times USD 38.46, up to 10 people with a supervisor, a QA technician and a forklift driver. Third shift: 2,000 hours times 7 to 10 people times USD 39.25, which adds 7,808,000 bottles, about six times the gap. Outsourcing: the floor of USD 0.10 a bottle is the 18.62% pre-tax operating margin of US household products firms (NYU Stern, January 2026) on a sample co-pack fee of USD 0.55; the top of USD 0.25 adds freight and quality checks. Capex: sample ranges for a capper and labeller upgrade on line 3.
Every option costs less than the USD 1,486,905 gross profit at stake, so the question is not whether to close the gap but which risk to carry. In the sample plant the gap is 3.8% of demonstrated capacity, and the 13-week loss list shows short stops on line 2 and slow running on line 3 worth more than the gap. The plan therefore books OEE work as the main route and overtime as the budgeted fallback.
Choose improve OEE if a measured, named loss covers the gap and someone owns it. Choose overtime if the gap is small, seasonal or a bridge until the OEE work lands. Choose a shift if the gap is 10% or more of capacity and will last two years. Choose a co-packer if the gap is short or sits in a few SKUs the line handles badly. Choose capex if the gap lasts for years and the line is near its practical ceiling with its losses measured and worked. Plants often combine two: OEE work with an overtime fallback, or a co-packer bridge while a shift is hired. Before committing to capex, work through debottlenecking the production line; if a new site is on the table, brownfield vs greenfield covers that choice.
Who should pick. The plant manager proposes and owns the option. The plant controller checks the cost range and the fallback. HR signs off a shift change and the hiring date. Supply chain owns any co-packer contract. Capex goes to whoever signs investments, with the measured gap attached.
Questions to ask before the plan is locked:
- To your own team: which named losses, in hours per line, add up to more than the gap, and who owns each one?
- To your own team: how many changeovers will next year's SKU list add, at the minutes measured this year?
- To finance: do we value lost volume at contribution or at gross margin, and which rate goes into the overtime line?
- To HR: how long does it take to hire and train a full crew for an extra shift, and what does the agreement set as a night premium?
- To a co-packer: what is the price split into conversion, materials and freight, and what is the minimum run and the notice period?
- To an OEE software vendor: how is OEE calculated from the machine signal, and can the 13-week demonstrated rate per line be exported for the planning sheet?
Want the AOP capacity sheet built from measured line data? Book a demo with last year's capacity sheet at hand, and set its rates next to demonstrated ones.
What to bring to the AOP meeting
A plant that walks in with these eight numbers per line spends the meeting on decisions instead of on whose figure is right.
- Demand by line: Volume per line and SKU family, by quarter.
- Planned hours: Shift pattern, holidays and shutdown weeks.
- Demonstrated OEE: 13 weeks per line, split into A, P and Q.
- Changeovers: Next year's count times measured minutes.
- Planned maintenance: Hours per line, booked in the calendar.
- The gap: In bottles and in line hours, by quarter.
- Options priced: Cost range, owner and trigger per option.
- Risks and triggers: What changes the plan, and by when.
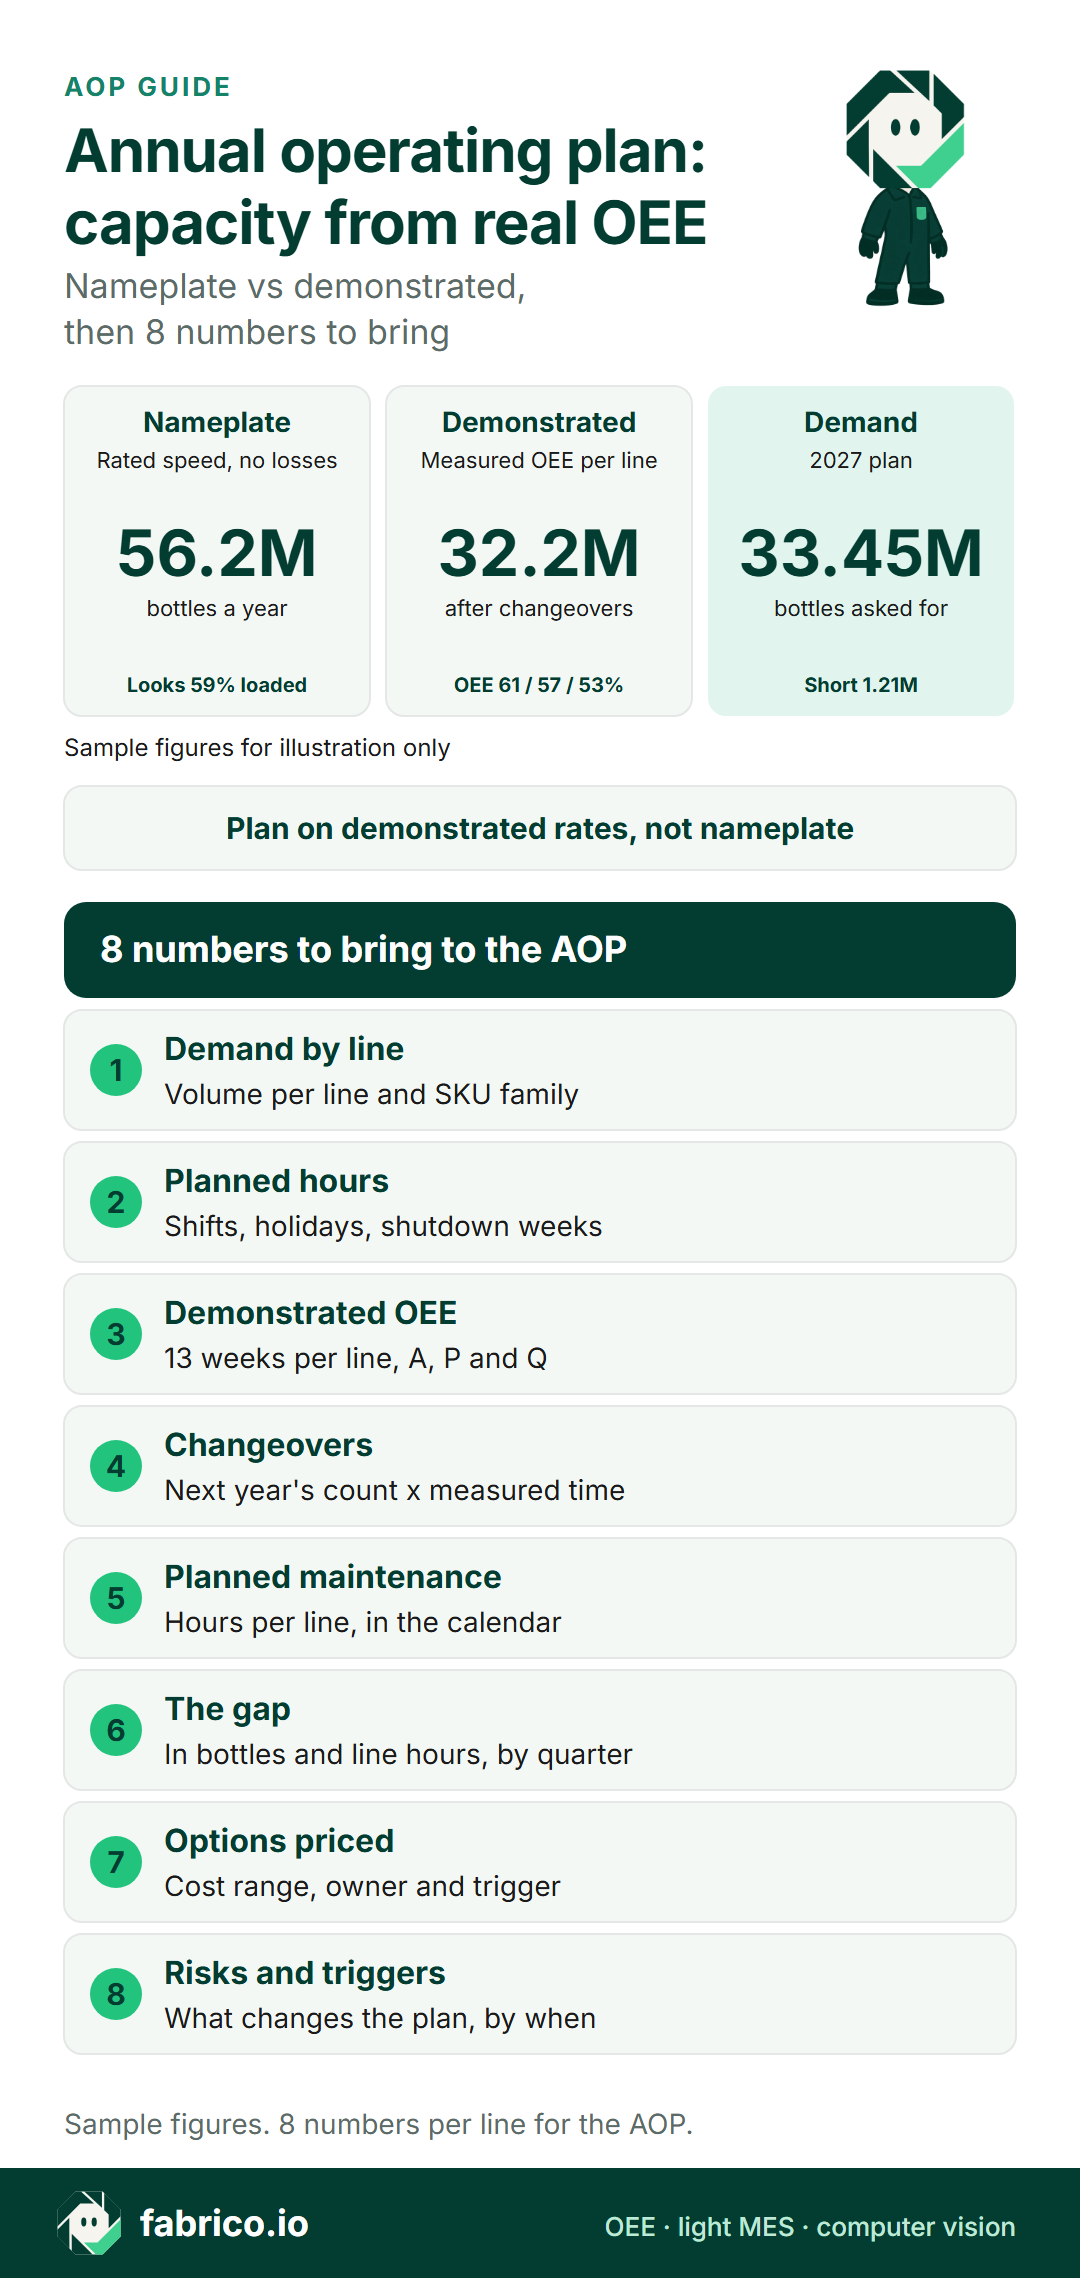
Text version of this infographic
- Nameplate capacity: 56.2 million bottles a year on three lines.
- Demonstrated capacity at measured OEE, after new changeovers: 32.2 million.
- 2027 demand in the plan: 33.45 million, a gap of 1.21 million bottles.
- 1. Demand by line: Volume per line and SKU family, by quarter.
- 2. Planned hours: Shift pattern, holidays and shutdown weeks.
- 3. Demonstrated OEE: 13 weeks per line, split into A, P and Q.
- 4. Changeovers: Next year's count times measured minutes.
- 5. Planned maintenance: Hours per line, booked in the calendar.
- 6. The gap: In bottles and in line hours, by quarter.
- 7. Options priced: Cost range, owner and trigger per option.
- 8. Risks and triggers: What changes the plan, and by when.
Corporate will push back on two things: the OEE basis and the cost of the gap. Answer the first with the 13-week data per line and its definitions. Answer the second with the gross profit at stake, using the sourced margin and the plant's own price. Present the improvement target separately from the capacity number, so the plan does not depend on work that has not started.
A planning-season calendar: November to March
- Week 1 of planning season: pull 13 weeks of OEE per line, split into availability, performance and quality, and agree the definitions with finance.
- Week 2: get next year's volume by line and SKU family from sales, and next year's SKU list from marketing, to count changeovers.
- Week 3: build the capacity sheet: planned time, planned maintenance, demonstrated rate, changeover change, gap in units and hours by quarter.
- Week 4: price the five options, choose a main route and a fallback, and write the trigger that switches between them.
- January: start the OEE work on the largest named loss, with a target in recovered hours.
- End of March: gate review. If the demonstrated rate has not moved, start the fallback in April, while it is still in the budget.
The monthly review then tracks the plan in hours, not just in units, and the rough-cut capacity planning guide covers the check on each month's schedule against the key lines. For a plant-wide view of how loaded the lines are, see capacity utilization.
Where Fabrico helps with the capacity side of the AOP
Fabrico is OEE and light MES software. It measures the line from the machine, which is where a demonstrated rate per line comes from. Production planning and scheduling are not part of Fabrico today; the plan itself stays in your planning tools.
- OEE per line from the machine signal: data comes from the PLC or an IoT device with sensors, so the 13-week rate is built from timed events, not shift sheets.
- Losses by cause: operators pick the stop reason at the line on a tablet or phone, and downtime splits by cause, machine and shift, which is the named loss list the improvement option needs.
- Losses in money: Fabrico puts a money value on each loss, so the gap and the improvement target can be discussed in dollars with finance.
- Data out for the planning sheet: lists export to Excel or CSV, and data also leaves through the REST API and webhooks.
- Manual steps: where a hand-pack or end-of-line station has no usable signal, the camera add-on counts output. Where the camera add-on covers the station, the video for the minute of a stop can be opened from the shift timeline, streamed on request and not stored in Fabrico.
Read on: OEE software for how to evaluate it, the OEE and MES solution overview, light MES, MES for mid-size FMCG plants, the computer vision for OEE feature and computer vision for household products manufacturing. To brief the controller first, see explaining OEE to finance.
Questions plant managers ask about the annual operating plan
What is an annual operating plan in manufacturing?
It is the plant's commitment for next year: the volume it will make, the hours, people and money that takes, and the improvement targets. Corporate rolls the plant plans into the company plan, usually in the autumn, and finance turns it into the budget.
What is the difference between an annual operating plan and a budget?
The operating plan says what the plant will do: volumes, line hours, shifts, headcount, projects. The budget is the money view of that plan. If the capacity side of the plan is wrong, the budget is wrong in labour, overtime and outsourcing at the same time.
Should AOP capacity use nameplate speed or OEE?
Use demonstrated capacity: nameplate rate times measured OEE over planned production time, line by line. Nameplate is a ceiling. In the sample plant it made a plan that was 1.21 million bottles short look 59% loaded.
How many weeks of OEE data does the AOP need?
Thirteen weeks per line is a sensible minimum, so one bad week does not set the plan. Use the same OEE definitions on every line, and adjust for known changes next year, such as more changeovers or a new product.
How do you turn a capacity gap into a budget line?
Convert the gap into line hours at the demonstrated rate, then price each way of finding those hours: OEE work, overtime at time and one-half, a shift at full employer cost, a co-packer premium per unit, or capex as depreciation. Put the chosen option and its fallback in the budget.
When does a plant need capex rather than better OEE?
When the gap is large, will last for years, and the line is already near its practical ceiling with its losses measured and worked. If the loss list is still long or unclassified, recovering hours is usually cheaper and faster to test first.
Want next year's capacity sheet built on demonstrated rates instead of nameplate? Book a demo and see how 13 weeks of line data become the five numbers per line.
Related articles




Latest from our blog


Real Fabrico tiles, sample data.