


 Login
 Blog
Batch Cycle Time: Where the Batch Day Goes and What to Cut First

In short: batch cycle time is the time one vessel takes from the start of charging a batch to the start of charging the next: charge, heat, hold, discharge, clean, and every wait in between. The batch cycle time formula adds those rows. The batch cycle time calculation takes them from phase timestamps the batch system or PLC already records, and a batch cycle time analysis turns them into a ledger of the vessel's day. Batch cycle time reduction then starts with the rows nobody planned.
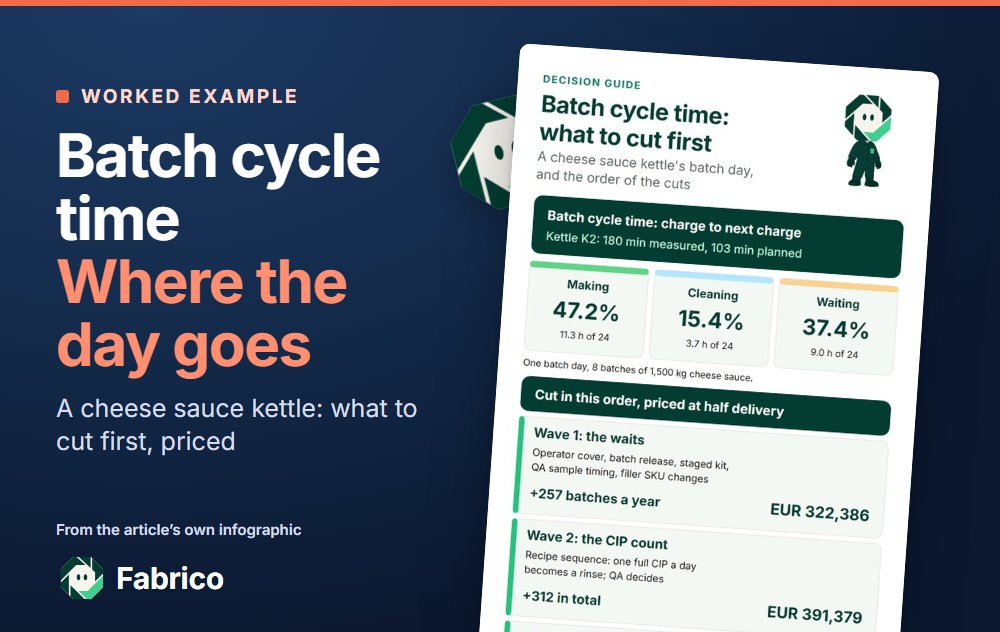
- In the worked example, a cheese sauce kettle spends 47.2% of its day making sauce, 15.4% cleaning and 37.4% waiting.
- Cut the waits first: they need no recipe change and no validation. Then the number of CIPs. Heating and transfers last.
- The hold, the cooling and the validated CIP contact time stay fixed.
- Price each cut at half of its planned saving. Here the base case is 371 more batches and EUR 465,390 a year, if the sauce sells.
Ask a production meeting how long a sauce batch takes and the answer is the recipe: charge, heat, hold, discharge, rinse, about an hour and a half. Divide the kettle's staffed day by the batches it made and the answer is three hours. The gap is not slow cooking. It is time when no recipe step was running: the kettle waited for a QA result, for an operator at shift handover, for the weigh room, for the filler, or for the plan to release a batch.
This guide is for plant, production and process engineering managers in batch food and FMCG. It works one week on a cheese sauce kettle, builds the ledger of its batch day from timestamps, and ranks the cuts by what each is worth at half delivery.
Batch cycle time from charge to next charge: the formula
The term has two meanings, and a West Virginia University teaching module on batch operations (Turton and Shaeiwitz, American Society for Engineering Education, 2010) uses both. In its worked recipe, the total time to complete one batch, which it calls the cycle time, is 14.5 hours. A few paragraphs later it defines the cycle time as the minimum time needed to repeat the batch, which in a single-product campaign is the longest processing time of any piece of equipment. In that example the dryer is the rate-limiting step and the cycle time is 4 hours.
On a kettle that limits a product family, the two meet: the kettle's own batch cycle time is the pace of the kitchen. This page measures it start to start:
Batch cycle time (one vessel, start to start) = charge + heat or mix + hold + discharge + clean (rinse or CIP) + waits.
Waits = QA sample waiting for release + no operator at the vessel + ingredients not staged + the next vessel or the filler not ready + a clean vessel with no batch released.
Batches a day = staffed minutes / mean batch cycle time.
Start to start, rather than charge to discharge, keeps the cleaning and the waits in the number: a kettle that stands clean until the next shift arrives has lost that time as surely as a slow heat-up.
The filler side is the quickest to measure. Line software connected to the filler's PLC records its run time, stops and counts, and the operator gives the stop reason at the machine, so the time the filler spends waiting for product becomes a number a shift instead of unclassified downtime. That number shows early whether the kettle or the filler sets the pace. How batch time feeds availability and performance is set out in OEE for batch manufacturing. The walkthrough below shows a shift timeline and how a stop waits for its reason.
Demo data is synthetic. Book a demo.
Plays from YouTube. Google may set cookies when you press play. Privacy policy.
The names for the parts come from ISA-88. ISA lists ISA-88.00.01-2010, Batch Control Part 1: Models and Terminology as the foundational standard that establishes a consistent set of models and terminology for batch control systems, and the IEC webstore lists the international twin, IEC 61512-1, Batch control Part 1: Models and terminology, first published in 1997 and now replaced by a 2026 edition. Applied to a kettle, the unit procedure is everything that runs on it from the start of charging until it is clean and ready, and its length is the vessel batch cycle time. The phases (charge, heat, hold, discharge, rinse) carry the start and end times. Waits are not phases at all: they are the gaps between one phase's end and the next one's start, which is why a report built on recipe times leaves them out.
| What you need | Where it is held | Watch out for |
|---|---|---|
| Batch ID, recipe and version | Batch system; on PLC-only kettles, the HMI log or the paper batch sheet | Batches restarted under a new ID |
| Phase start and end | Batch system event log; on PLC-only kettles, the sequence step changes in the historian | A phase paused and resumed: log the pause as a wait, not as phase time |
| Product temperature, steam pressure | Kettle PLC and historian | They explain why a phase ran long, not whether it did |
| Sample taken and released | LIMS or the lab log | A lab clock that is not in step with the PLC |
| Filler running, stopped, waiting for product | Filler PLC; the stop reason the operator gives at the machine | Waits coded as other stops |
| Planned batch releases and the SKU sequence | ERP, APS or the planning spreadsheet | Plan times are targets, not measurements |
Use one clock. If the PLC, the batch system and the LIMS disagree, the gaps between them turn into false waits, so check the offset on an event all three record, such as the sample being taken.
Batch cycle time calculation: one batch by hand, then the week
Sample figures for illustration only. A chilled sauce plant makes cheese sauce for foodservice in 2 kg pouches. Kettle K2 is a 1,500 kg steam-jacketed kettle with a scraped-surface agitator, the only one in the kitchen that can cook the roux-based recipes. Each batch is discharged to a buffer tank in front of one pouch filler, 750 pouches a batch at an ideal 25 pouches a minute. The kitchen runs three 8-hour shifts, five days a week, 48 weeks a year.
Step 1: one batch by hand. The batch system's export for batch CS-0417, a rinse batch with no shift handover, gives these events. Each duration is the time since the event before it:
| Event | Clock time | Phase or wait ending | Minutes |
|---|---|---|---|
| Charge start | 06:00 | Batch starts | |
| Charge end | 06:23 | Charge | 23 |
| Heat end | 06:52 | Heat | 29 |
| Hold end, sample taken | 07:02 | Hold | 10 |
| QA release | 07:19 | Wait: sample to release | 17 |
| Discharge start | 07:31 | Wait: buffer tank still full | 12 |
| Discharge end | 07:57 | Discharge | 26 |
| Rinse end, kettle ready | 08:09 | Rinse | 12 |
| Next charge start | 08:27 | Wait: operator and kit | 18 |
| Start to start | 06:00 to 08:27 | Whole batch | 147 |
Durations are end minus start, and a wait is the gap between one end and the next start. Against a recipe time of 89 minutes for a rinse batch (charge 20, heat 25, hold 10, discharge 22, rinse 12), CS-0417 took 147 minutes, 58 over. 47 of those minutes are three waits: the sample to release, the buffer tank still full, and the operator and the kit for the next charge.
That batch looks almost healthy. It is also the wrong batch to judge by, because it missed the two things that take the largest blocks of K2's day: a full CIP and a shift handover.
Step 2: the week. Run the same pairing for all 40 batches of the study week and take the mean of each row. Means add up, and they also reconcile with the clock: 1,440 staffed minutes a day / 8 batches = 180 minutes, the same as the sum of the rows. Medians do not add, so keep them for spotting unstable rows, not for capacity.
| Row | Planned, min a batch | Measured mean, min a batch | Hours a day at 8 batches | Owner |
|---|---|---|---|---|
| Charge: milk, cream, cheese, roux base | 20 | 22 | 2.9 | Production; the weigh room for the kit |
| Heat to cook temperature | 25 | 28 | 3.7 | Engineering for the steam supply; the process owner for setpoints |
| Hold at cook temperature | 10 | 10 | 1.3 | Process authority and QA |
| Wait: QA sample to release | 8 | 18 | 2.4 | QA lab |
| Discharge to the filler buffer tank | 22 | 25 | 3.3 | Production and engineering |
| Wait: filler buffer tank still full | 0 | 11 | 1.5 | Shift lead; the planner for the SKU sequence |
| Clean: rinse, or CIP at a recipe change | 18 | 27.75 | 3.7 | QA for validated cycles; sanitation team |
| Wait: weighed ingredients not staged | 0 | 9 | 1.2 | Weigh room lead |
| Wait: no operator at the kettle | 0 | 18 | 2.4 | Production manager (crew plan) |
| Wait: kettle clean, no batch released | 0 | 11.25 | 1.5 | Planner (ERP or planning spreadsheet) |
| Start to start | 103 | 180 | 24.0 | Plant or production manager |
The plan in the spreadsheet carries 103 minutes a batch. The kettle runs at 180. Five of the ten rows are planned at zero, and together they take a mean 67.25 minutes a batch. Clean is planned at 18 minutes and averages 27.75, because the day holds 6 rinses of 12 minutes and 2 full CIPs of 75 minutes: one at the change from the blue cheese recipe, one at the end of the day.
Batch cycle time analysis: where the 24 hours of a batch day go
Multiply each row by the 8 batches and the ledger of K2's day comes out in hours. This is the view a production meeting rarely sees, because each report it reads covers one slice: the recipe report shows the phases, QA shows release times, the filler's report shows its own stops.
Three readings from the ledger:
- Making sauce takes 11.3 hours of 24. Charge, heat, hold and discharge, 47.2% of the day. Every cut to the recipe phases works on that share only.
- Waiting takes 9.0 hours. 37.4% of the day, spread over five causes with five different owners. QA release and the missing operator take 2.4 hours each.
- Cleaning takes 3.7 hours. Two full CIPs alone take 150 minutes, more than the six rinses together.
Two rows belong to people away from the kettle. At the three shift handovers and at breaks nobody covers K2, and a clean kettle waits for the incoming shift: a crew plan question for the production manager. The no-batch row is the planner's: on 1.5 hours a day the kettle was clean and ready, but the plan in the ERP had not released the next batch to the weigh room in time.
Before cutting anything, check that a saved minute on K2 can be sold. Three checks on the same week: K2 had a batch in it, or was cleaning or waiting for one, for all of its staffed hours; the sauce order book was short by 10 batches a week over the last eight weeks; and the filler's ideal fill time was 30 minutes a batch, so even at the base case below it would fill for 19.9% of the kitchen's staffed minutes. K2 is the constraint for the sauce family. The difference between the slowest machine and the one that limits sales is set out in bottleneck vs constraint.
What stays fixed: the hold, the cooling and the CIP contact time
Three parts of the batch cycle belong to food safety and validation, not to production, and a reduction plan writes them down before it starts.
The hold. The hold at cook temperature is in the recipe because the process authority put it there. It changes only through a new, validated process, and the ledger above treats its 10 minutes as fixed.
The cooling. Regulation (EC) No 852/2004 on the hygiene of foodstuffs, Annex II, Chapter IX, point 6, requires that foodstuffs to be held or served at chilled temperatures are cooled as quickly as possible after the heat-processing stage, to a temperature that does not result in a risk to health. A faster discharge that sends sauce to the buffer tank warmer is not a saving. The discharge cut below comes from staging and pump set-up inside the limits the process owner sets, not from less cooling.
The CIP contact time. The Oklahoma State University extension fact sheet on clean-in-place (FAPC-251, August 2023) defines cleaning cycle time as the time cleaning solutions are in contact with the surfaces being cleaned while the required conditions, temperature, flow, pressure and concentration, are met. It adds that cycle times are experimentally determined and depend on factors that include line availability, meaning production and labor factors. That is the insider point: the wash is a validated result, but the number of CIPs a day and the waits around them are production decisions. It also says cleaners or sanitizers should be rinsed from stainless steel after no more than 20 minutes of contact, so a step is not stretched by hand either. Whether CIP time counts as planned time or an availability loss in OEE is covered in OEE for batch processes.
So the cut on K2's clean row does not touch the cycle. It changes the sequence: the blue cheese recipe moves to the end of the day, where the end-of-day CIP already runs, and one full CIP a day becomes a rinse. A 75-minute CIP becomes a 12-minute rinse, 63 minutes a day. The sequence change still needs QA to confirm that a rinse is enough between the recipes that now follow each other, so QA owns the decision and the validated cycle itself stays as it is.
Batch cycle time reduction: which step to cut first, priced
Each row of the ledger gets a target from the study: what the row could be if its fix landed in full. The base case then assumes each fix delivers half of that, because planned cuts rarely land in full and a business case built on full delivery is a case the plant will miss. The value of a cut is the extra whole batches a year it allows, at 240 production days of 1,440 minutes, times the margin of a batch.
The margin: a batch of 1,500 kg at a sample ex-works price of EUR 3.60 a kg is EUR 5,400 of sales. The NYU Stern margins by industry dataset (Aswath Damodaran, data as of January 2026) gives a gross margin of 23.23% for Food Processing, 78 U.S. firms. EUR 5,400 x 23.23% = EUR 1,254.42 a batch. Use your own SKU margin when you have it.
Effort is in person-days of 7.5 hours, priced at the Eurostat 2025 hourly labour cost figures, which put industry in the euro area at EUR 40.3 an hour: EUR 302.25 a person-day. Parts, trials and lost output during trials come on top.
| Rank | Cut | Min a batch, today to full target | Saved at half delivery, min a batch | Batches a year, alone | Margin a year, alone | Effort, person-days (estimate) | Owner |
|---|---|---|---|---|---|---|---|
| 1 | Cover handovers and breaks at the kettle | 18 to 6 | 6 | +66 | EUR 82,792 | 2 to 4: EUR 604.50 to EUR 1,209.00 | Production manager (crew plan) |
| 2 | Release the next batch before the clean ends | 11.25 to 3.75 | 3.75 | +40 | EUR 50,177 | 1 to 3: EUR 302.25 to EUR 906.75 | Planner (ERP or planning spreadsheet) |
| 3 | Stage the weighed kit before the clean ends | 9 to 2 | 3.5 | +38 | EUR 47,668 | 2 to 4: EUR 604.50 to EUR 1,209.00 | Weigh room lead |
| 4 | Sample at the end of the hold; lab runs kettle samples first | 18 to 10 | 4 | +43 | EUR 53,940 | 3 to 6: EUR 906.75 to EUR 1,813.50 | QA lab |
| 5 | Keep filler SKU changes off K2 discharge times | 11 to 3 | 4 | +43 | EUR 53,940 | 3 to 8: EUR 906.75 to EUR 2,418.00 | Shift lead; the planner for the SKU sequence |
| 6 | Sequence recipes so one full CIP a day becomes a rinse | 27.75 to 19.875 | 3.938 | +42 | EUR 52,686 | 4 to 10: EUR 1,209.00 to EUR 3,022.50 | QA for validated cycles; sanitation team |
| 7 | Pump set-up done during the hold | 25 to 22 | 1.5 | +16 | EUR 20,071 | 2 to 4: EUR 604.50 to EUR 1,209.00 | Production and engineering |
| 8 | Pre-melt and stage the cheese | 22 to 20 | 1 | +10 | EUR 12,544 | 1 to 4: EUR 302.25 to EUR 1,209.00 | Production; the weigh room for the kit |
| 9 | Steam supply back to design pressure | 28 to 25 | 1.5 | +16 | EUR 20,071 | 5 to 15: EUR 1,511.25 to EUR 4,533.75 | Engineering for the steam supply; the process owner for setpoints |
| Not cut: the hold at cook temperature | 10 to 10 | 0 | 0 | EUR 0 | Only a new, validated process | Process authority and QA |
The rank is margin a year per euro of effort, each cut priced alone. Five waits come first, and the operator wait leads because it is the largest row that one manager can change with a crew plan. The steam supply comes last: 16 batches a year for 5 to 15 person-days plus parts. Priced alone, the nine cuts add up to 314 batches; made together they give 371, because each cut shortens a cycle that the others have already shortened. Price the plan as a whole, not as a sum of single cuts.
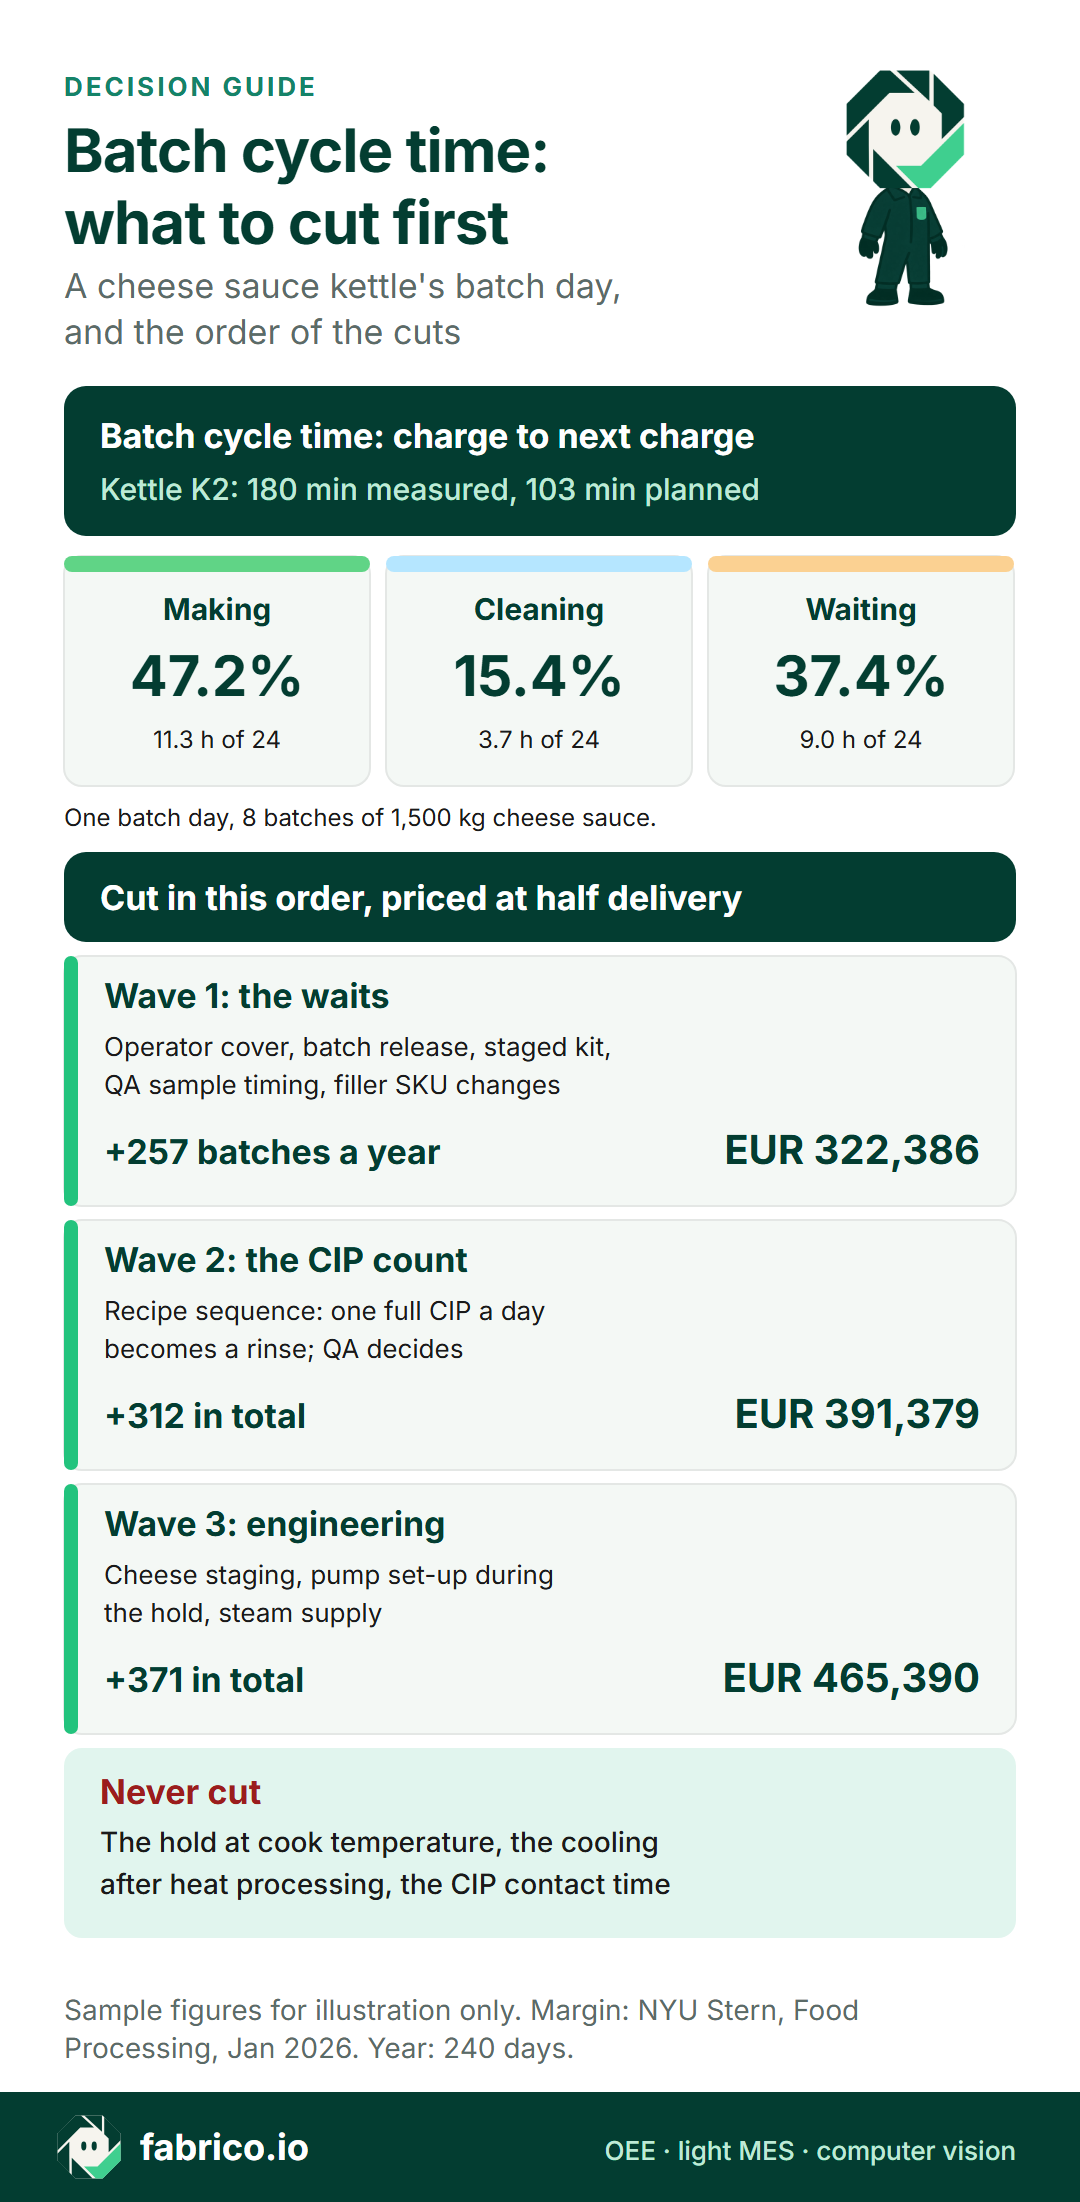
Text version of this infographic
- Batch cycle time on K2: mean 180 minutes start to start against 103 planned; 8 batches a day.
- Wave 1, waits: operator cover, batch release, staged kit, QA sample timing, filler SKU changes. Half delivery: +257 batches a year, EUR 322,386.
- Wave 2, CIP count: one full CIP a day becomes a rinse, QA decides. Total +312 batches a year.
- Wave 3, engineering: cheese staging, pump set-up, steam supply. Total +371 batches a year, EUR 465,390.
- Fixed: the hold at cook temperature, the cooling after heat processing, the validated CIP contact time.
- Sample figures. Margin: NYU Stern, Food Processing, January 2026. Effort: Eurostat 2025, euro area industry.
Worked example in money: three waves, half delivery as the base case
Grouped by who can act and what each change needs to prove, the cuts fall into three waves:
- Wave 1, the waits. No recipe change and no validation. Full target 42.5 minutes a batch, half delivery 21.25. The mean falls from 180 to 158.75 minutes, and 345,600 / 158.75 gives 2,177 whole batches a year, 257 more: EUR 322,385.94 a year. The effort is 11 to 25 person-days, EUR 3,324.75 to EUR 7,556.25.
- Wave 2, the CIP count. A sequence change that QA signs off. Full target 7.875 minutes a batch, half delivery 3.9375. Mean 154.8125, 2,232 batches a year, 312 more than today.
- Wave 3, engineering. Cheese staging, pump set-up during the hold and the steam supply. Full target 8 minutes a batch, half delivery 4. Mean 150.8125, 2,291 batches a year, 371 more than today.
| Case | Share of planned savings delivered | Mean batch cycle time, min | Extra batches a year | Sold (order book short by 480 a year) | Margin a year |
|---|---|---|---|---|---|
| Low | 25% | 165.41 | 169 | 169 | EUR 211,996.98 |
| Base | 50% | 150.81 | 371 | 371 | EUR 465,389.82 |
| High | 100% | 121.63 | 921 | 480 | EUR 602,121.60 |
The base case, 371 extra batches a year, about 7.7 a week, sits inside the order book's gap of 10 a week, so every batch has a buyer: EUR 465,389.82 a year. The high case runs into the order book. Full delivery would allow 921 extra batches, but only 480 would sell, so it is worth EUR 602,121.60; the rest is kettle time with no sauce to make, worth only the hours it lets the plant stop paying, and only if the crew plan changes to bank them.
Gross margin is sales less the cost of goods sold, and that cost still carries a share of the plant's fixed costs, so it understates what one more batch of a sold-out sauce adds. That keeps the base case on the safe side. The other honest limits: the figures assume 48 production weeks of the same mix, and they are planned effects until four weeks of new timestamps confirm them in the same ledger.
Two more points from the same West Virginia University module. For a given final temperature, the heat transfer area and the heating time are inversely related, so a kettle's heat-up is set by its jacket and its steam, which is why the steam cut is small and comes last. And intermediate storage helps reduce bottlenecks and can decrease the cycle time. K2's buffer-tank wait is that effect in reverse: one tank, held full by a filler SKU change. Wave 1 moves the SKU change; a second tank is the capital option if the rule does not hold.
How to get the numbers: five routes compared
The ledger needs a week of phase times and the reasons behind the waits. There are five ways to get them. Plant time is priced at EUR 40.3 an hour; software and consultants are priced only from the quotes they give, so ask each vendor for a price per line per month and each consultant for a fixed quote.
| Route | Hours of plant time | Cost range | Accuracy, and what it misses | When it is enough |
|---|---|---|---|---|
| Stopwatch at the kettle | 24 to 40 hours of an engineer for 10 to 15 batches | EUR 967.20 to EUR 1,612.00 | Exact for the batches watched; misses nights, CIP days and handovers unless someone is there | A first look at one phase, such as the QA release |
| Batch sheets typed into a spreadsheet | 16 to 24 hours for a month of sheets | EUR 644.80 to EUR 967.20 | Times written by hand and rounded; waits are rarely written down at all | Kettles with no PLC step log and a disciplined shift team |
| Export from the batch system or the PLC step log | 12 to 30 hours of an engineer to set up the export and the pairing | EUR 483.60 to EUR 1,209.00 | Phase times to the second; no reason for a wait, and nothing from the filler | A one-off ledger like the one above |
| Line software: OEE or light MES on the filler and kettle | Connection and set-up time: ask each vendor | Ask each vendor for a price per line per month | Continuous, with stop reasons given at the machine and losses priced from SKU margin; the recipe phase detail stays in the batch system | When the ledger has to be kept, not built once, and the waits need owners every shift |
| Consultant or integrator study | 2 to 4 days of the plant team's time beside the study | Ask for a fixed quote | As good as the data they can reach; ends when the engagement ends | No engineer free, or a capital decision such as a second buffer tank |
Who should pick which. A plant with a batch system and one free engineer should start with the export: it builds the first ledger for the price of a few days. A plant on paper sheets should run a stopwatch week on the constraint kettle before it types up a month of sheets, because the sheets will not hold the waits. A plant whose waits sit between the kettle and the filler, where nobody owns them, needs the filler measured every shift, which is where line software earns its keep. Bring in a consultant when the question is capital, not habits.
Five questions to ask any vendor of line software:
- Can a vessel's time be shown charge to next charge, with the gaps between phases as named waits rather than run time?
- Can the operator give a reason for a wait at the kettle or the filler, and does time with no reason stay visible as unclassified?
- Can the filler's waiting-for-product time be shown by shift next to the kettle that fed it?
- Can losses be priced from each SKU's selling price and margin?
- Can a week of kettle and filler data be exported to Excel and joined with the batch system's phase log?
A five-day batch cycle time study on the constraint kettle
The ledger above takes one week to build and one meeting to act on. A plan for the week:
- Monday: name the kettle, and check that its product sells out and that the filler has spare hours. Ask QA and the process authority to write down what is fixed: the hold, the cooling and each validated CIP cycle.
- Tuesday: export one week of phase starts and ends with batch IDs. Check the clock offset between the batch system, the LIMS and the filler on the sample-taken event.
- Wednesday: pair the events, split clean into rinses and full CIPs, and build the ledger in hours of the day. Mark every row the plan carries at zero.
- Thursday: give each row an owner and a full target, then price each cut at half delivery with your own SKU margin.
- Friday: agree wave 1 with the production manager, the shift leads, QA and the planner, and set the date four weeks out when the same ledger is built again.
The re-measure matters more than the first ledger. A wait that comes back after a month belongs to a habit or a plan that did not change, and the second ledger shows which one.
If one product family runs in volume all week, the bigger question may be the process itself: continuous vs batch production covers that choice. The per-unit measure for discrete lines is in cycle time in manufacturing; this page stays with the batch.
Where Fabrico fits
Fabrico is OEE and light MES software for the plant floor, with computer vision as an add-on. On a kettle line it sits beside the batch system: recipes, phase logic and hold times stay in the batch system and the PLC, under the process owner and QA.
- Run time, stops and counts come from the machine's PLC or an IoT device with sensors on the machines you connect, such as the filler and, where a signal exists, the kettle.
- Operators give the stop reason at the machine, so a filler waiting for K2 reads as waiting for product, not as unclassified time.
- Real-time OEE (availability x performance x quality) per line and shift, on a live dashboard on a floor screen or tablet.
- With the selling price and margin of each SKU entered, losses are priced in money, so the filler's waits show in euros next to their hours.
- On a station with no usable signal, such as packing pouches into cases by hand, the camera add-on counts output. Where the camera add-on covers a station, the video for the minute of a stop can be opened from the shift timeline, streamed on request and not stored in Fabrico.
- Reports export to Excel, and Fabrico also has a REST API and webhooks.
The plan and the kettle sequence live in the ERP, APS or planning spreadsheet; Fabrico supplies the measured rates the plan is checked against. For the wider software picture in a food plant, see food manufacturing software, and the screens are in the MES and OEE solution overview.
Sources, accessed 18.11.2026: Turton and Shaeiwitz, ASEE 2010; ISA, ISA-88 standards; IEC webstore, IEC 61512-1; Regulation (EC) No 852/2004, Annex II; Oklahoma State University, FAPC-251, August 2023; NYU Stern margins by sector, January 2026; Eurostat hourly labour costs 2025.
Questions about batch cycle time
What is batch cycle time?
The time one vessel takes from the start of charging a batch to the start of charging the next one: charge, heat or mix, hold, discharge, clean, and the waits between them. In a plant with several vessels in a chain, the term also means the interval at which batches can be repeated, which the slowest piece of equipment sets.
What is the batch cycle time formula?
Batch cycle time = charge + heat + hold + discharge + clean + waits, measured start to start on one vessel. Batches a day = minutes the vessel is staffed divided by the mean batch cycle time.
How do you calculate batch cycle time from batch system or PLC data?
Export one week of phase start and end times with batch IDs from the batch system, or the sequence step changes from the PLC historian. Subtract start from end for each phase, count each gap between one end and the next start as a wait, then take the mean of each row and add the means.
What is a batch cycle time analysis?
A ledger of one vessel's day: every phase, clean and wait, with its planned and measured minutes, its share of the day and its owner. It shows where the hours go and who can act on each row.
How do you reduce batch cycle time without changing the recipe?
Cut the waits first: operator cover, batch release, staged ingredients, QA sample timing and the filler. Then reduce the number of full CIPs through the recipe sequence. Heating and transfers come last, and the hold and the cooling stay with the process owner and QA.
Why price a batch cycle time reduction at half delivery?
Planned cuts rarely land in full. Pricing the base case at half of each planned saving, with the full saving as the high case, keeps the number defensible until four weeks of new timestamps confirm it.
Does CIP count in batch cycle time?
Yes. Start to start includes every rinse and CIP before the next charge. Split rinses from full CIPs: the number of CIPs moves with the recipe sequence, the validated contact time of each one does not.
Want to see a filler's waiting-for-product time by shift, priced from SKU margins? Book a demo.
Related articles








Real Fabrico tiles, sample data.