


 Login
 Blog
Canary vs Ignition Historian: Storage, Trends and Scale Compared

In short: Canary historian vs Ignition historian is a choice between a dedicated time-series historian and history modules inside a SCADA platform. Canary Labs stores tags in its own NoSQL database with lossless compression; Ignition writes tag history to its QuestDB-based Core Historian or to an SQL database you run. Both store values when they change past a deadband, which is where counting errors start.
- Canary collects over OPC DA, OPC UA, MQTT Sparkplug B, SQL and CSV, and names Ignition gateways as a source.
- Ignition history is set per tag: provider, sample mode, deadband style and deadband.
- A wide deadband on a resetting counter undercounts good units; the worked example loses 13,440 caps in one shift.
- Every vendor fact is linked to the Canary Labs or Inductive Automation page it came from, read on 13.11.2026.
Key takeaways
- Canary runs as a historian of its own, fed by collectors; Ignition keeps history in whichever provider each tag points to.
- Plenty of plants run the two together, since Canary's collector page names Ignition gateways as a source.
- Whether the shift count is right depends on one setting in either product: the deadband on the counter tag.
- In the sample shift below, a 300 cap deadband hides 13,440 good caps, EUR 67.20 a shift or EUR 40,320 a year at a sample margin.
- A fair test for both: one resetting counter, logged for a week, checked against boxes counted at the palletiser.
The controls engineer wants a dedicated historian; the SCADA team says Ignition already keeps history. Both can be right. Below, the two side by side, then one counter tag followed from the PLC to a shift OEE figure.
Canary vs Ignition historian at a glance
Each cell comes from the vendor's own pages, read on 13.11.2026 and linked in the sections below.
| Job | Canary historian | Ignition historian |
|---|---|---|
| What it is | A NoSQL time-series historian | History modules on an Ignition gateway |
| Storage | Own store, lossless compression | Core Historian (QuestDB) or an SQL database |
| Logging rule | Collector deadband, absolute or percent | Historical deadband, absolute or percent |
| Data in | OPC DA, OPC UA, MQTT Sparkplug B, SQL, CSV | Gateway tags: OPC address, expression, SQL query |
| Reading back | Axiom in a browser, SQL, Excel Add-in | Power Charts, Tag History bindings, scripting |
| Many sites | Site and corporate historians, Store & Forward | Remote Historian over the Gateway Network |
| Derived values | Calculation Server, Events | Native aggregation, partner OEE module |
What Canary offers, per canarylabs.com
Canary Labs sums it up on its home page, as of 13.11.2026: "Collect data from all of your devices and store it with lossless compression."
- The store. Per the historian page, Canary "chooses not to use SQL" and runs a NoSQL time-series database. "A single Canary Historian can hold up to two million tags", and users "can still query the data using standard SQL".
- Collectors. The data collectors page lists OPC DA, OPC UA, MQTT Sparkplug B, Ignition and other SCADA systems, SQL databases, CSV files and manual entry.
- Logging rule. In the OPC UA collector guide for version 24, an absolute deadband means a value "must differ from the previously logged value by more than the specified amount".
- Tools. Store & Forward buffers to local disk when the link drops. Virtual Views build asset models "without impacting the archived data". Axiom trends need "a modern web browser". The Calculation Server builds calculated tags that can be "back-filled historically".
What Ignition offers, per Inductive Automation
In Ignition, history is a module on the gateway. The 8.1 manual's tags page says "The Tag Historian Module makes it easier than ever to store and use historical data." In 8.3 the historian modules page splits the job in two, as of 13.11.2026:
- Historian Core. It holds the Core Historian, "Backed by QuestDB", which questdb.com calls "the open time-series database for the most demanding workloads".
- SQL Historian. It "automatically supports compression, partitioning, interpolation, and aggregation for any SQL database".
- More providers. The history providers page adds a Remote Historian, a CSV Historian, an OPC HDA Historian and a Splitter that "writes tag history to two configured providers simultaneously".
- Per-tag settings. On the tag properties page, each tag gets a provider, a sample mode, a deadband style (Auto, Analog or Discrete) and a historical deadband, absolute or "a percent of the tag's engineering unit span".
Canary vs Ignition historian, job by job
Storing tag history. Canary is a historian you run as its own system, fed by collectors. Ignition stores history wherever each tag's provider points: the Core Historian on the gateway, or an SQL Historian writing to "MySQL, SQL Server, or PostgreSQL". Who will back up and patch that store is the first practical question.
Compression and storage approach. Canary states lossless compression in a NoSQL store. Ignition's configuring tag history page gives two deadband styles. Discrete stores a value once the change from the last stored value reaches the deadband. Analog uses "a modified version of the 'Sliding Window' algorithm" and interpolates between stored points. The Core Historian page adds partitions by week, month or year, deduplication, archiving and pruning of old partitions.
Retrieval and trends. Canary history is read in Axiom, which can "Create time buckets of aggregated data values", or through SQL and an Excel Add-in. Ignition history is read in Power Charts, Tag History bindings and the system.historian.queryRawPoints() call named in the historian guide. Discrete values are "not interpolated", which suits counts and states.
Scale across sites. Canary sends data from a site historian to a corporate one through Store & Forward, and its enterprise historian can be hosted "in your own data centers or in the cloud". Ignition's guide advises keeping "site data at each site", while "you can always access site historian data from the central system" through the Remote Historian.
How each connects. Canary reaches out to sources, and its Sparkplug B connector "will auto-discover any new tags" on subscribed topics. Sparkplug is an MQTT specification whose working group, per sparkplug.eclipse.org, "ensures open and interoperable IIoT". Ignition historises tags its gateway already reads, from "an OPC address, an expression, or a SQL query". OPC UA, which the OPC Foundation calls "a platform independent service-oriented architecture", is common ground. More on protocols in OPC UA vs MQTT, and on drivers in Ignition vs Kepware.
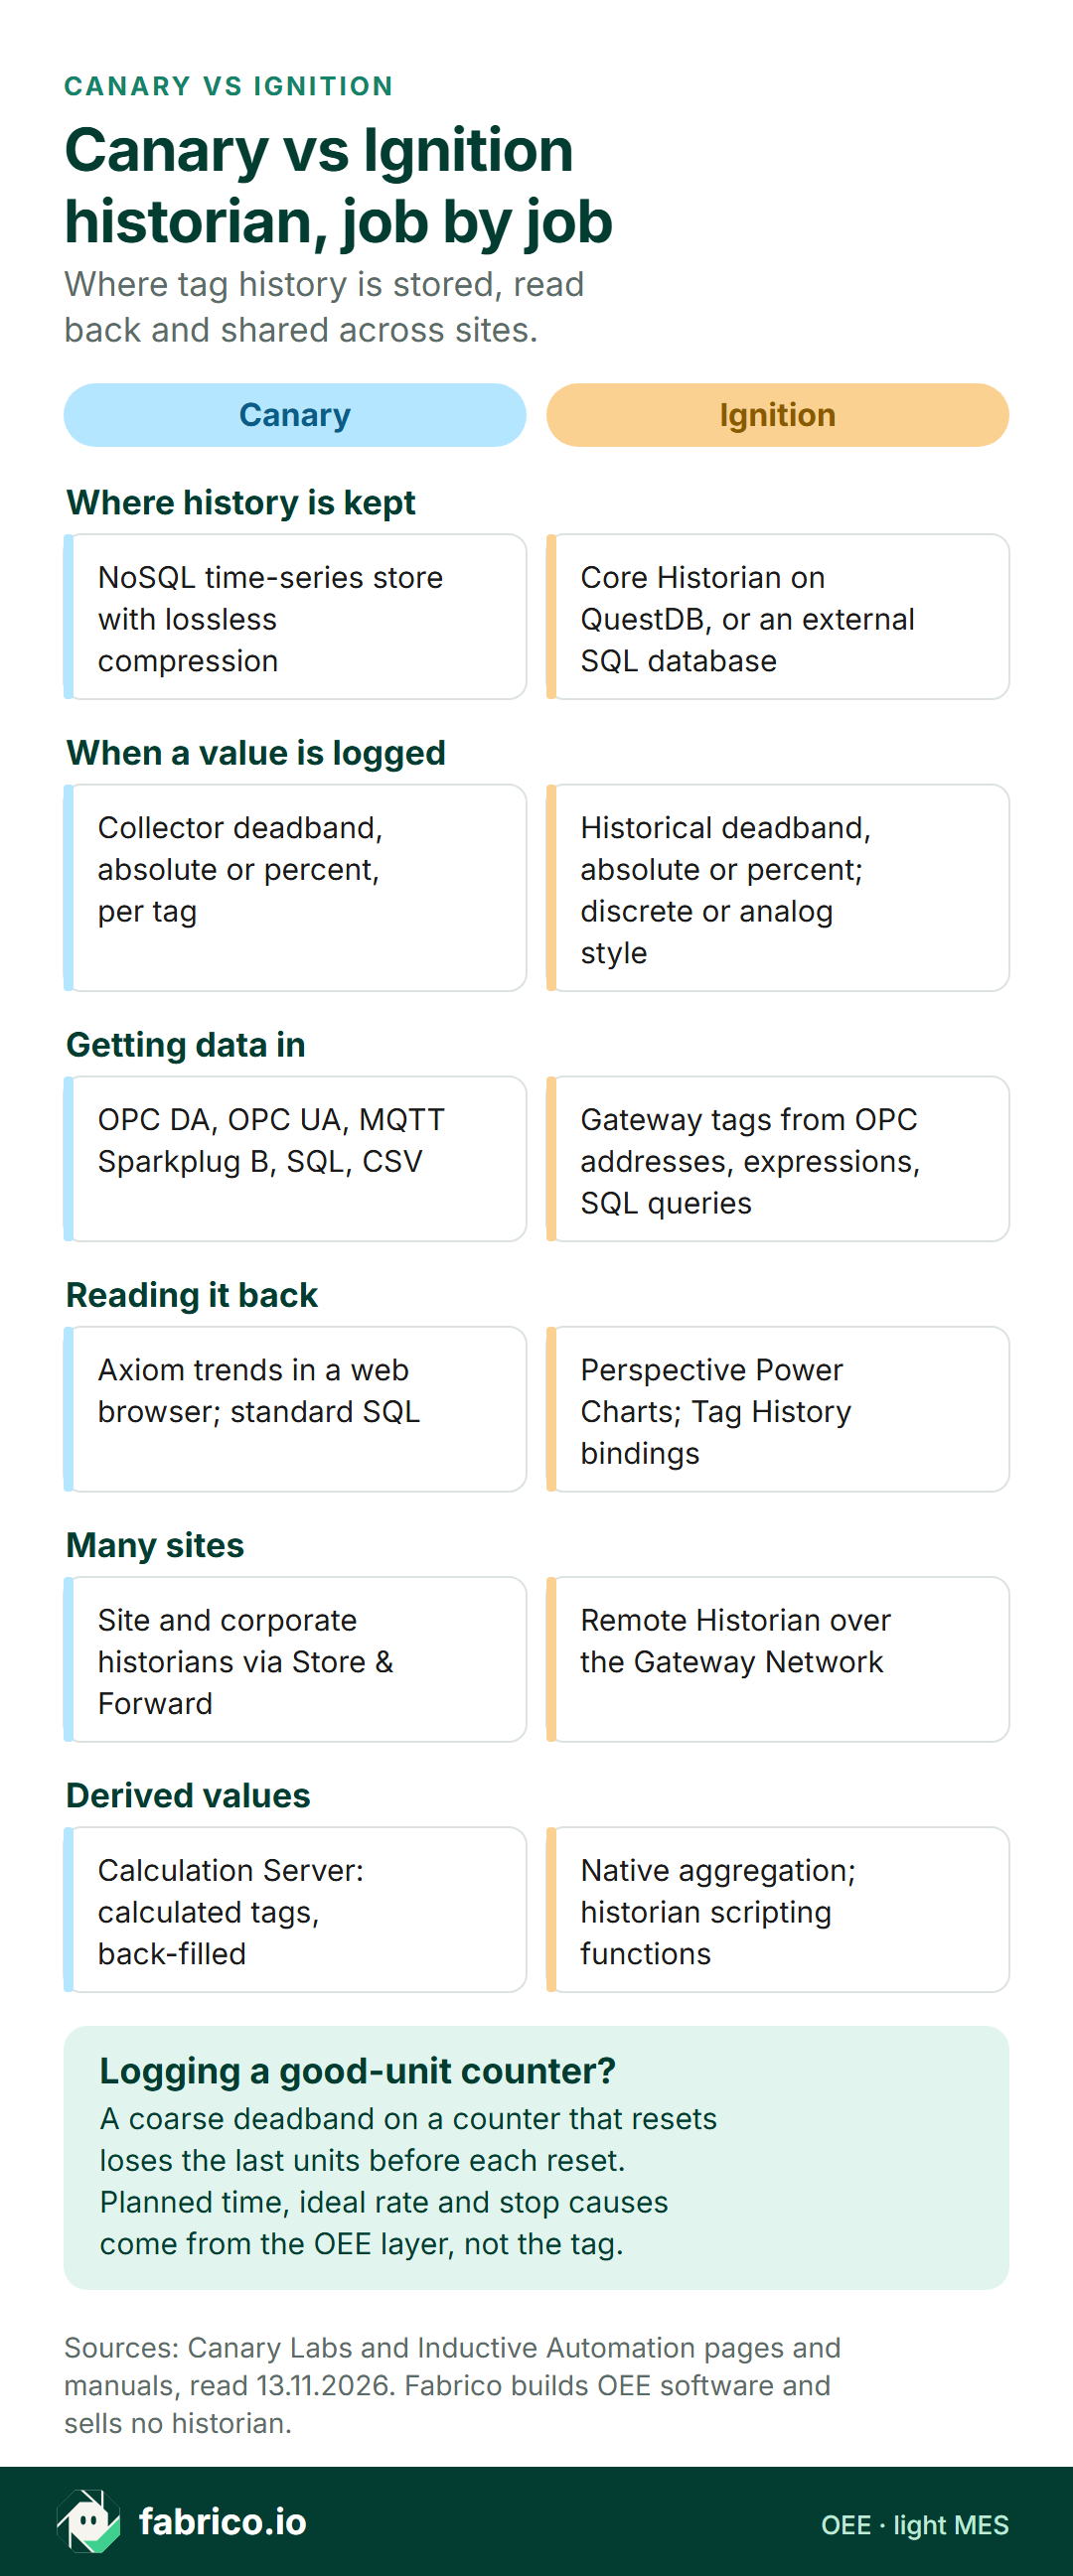
Text version of this infographic
- Canary vs Ignition historian, job by job: where tag history is stored, read back and shared across sites.
- Where history is kept. Canary: NoSQL time-series store with lossless compression. Ignition: Core Historian on QuestDB, or an external SQL database.
- When a value is logged. Canary: collector deadband, absolute or percent, per tag. Ignition: historical deadband, absolute or percent; discrete or analog style.
- Getting data in. Canary: OPC DA, OPC UA, MQTT Sparkplug B, SQL, CSV. Ignition: gateway tags from OPC addresses, expressions, SQL queries.
- Reading it back. Canary: Axiom trends in a web browser; standard SQL. Ignition: Perspective Power Charts; Tag History bindings.
- Many sites. Canary: site and corporate historians via Store & Forward. Ignition: Remote Historian over the Gateway Network.
- Derived values. Canary: Calculation Server, calculated tags, back-filled. Ignition: native aggregation; historian scripting functions.
- Logging a good-unit counter? A coarse deadband on a counter that resets loses the last units before each reset. Planned time, ideal rate and stop causes come from the OEE layer, not the tag.
- Sources: Canary Labs and Inductive Automation pages and manuals, read 13.11.2026. Fabrico builds OEE software and sells no historian.
Match the first job
Which row is due soonest? Many plants need two.
| First job | Look at first |
|---|---|
| A historian kept as its own system, fed by several SCADA and OPC sources | Canary |
| History for tags that already sit on an Ignition gateway | Ignition's Core Historian or SQL Historian |
| History in a SQL database your IT team already runs | Ignition's SQL Historian |
| One history store under Ignition screens and other sources | Ignition for screens, Canary collecting from its gateway |
| OEE per line with operator stop reasons | An OEE system reading tags from either historian |
The basics of what any historian is for sit in our manufacturing data historian guide.
Where OEE and stop causes fit
A historian keeps values against time. OEE is availability times performance times quality, and three of its inputs are not tag values: planned production time, the ideal rate of the product running, and why the line was down. The PLC knows the press stopped; the setter knows the dryer alarmed.
Around Canary, the Events page lists "Batches, downtime, and shifts", built from rules on calculated tags. Around Ignition, the Sepasoft partner page names an OEE Downtime Module for Ignition. With either, ask who enters reasons at the line, and where. Our Ignition OEE review and edge vs cloud shop floor data cover where the sums can run.
Where Fabrico fits for a historian buyer
Fabrico is not a historian, SCADA, HMI or connectivity software, so Canary or Ignition stays in place. Fabrico is a cloud OEE and light MES system; the solution overview shows the modules.
- From the machine: run state and counts from a PLC, sensor or counter. OPC UA and MQTT are named on the connectivity page.
- From the people: operators or setters tap why the press stopped, on a phone or tablet. Fabrico then shows OEE, downtime and losses, also in money, per line and shift, on web, iOS and Android.
- Manual stations: the camera add-on counts output only where no signal exists; a camera proposing the stop reason is on the Roadmap, and where a camera covers the line, the video for the minute of a stop is streamed on request and not stored in Fabrico. More in the FMCG computer vision hub.
- Back out: REST API, webhooks, and Excel or CSV files for anyone who wants OEE results beside their trends.
The historian keeps process history; one OEE system keeps the shift figure everyone quotes. Book a demo to see it.
Worked example: a 300 cap deadband on a cap press
Sample data for illustration only. A moulding press makes drinks caps with a 32-cavity mould on a 4.8 second cycle: an ideal rate of 400 caps a minute. A 12 hour shift (720 minutes) with two 30 minute breaks gives 660 planned minutes, or 264,000 caps at best. The PLC adds 32 to a good-cap counter per good shot and resets it when a box of 2,400 caps (75 shots) is full. The historian logs that counter with an absolute deadband of 300, and the shift report adds up each box. Canary logs a change of more than 300, Ignition's discrete style one of 300 or more; with steps of 32 both store the same points.
Stops. 84 minutes: colour change 34, dryer alarm 20, short stops 18, box changer jam 12. That leaves 576 running minutes: availability 576 / 660 = 87.27%, and an ideal of 576 x 400 = 230,400 caps.
What really happened. 6,400 shots made 204,800 caps. Start-up shots after colour changes, 100 in all, sent 3,200 caps to a reject counter logged on every change. Good output: 201,600 caps, exactly 84 boxes. Performance is 204,800 / 230,400 = 88.89%, quality 201,600 / 204,800 = 98.44%, OEE 87.27% x 88.89% x 98.44% = 76.36%, which matches 201,600 / 264,000.
What the historian logged. A point is stored every tenth shot: 320, 640 and up to 2,240. The last 5 shots of a box add 160 caps, under the deadband, and then the counter resets. In this sample setup each box logs 2,240, so the report shows 84 x 2,240 = 188,160 good caps, 13,440 short. Performance reads (188,160 good plus 3,200 rejects) 191,360 / 230,400 = 83.06%, quality 188,160 / 191,360 = 98.33%, and OEE 87.27% x 83.06% x 98.33% = 71.27%.
After tightening. With the counter deadband at zero, below one 32 cap step, every change is stored, each box logs 2,400, and OEE reads 76.36% again (OEE calculation). Keep counters at zero while analog tags keep their deadbands, and check the logged daily total against boxes counted at the palletiser. Availability never moved here, so the stop Pareto looked normal while performance took the blame. For cameras on moulding lines, see computer vision for plastics injection moulding.
What the press shift is worth in EUR
Sample margin, made up for this page: a contribution margin of EUR 0.005 per good cap, which only counts while the press is the bottleneck and every extra cap would sell. Assumed calendar: two 12 hour shifts a day, 25 days a month and 300 days a year, so 50 shifts a month and 600 a year.
| Loss on the sample shift | Caps | Shift, EUR | Month, EUR | Year, EUR |
|---|---|---|---|---|
| Stops, 84 minutes at 400 a minute | 33,600 | 168.00 | 8,400 | 100,800 |
| Slow running (performance) | 25,600 | 128.00 | 6,400 | 76,800 |
| Start-up rejects (quality) | 3,200 | 16.00 | 800 | 9,600 |
| Real loss, total | 62,400 | 312.00 | 15,600 | 187,200 |
| Made but not logged (deadband) | 13,440 | 67.20 | 3,360 | 40,320 |
The three loss rows add up to 264,000 minus 201,600 caps, so the table ties back to the OEE sum. The last row is different: those caps were moulded, boxed and sold, so the plant lost no money on them. The harm is in where attention goes. The report books them as slow running, so speed seems to cost EUR 195.20 a shift (39,040 caps) when the real figure is EUR 128.00, and the stops, the largest real loss at EUR 100,800 a year, look smaller next to it.
Chasing a loss that never happened costs time too. Eurostat estimates average hourly labour costs in 2025 at EUR 34.9 in the EU, with industry the highest paying sector at EUR 40.3 an hour in the euro area (accessed 14.11.2026). Two engineers spending a full day each on a phantom speed problem is 16 hours, about EUR 645 at that industry rate, before any trial runs on the press.
Failure modes that bend historian counts
The deadband is one way a stored counter drifts from the real output. These are the others worth testing on any historian, Canary or Ignition, before its numbers reach an OEE report.
| Failure mode | What the report shows | How to catch it |
|---|---|---|
| Deadband wider than one count step on a resetting counter | Good output short at every reset; performance takes the blame | Logged daily total against boxes or pallets counted |
| Counter stored on change only, then frozen during a long stop | No new point for an hour; a shift-end read returns the last stored value | Force a periodic store; Ignition's Max Time Between Samples forces a value after a set number of tag group executions |
| Analog style on an integer counter | Fractional counts read between stored points | Check the style is Discrete; per the same manual page, a discrete value "will not be interpolated" |
| Site link drops | A hole in the trend, then a late backfill; a report run before it is short | Re-run yesterday's report the morning after an outage and compare |
| PLC counter rolls over or is reset by hand mid-shift | A negative jump, or one far above the ideal rate | Flag any interval whose count is below zero or above ideal rate times minutes |
| PLC, gateway and historian clocks disagree | Units land in the wrong shift near the handover | Compare each clock with one reference once a day |
Decision matrix: Canary or Ignition historian for your plant
Find the row closest to your plant this year. Each row sends a job to the product whose own page covers it; the matrix does not score either one, and some rows name both. Vendor pages as of 14.11.2026.
| If this is you | Look first at | Why (vendor page) | Prove it in the pilot by |
|---|---|---|---|
| Tags come from several SCADA systems, OPC servers and CSV logs | Canary | Collectors for OPC DA, OPC UA, Sparkplug B, SQL and CSV | Pointing two current sources at one test historian and comparing a day |
| Years of SQL history must come across, not stay behind | Canary | The SQL collector can convert existing SQL historic databases | Converting one month of a real table and spot-checking ten timestamps |
| Every tag you need already sits on one Ignition gateway | Ignition | Core Historian that requires no configuration | Switching history on for one line and trending a week of it |
| IT wants history in a database it already backs up | Ignition | SQL Historian for any database with a JDBC driver | Restoring last night's backup and querying one shift from it |
| Site links to head office are weak | Both | Canary buffers to local disk; Ignition suggests site data at each site | Cutting one site link for an hour and checking the backfill |
| One central archive across many sites | Canary | Enterprise historian in your own data centers or the cloud | Sending two sites to one corporate historian and matching totals |
| Calculated rates must be rebuilt for past months | Canary | Calculated tags back-filled historically | Back-filling one month and checking it against the raw tags |
| Old and new stores must run side by side during a move | Ignition | Historian Splitter writes to two providers at once | Running both stores for a week and diffing a counter |
| Downtime events and shift durations built from tags | Both, plus an owner for reasons | Canary Event rules on calculated tags; Sepasoft OEE Downtime Module for Ignition | Logging one week of stops and checking it against the shift log |
Questions to ask both vendors
- How is a counter tag logged by default, and what deadband do you set on counts versus analog values?
- What happens to the last value before a counter resets, and can we prove it with a test tag?
- Where does history live, and who backs it up, patches it and prunes it?
- How do two sites send history to one central system, and what buffers it when the link drops?
- Can your historian take data from the other one, for example an Ignition gateway feeding Canary?
- Where are planned time, ideal rate and operator stop reasons entered, and who owns the official OEE figure?
What to do this week
Five steps a controls, CI or plant manager can finish before either vendor's first call:
- List the tags that make the OEE figure. Per line: good counter, reject counter, run state. Note each one's deadband, sample mode, style and whether the PLC resets it.
- Set counter deadbands below one count step on one line. Zero is fine for integers. Leave temperatures and pressures on their current deadbands.
- Run a five-day count check. Each shift, write the logged good total next to the boxes or pallets counted at the end of the line, and note the gap.
- Test an outage on purpose. In a quiet shift, cut one collector or gateway link for an hour, then check what arrives and when.
- Name the owners before a pilot. ISA-95 puts "the monitoring and supervising of physical processes" at Level 2 and MES at Level 3 (accessed 14.11.2026). The historian sits with Level 2 data; planned time, ideal rates and stop reasons need a named owner, whichever historian wins.
What people ask next
How does Canary store tag history compared with Ignition?
Canary keeps history in its own NoSQL time-series store and describes its compression as lossless. Ignition writes tag history to a history provider: the Core Historian, built on QuestDB, or an external SQL database through the SQL Historian.
Can Canary collect data from an Ignition gateway?
Yes, per Canary's data collectors page, which names Ignition SCADA among its sources and says Canary offers multiple options to collect data from an Ignition gateway. Check which option suits your gateway version.
What is a historical deadband and why does it matter for counters?
It is the change a value must make before the historian stores a new point. On a counter that resets, the units added after the last stored point and before the reset can go unlogged, so a coarse deadband undercounts good output.
Is a historian enough to calculate OEE?
A historian supplies run state, counts and rejects over time. The shift plan, each product's target speed and the operator's reason for a stop must be kept somewhere too, so ask where, whichever historian you pick.
Does Fabrico replace Canary or Ignition?
No. Fabrico is cloud OEE and light MES software that takes machine signals and operator stop reasons. It does not include historians or SCADA, so it sits beside either one.
Want OEE built on counts you can trust, with reasons from the line? Book a demo.
Related articles

Latest from our blog



Real Fabrico tiles, sample data.