


 Login
 Blog
Continuous Improvement Team Structure: Size the Team to the Money

In short: a continuous improvement team structure is a decision about three numbers: how many people, where they report, and what they are measured on. Whether the question is continuous improvement department structure, continuous improvement organizational structure or how to build a continuous improvement team from one hire, the answer comes from the losses the team has to recover, priced in money, not from an org chart copied from another plant.
- Four structures compete: CI inside operations, a plant CI lead with line champions, a central CI office, and a hybrid with group standards.
- Add a CI person while the next one still finds a multiple of their cost; in the sample box plant that is 1 to 3 engineers, 0.29% to 0.86% of the workforce.
- Judge the team on validated savings and OEE points held after 90 days, not on events run.
- The first hire spends the first month measuring, before running a project.
Every plant that starts a continuous improvement programme reaches the same meeting: how many people, reporting to whom, and judged on what. The answers in circulation are org charts and headcount rules of thumb. Neither says whether a second CI engineer will pay for themselves in this plant, on these lines, at this margin.
This guide works the decision for one sample plant: a 350-person corrugated board and box plant with one corrugator and six converting lines, choosing between one central CI engineer with line champions and a three-person CI office. It compares four structures, sizes the team from the value of an OEE point on each line, prices the team with Eurostat labour costs, lists the KPIs that judge the team itself, and ends with a 90-day plan for the first hire.
Four continuous improvement team structures, and what each gets wrong
Strip away the names and four structures remain. They differ in who does the improvement work, who owns the result, and what happens to the gains when the CI people move to the next line.
1. CI inside operations. No dedicated CI staff. Supervisors and shift leaders run improvement work beside their daily job. It costs the least and keeps ownership on the floor, but improvement loses every contest with a late truck or a breakdown. Projects start and then stall, and nobody measures whether a change held.
2. A plant CI lead with line champions. One dedicated person leads projects and trains, and one shift leader per line spends a slice of the week as the line's champion. This is the shape the Purdue Manufacturing Extension Partnership (Purdue University) describes in its Lean Six Sigma deployment series, part 1 (3 September 2025): champions in each functional area who support the effort and select projects, with green belts leading projects inside their own areas as part of their job and black belts working full-time across the organisation. The same article notes that larger organisations may dedicate full-time staff, while smaller ones give the roles to current employees as a development step.
3. A central CI office. Several dedicated people, sometimes called a kaizen or lean promotion office. The Lean Enterprise Institute lexicon entry for the lean promotion office defines it as a resource team for a lean transformation, drawn from groups such as industrial engineering, facilities and quality improvement, which helps value-stream managers with training, kaizen workshops and measuring progress. It adds a detail worth copying: the office can be staffed with employees freed up by the first improvements, which turns a productivity gain into capacity for the next project instead of a layoff. The risk is the one the EPA (United States Environmental Protection Agency) page on Six Sigma in its lean thinking and methods series (last updated 27 May 2026) records: some lean experts object that Six Sigma experts known as black belts can lead improvement without involving the workers the change affects, while lean practice treats employee involvement as critical. A strong central office can deliver a project the line never adopts.
4. Hybrid. A plant CI lead and line champions, as in structure 2, plus a share of a group operational excellence role that owns the definitions, the training standard and the cross-plant comparison. It only makes sense where there are two or more plants to compare.
Why the gains fade matters more than which box sits where on the chart. A field study by Glover, Farris and Van Aken of 65 kaizen events in eight manufacturing organisations (International Journal of Production Research, vol. 53, 2015) reports that full, lasting change from rapid improvement is the exception, and that the impact months later was linked to peer learning in the work area, awareness and responsibility, and how far the changes were accepted. Those are traits of the line team, not of the CI office. A structure without someone on each line who owns the change pays for its projects twice.
The sample plant: what an OEE point is worth on each converting line
Sample figures for illustration only. The plant employs 350 people and runs one corrugator feeding six converting lines: two flexo folder-gluers, two rotary die-cutters and two flatbed die-cutters. It works 3 shifts on 21 days a month, so 63 shifts a month and 12 x 63 = 756 a year, with 450 planned minutes a shift: 756 x 450 / 60 = 5,670 planned hours a line a year.
The anchor for what a CI project can deliver comes from a converting line. A 2026 master's dissertation at the University of Porto's Faculty of Engineering, Braga, a lean case study on a flatbed die-cutting press in a corrugated packaging plant (FEUP, June 2026), started from a baseline OEE of 35.4% on a die-cutter built in 1980, with availability at 57.8% and performance at 61.8%. 5S, a SMED-based changeover reduction, a downtime programme driven by a Pareto of stop categories and a run-speed study took OEE to 44.3%, a gain of 8.9 points, without capital spending. The target run speed in that study is 1,800 sheets an hour, which the sample uses as the ideal rate of its flatbed lines.
Insider fact: the same study left quality out of its analysis because there was no reliable measurement data for it. On converting lines the first job of a CI team is the measurement itself: a team that inherits OEE without trustworthy counts, reasons or rejects will spend its first months arguing about the baseline instead of moving it.
Margin comes from the NYU Stern margins by sector dataset (Aswath Damodaran, data as of January 2026), where 19 U.S. packaging and container firms show a gross margin of 24.27%. At a sample selling price of EUR 0.60 for one converted sheet, one or more boxes, the margin on an extra good sheet is EUR 0.60 x 24.27% = EUR 0.1456. One OEE point on a line is 1% of the ideal output in its planned hours: ideal sheets an hour x 5,670 hours x 0.01 x EUR 0.1456.
| Line type | Lines | Ideal sheets an hour | OEE today | Sheets in 1 OEE point a year | Margin of 1 point a year | One project at the base case |
|---|---|---|---|---|---|---|
| Flexo folder-gluer | 2 | 7,000 | 55% | 396,900 | EUR 57,797 | EUR 257,195 |
| Rotary die-cutter | 2 | 5,000 | 50% | 283,500 | EUR 41,283 | EUR 183,711 |
| Flatbed die-cutter | 2 | 1,800 | 40% | 102,060 | EUR 14,862 | EUR 66,136 |
The base case assumes a project delivers half the study's gain, 4.45 points, because the study's press started at 35.4% and these lines start higher, with less loss left to take. The low case takes a quarter, 2.225 points; the high case the full 8.9. The extra sheets count as margin because, in the study's words, converting plants work under pressure to maximise output for growing demand; a plant that cannot sell more sheets should read the hours view further down instead.
Sizing the team to the money: the value of the next CI person
Headcount follows from two numbers: what a dedicated CI person can recover in a year, and what that person costs. The sample assumes 2 line projects a year per dedicated person; the study ran from a January baseline to results in early June, a little under half a year for one press. Projects go to the lines ranked by what an OEE point is worth, so the first engineer takes the two flexo lines, the second the rotary die-cutters, the third the flatbed die-cutters.
What a CI engineer costs. The Eurostat structure of earnings survey, mean annual earnings by occupation (2022, enterprises with 10 or more employees) puts professionals in the EU at EUR 51,477 a year in gross earnings and technicians and associate professionals at EUR 43,974, against EUR 39,058 for all occupations. Employer costs come on top: Eurostat labour cost levels for manufacturing in the euro area, 2025 show EUR 40.8 an hour in total labour cost against EUR 30.3 in wages and salaries, a factor of 40.8 / 30.3 = 1.347. A CI engineer costs EUR 51,477 x 1.347 = EUR 69,316 a year and a technician-level champion EUR 59,213. The earnings are 2022 levels, the latest survey, so treat both as a floor and replace them with your own salary offer.
The rule. Add a person while the next one still finds at least 3 times their cost. The 3x hurdle is a sample, chosen to cover the CI person, the champions' time, and the share of results that will fade; set your own with finance before the first hire, not after.
| Added person | Lines | Low (2.225 pts) | Base (4.45 pts) | High (8.9 pts) |
|---|---|---|---|---|
| 1st CI engineer | Both flexo folder-gluers | EUR 257,195 (3.7x) | EUR 514,390 (7.4x) | EUR 1,028,779 (14.8x) |
| 2nd CI engineer | Both rotary die-cutters | EUR 183,711 (2.7x) | EUR 367,421 (5.3x) | EUR 734,842 (10.6x) |
| 3rd CI engineer | Both flatbed die-cutters | EUR 66,136 (1.0x) | EUR 132,272 (1.9x) | EUR 264,543 (3.8x) |
| Team size that clears 3x | 1 | 2 | 3 |
The table answers the meeting's first question. At half the study's gain the plant can carry 2 dedicated CI engineers; at a quarter of it, 1; only at the full gain does a third person clear the hurdle, finding EUR 264,543 against a cost of EUR 69,316. As a staffing ratio that is 0.29% of 350 people for one engineer, 0.57% for two and 0.86% for three. The ratio is an output of the loss arithmetic, not an input: a plant with the same headcount and a faster, higher-margin line mix would justify more people.
The hours view, when extra sheets do not sell. If the plant has spare capacity, a gain shows up as the same sheets made in fewer line hours. At the base case a flexo line at 55% OEE moving to 59.45% needs 5,670 x (1 minus 55 / 59.45) = 424 fewer hours a year. With a crew of 3 at the Eurostat EUR 40.8 an hour that is EUR 51,948 a line, and EUR 103,896 for the first engineer's two lines: 1.5x the engineer's cost, below the hurdle, and only real if shifts or overtime are actually cut. A box plant with spare capacity should point its first CI hire at what the hours view misses: board waste, trim and the changeovers that cap how many short runs fit in a week, not OEE points alone.
Continuous improvement team structure options: cost, output and who should pick which
The four structures, priced for the sample plant at the base case. Champions are 7 shift leaders, one per line including the corrugator, at 10% of their time; people are costed with the Eurostat figures above, and the value counts only the line projects the structure can run in a year.
| Structure | People and plant time | Cost a year | Projects and base value a year | What it misses | When it is enough |
|---|---|---|---|---|---|
| CI inside operations | 4 supervisors at 20% | EUR 47,370 | 1 project, EUR 257,195 (5.4x) | Projects lose to firefighting; nobody owns the method or the hold check | One or two lines, or a plant still fixing its data |
| Plant CI lead plus line champions | 1 CI engineer, 7 champions at 10% | EUR 110,764 | 2 projects, EUR 514,390 (4.6x) | Speed: one person, two lines a year | A single plant where one engineer clears the hurdle |
| Central CI office | 2 CI engineers, 1 technician | EUR 197,844 | 6 projects, EUR 1,014,082 (5.1x) | Line ownership; the last two projects find EUR 132,272, under 3x a person | A plant with a large, proven loss and champions already in place |
| Hybrid | Plant lead and champions, plus 0.25 of a group OpEx role | EUR 128,093 | 2 projects, EUR 514,390 (4.0x), plus shared definitions | Little, in one plant; the group share buys nothing there | Two or more plants comparing OEE |
On paper the central office returns 5.1x and looks best. The average hides the margin: its last two projects, on the flatbed die-cutters, find EUR 132,272, about 1.9x the cost of the person who runs them, and the office has no champions to hold the six changes after the engineers move on. The plant CI lead with champions returns less on paper and keeps the gains on the lines that produce them.
Who should pick which. A plant whose OEE data is not yet trusted, or that runs one or two lines, should start with CI inside operations and spend the first money on measurement. A single plant where the loss arithmetic carries one engineer should hire a plant CI lead and name a champion on every line in the same month. A plant with a large loss that has already proved one engineer's results for a year can grow toward a small office, adding one person at a time against the hurdle. A group with several plants should run the hybrid: plant leads do the projects, and a group role owns definitions and comparison.
Continuous improvement organizational structure: where the team reports
The reporting line decides which losses the team is allowed to chase. Three lines are in use, and each has a failure it invites.
- To the plant manager. The default for a single plant. The plant manager owns the lines, the crews and the budget the savings land in, so projects start fast. The failure: the CI lead gets pulled into this week's crisis, and project time becomes firefighting time. Protect it in writing, for example four days in five on chartered projects.
- To group operational excellence. Keeps definitions, training and project method identical across plants and makes comparisons fair. The failure: distance. A CI engineer judged from headquarters chases the group's metric, not the plant's biggest loss.
- Solid line to the plant, dotted line to the group. The hybrid. The plant manager sets the project list from the plant's priced losses; the group sets the method, the definitions and the hold check.
Two rules hold whatever the chart. Finance signs the savings: the CI team never marks its own homework, and the valuation method is agreed before a project starts. And production owns the change: each project closes with a named line champion who keeps the new standard, which is the role the Glover study points to.
The line data a CI team needs before its first project
A CI team without line data spends its first quarter collecting it by hand. Four views decide which project comes first and whether it worked:
- OEE by line and shift. Availability, performance and quality per line, split by shift, so a gap between crews is visible and a project's result can be compared like for like.
- Top stops. The ten reasons ranked by minutes, and the ten ranked by occurrences, over four weeks, with the share of stop time that still has no reason. That share is the first data-quality KPI.
- Changeovers as time loss. Each changeover inside planned time counts against availability, against a standard per product pair. In the Porto study the average setup moved from 24.0 to 22.8 minutes; the larger gains there came from downtime and speed, which only line data separates.
- Losses in money. Minutes become EUR with the selling price and margin per product, so the project list ranks by value. This is the input to the sizing test above.
With OEE software for continuous improvement managers, these views come from the machine signal and from the reason an operator gives on a tablet, so four weeks of tagged stops is a report rather than a project. The walkthrough below shows a shift timeline, stops waiting for a reason and the operator's line-down screen.
Demo data is synthetic. Book a demo.
Plays from YouTube. Google may set cookies when you press play. Privacy policy.
The routes to that data compare as follows for the sample plant's seven lines. Hours are sample assumptions, priced at the Eurostat EUR 40.8 an hour over 48 working weeks.
| Route | Plant hours a week | Cost of that time | What it misses | When it is enough |
|---|---|---|---|---|
| Paper shift sheets, typed up by the CI engineer | 14.75 (105 sheets a week at a twelfth of an hour each, plus 6 hours typing) | EUR 602 a week, EUR 28,886 a year | Short stops, true durations, anything written after the fact | A first look at one line |
| Spreadsheet from machine counters | 3 to compile | EUR 122 a week, EUR 5,875 a year | Why the line stopped; counts without reasons | Output trends on a stable mix |
| Line software (OEE or light MES) | Reason tagging at the line, in seconds a stop | Ask each vendor for a price per line per month | Nothing it measures, if reasons are kept up; it cannot fix a bad reason list | Three or more lines, or any plant sizing a CI team |
| Consultant or integrator study | Interviews and observation during the study | Ask for a fixed quote | Everything after the consultant leaves | A one-off diagnosis before deciding on a structure |
Five questions to ask any vendor of line software before the CI team depends on it:
- Is OEE shown by machine, line and shift with one definition across all lines, and can the definition be read on screen?
- Are changeovers counted as time loss in availability, against a standard per product change, with the overrun visible?
- How is stop time with no reason shown, and can its share be tracked as a KPI?
- Can losses be priced with the plant's own selling price and margin per product, and does the price follow the product that ran?
- Can a before-and-after for one line be exported for finance to check, without retyping?
Continuous improvement KPIs: how to judge the CI team itself
Continuous improvement KPIs for the plant are OEE, scrap and cost per unit. The CI team needs its own, and they should be hard to game. Counting events, ideas or trained belts measures activity. These measure results:
| KPI | Formula | Sample target | Data | Reviewed by |
|---|---|---|---|---|
| Validated savings vs team cost | EUR signed by finance / EUR cost of the CI team | 3x or more a year | Finance, from line data | Plant manager, quarterly |
| OEE points held at 90 days | OEE in weeks 11 to 13 after close minus baseline, same shifts and mix | At least half the points at close | OEE by line and shift | Plant manager and line champion |
| Projects closed per CI person | Closed projects with a signed result / dedicated people | 2 a year | Project list | CI lead |
| Stop time with a reason | Minutes with a reason / all stop minutes | 90% or more | Stop list by line | Line champions, weekly |
| Changeover minutes per line | Changeover minutes / planned minutes, per week | Falling against the line's own baseline | Changeover records | Production manager |
The second KPI is the one that separates structures. A central office can post strong numbers at close and weak ones at 90 days; a plant lead with champions should show the reverse. The EPA Six Sigma page describes the control phase the same way: institutionalise the change in policies and procedures, then monitor performance periodically to confirm the gain holds. How each saving is valued and signed belongs to the project, and the project charter carries the baseline and the stop rule; that document is covered in continuous improvement project charter.
A 90-day plan for the first CI hire
The first hire's job is to make the sizing test real with the plant's own numbers, then prove one result. Three phases, each with a pass mark the plant manager can check:
- Days 1 to 30, Measure: OEE by line and shift for all 7 lines, the top 10 stops by minutes, changeovers as time loss, and the share of stop time with no reason. Price the losses in EUR. Pass: under 10% of stop time without a reason, and a loss table finance has seen.
- Days 31 to 60, First project: Charter one project on the line where an OEE point is worth the highest margin, name a champion on every line, and run a 15-minute daily review at the line. Pass: a charter signed by the plant manager and a baseline taken from line data.
- Days 61 to 90, First result: Read the result against the baseline, agree the valuation method with finance, book the 90-day hold check, and rerun the sizing test with the plant's own numbers. Pass: a first result finance accepts, and a yes or no on the second hire.
In the sample plant the first project goes to a flexo folder-gluer, where a point is worth EUR 57,797 a year, three to four times a flatbed point. The champions are named in month two, not after the first success, because the 90-day hold check needs an owner on the line before the change lands. And the hire decision at day 90 uses the same table as above with real numbers in it: if the first project is tracking toward the base case or better, the second engineer clears the hurdle; if it is tracking toward the low case, the plant stays at one and widens the champions' role.
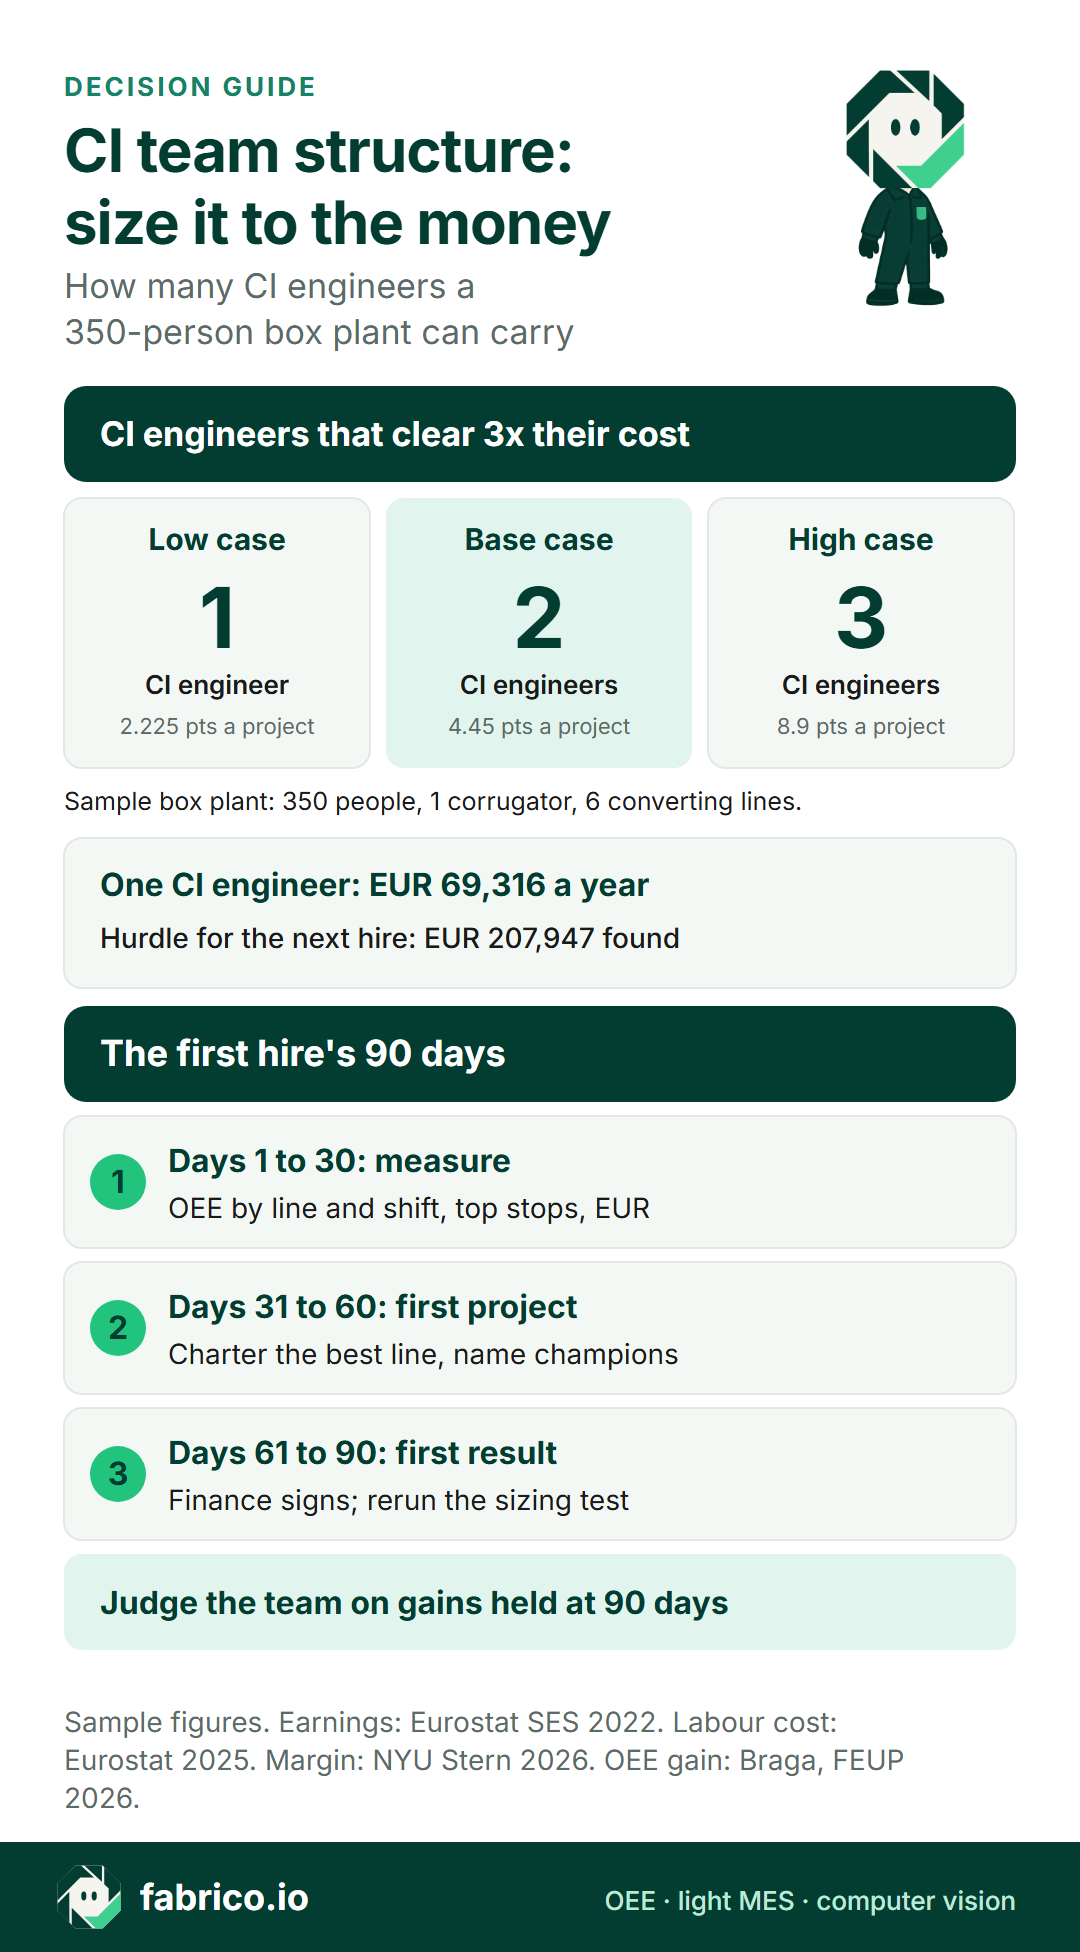
Text version of this infographic
- Sample plant: 350 people, one corrugator, six converting lines.
- Low case (2.225 OEE points a project): 1 CI engineer. Base case (4.45): 2. High case (8.9): 3.
- Hurdle: the next person finds 3 times their cost, EUR 207,947 a year.
- Days 1 to 30: Measure.
- Days 31 to 60: First project.
- Days 61 to 90: First result.
- Sources: Eurostat earnings 2022 and labour costs 2025; NYU Stern margin, January 2026; Braga, FEUP 2026.
Where Fabrico fits
Fabrico is OEE and light MES software with computer vision for the plant floor. For a CI team it supplies the line data in the sizing test and the KPIs above:
- Real-time OEE (availability x performance x quality) by machine, line and shift, from the machine's PLC or an IoT device with sensors, with stop reasons given by the operator and micro-stops detected from the signal.
- Changeovers recorded against a standard per product change and counted as time loss, and a top-stops view by minutes and frequency.
- The financial impact module prices losses with the selling price and margin per product, so the project list ranks by EUR.
- Where a station has no usable machine signal, the camera add-on counts output. Where the camera add-on covers a station, the video for the minute of a stop can be opened from the shift timeline, streamed on request and not stored in Fabrico.
- Reports export to Excel, and Fabrico also has a REST API and webhooks. Group Analytics compares OEE across sites for a hybrid structure.
The OEE and light MES solution overview shows the screens, availability tracking covers stops and changeovers, and MES and OEE with computer vision covers the camera add-on. For the CI manager's view of the software, see OEE software for CI managers.
Sources, accessed 18.11.2026: Purdue MEP, Lean Six Sigma deployment, part 1; Lean Enterprise Institute, lean promotion office; EPA, Six Sigma; Glover, Farris, Van Aken, IJPR 2015; Braga, FEUP 2026; NYU Stern margins by sector; Eurostat earnings by occupation 2022; Eurostat labour cost levels 2025.
Questions about continuous improvement team structure
How many people should a continuous improvement team have?
Size it to the money, not to a headcount ratio. Price the losses by line, estimate what one dedicated person can recover in a year, and add people while the next person still finds a multiple of their cost that finance accepts. In the sample 350-person box plant that gives one to three CI engineers, 0.29% to 0.86% of the workforce.
Who should a continuous improvement manager report to?
In a single plant, to the plant manager, who owns the lines and the budget the savings land in. In a group, add a dotted line to group operational excellence, which owns the definitions, training standards and cross-plant comparison. Finance does not own the team but signs its savings.
What does a continuous improvement department do?
It finds and prices the losses, runs improvement projects on the lines where they pay back best, trains line champions and supervisors in the methods, and proves that results hold. It coaches the people who run the lines; it does not take their improvement work away from them.
Should continuous improvement be centralised or embedded in operations?
Centralised CI moves faster on big projects but risks changes the line never owns. Embedded CI keeps ownership on the floor but loses to firefighting. A plant CI lead with a champion on every line, plus group standards in a multi-plant company, keeps the speed and the ownership.
What KPIs should a continuous improvement team be measured on?
Validated savings in EUR against the team's cost, OEE points still held 90 days after a project closes, projects closed per person, the share of stop time with a reason, and changeover minutes per line. Count of kaizen events or ideas logged is activity, not a result.
What should a first continuous improvement hire do in the first 90 days?
Measure first: OEE by line and shift, top stops, changeovers and losses priced in money. Then charter one project on the line where an OEE point carries the highest margin and name line champions. By day 90, show one result finance accepts and rerun the sizing test for a second hire.
Want to see OEE by line and shift, top stops and losses in EUR on a live line screen? Book a demo.
Related articles




Real Fabrico tiles, sample data.