


 Login
 Blog
Continuous Improvement Project Charter: Worked Example on Line Data

In short: a continuous improvement project charter is the one page a sponsor signs before a team starts work, and it is only as good as its baseline. Build the problem statement, the target and the benefit from measured line data, and the charter becomes a contract you can check later instead of an opinion with a signature.
- Take the baseline from a fixed window of stop and count data, and write the window into the charter.
- Set the target from the line's own best shifts, so it is a level already reached.
- Price the benefit twice: a floor finance signs, and an upside that only counts if extra output sells.
- Not every loss deserves a charter: some need a just-do-it, a quick kaizen, or nothing yet.
Most charter templates have the same boxes: problem, goal, scope, team, dates. The trouble is what goes in them. A problem statement that says "the sealer stops too often", a baseline someone remembers, and a saving worked out backwards from a budget target all pass the template and all fail later, when someone asks whether the project worked.
This guide fills a full charter for one line, a pet food kibble bagging line losing output to short stops at the bag sealer, with every number taken from four weeks of line data. It shows how to choose which loss gets a charter in the first place, how to price the benefit at a sourced margin, and the red flags a sponsor should look for before signing.
What a continuous improvement project charter has to prove
The fields are well settled. The Purdue MEP guide to selecting, defining and scoping Lean Six Sigma projects lists the elements a charter should include: a problem statement describing the gap between the current and desired state, the project metric (Y), the objective, the expected benefits, financial and other, and the core team. It describes the charter as a necessary deliverable of the Define phase and as the team's contract with the project sponsor or champion.
The Missouri state government guide to rapid improvement events uses almost the same list for kaizen-style events: problem statement, business case, goals, project scope, project milestones and team. It adds the line that matters most here: having baseline data before going into the project allows measurement of the impact of the improvements and supports the change.
So the charter has to prove three things to a sponsor, and each one needs data rather than opinion:
- The problem is real and sized. A loss in minutes and money, over a stated window, from a stated source.
- The target is reachable. Evidence that the line can run at the target level, not just a round number.
- The benefit is countable. A money basis that finance agrees before the work starts, so the saving can be checked after it ends.
Picking the project comes before the charter, and proving the saving comes after it. Scoring candidate projects by money is covered in CI project selection, and checking whether a finished project really paid is covered in CI savings validation. This page sits between the two: the document that turns a chosen loss into a project someone can be held to.
Which loss gets a charter: triage four candidate losses
Sample figures for illustration only. The sample line packs dry dog food into 12 kg open-mouth bags. The bag sealer sets the pace at an ideal 16 bags a minute. The plant runs two shifts, five days a week; a shift is 480 paid minutes less 30 minutes of breaks, so 450 planned minutes. A four-week data window covers 40 shifts. A 5-person crew runs the line.
For scale: the European pet food industry federation (FEDIAF) statistics page puts annual European pet food sales at EUR 29.4 billion and volume at around 8.6 million tonnes, for 2024. At the output worked out below, this one line would pack about 31,279 tonnes a year, roughly 0.36% of that volume: a single large line, not a plant.
The stop data for the window ranks four losses by line minutes a shift. Each is valued two ways at a shift basis of 470 shifts a year (47 working weeks). The floor values a lost line minute as crew time: the line hours that come out of the plan if output demand stays the same, at the crew size times the labour rate. The upside values it as bags that could be sold, at the margin per bag set out further down.
| Candidate loss | Minutes a shift | Floor a year | What the data says |
|---|---|---|---|
| Bag sealer short stops (under 2 min) | 41.05 | EUR 64,794.00 | About 61 stops a shift, cause unknown, crosses maintenance, quality and the bag supplier |
| Recipe changeovers at the bagger | 26.0 | EUR 41,038.83 | Steps are known and filmed once; one area; method known |
| Waiting for empty bags | 7.5 | EUR 11,838.12 | Magazine runs empty mid-shift; refill round is the cause |
| Checkweigher false rejects | 3.2 | EUR 5,050.93 | Small and steady; cause unclear |
Ranking by money alone would charter the two largest losses. Triage asks a second question: what does it take to remove the cause? The bag magazine needs a refill trigger, not a project, so it becomes a just-do-it for the line lead. Changeovers have a known method and sit in one area, so a short, focused event fits; the kaizen event guide covers how to run one. The checkweigher loss is small next to the cost of any team's time, so it is parked and checked again at the next monthly review.
That leaves the sealer. Its short stops cost EUR 64,794.00 a year at the floor, about 6.7 times the sample charter cost worked out below. Nobody knows why it stops, and the likely causes span heat settings, bag film from the supplier, bag placement and wear. An unknown cause that crosses teams and is worth several times the cost of the work is the case a charter is for.
The same Missouri guide makes this check part of its own process: once the charter is drafted, it asks whether an event is needed at all, because many tools exist to help decide whether a kaizen event is the right tool. Writing the triage into the plant's routine stops the charter template from becoming the default for every idea.
Building the baseline from four weeks of bagging line data
The baseline is where most charters go wrong, so the charter should show its working. The sealer's machine signal times its stoppages. Stops of 2 minutes or more get a reason from the operator; stops under 2 minutes are too many to code by hand, so they are counted and timed by the signal alone. The split between short stops and slow running is explained in reduced speed loss vs minor stops.
The window. 40 shifts, four weeks, no recipe or supplier change during the window. In that time the signal logged 2,436 short stops at the sealer, 1,642 minutes in total: 60.9 stops and 41.05 minutes a shift, an average of 40.4 seconds each. At 16 bags a minute that is 656.8 bags a shift that the line could have packed.
The OEE around it. Long stops average 47.5 minutes a shift: 26.0 for changeovers, 7.5 waiting for bags and 14.0 for faults and other causes. Run time is 450 minus 47.5 = 402.5 minutes, so availability is 402.5 / 450 = 89.44%. In that run time the ideal is 402.5 x 16 = 6,440 bags; the line packs 5,604, so performance is 87.02%. Short stops are a performance loss, so they sit inside that figure. 58 bags a shift fail the seal check and are cut open and re-bagged: 5,546 good, quality 98.97%. OEE = 89.44% x 87.02% x 98.97% = 77.03%, the same as 5,546 good bags against an ideal of 7,200. The arithmetic follows OEE calculation.
The spread. Weekly averages ran 42.7, 39.4, 41.2 and 40.9 minutes a shift. The 10 best shifts of the 40 averaged 23.6 minutes. That spread is the most useful number in the charter: it says the same line, crew and product can run with far fewer sealer stops, so the target does not have to be invented.
Three tests keep a baseline honest. First, the window is fixed and written down, so nobody can later pick a worse month to make the result look bigger. Second, the definition is fixed: here a short stop is a sealer stoppage under 2 minutes, timed by the signal. Third, the data source is named, so the same report can be run after the project. A Pareto analysis of the long-stop reasons usually comes from the same data and belongs in the appendix, not in the charter itself.
The filled charter for the bag sealer short stops
Here is the charter as the sponsor sees it. Every number traces back to the data window above or to a sourced rate; nothing is rounded up to make the case look better. Sample figures for illustration only.
| Charter field | Bagging line entry |
|---|---|
| Title | Cut bag sealer short stops on the kibble bagging line |
| Problem statement | In a four-week window of 40 shifts the bag sealer stopped 2,436 times for under 2 minutes, 41.05 minutes a shift, about 657 bags a shift of lost output. The cause is not known. |
| Business case | The sealer sets the line's pace, so a minute lost there is a line minute lost. At the floor basis the loss is EUR 64,794.00 a year. |
| Baseline | 41.05 min a shift, 60.9 stops a shift, mean 40.4 s; OEE 77.03%. Source: machine signal at the sealer, stops under 2 minutes, four-week window. |
| Primary metric (Y) | Sealer short-stop minutes a shift, from the same signal and definition |
| Target | 24.0 min a shift, the level of the 10 best baseline shifts (23.6) |
| Guard metrics | Seal check rejects no higher than 58 a shift; long stops no higher than 47.5 min a shift; fill weight unchanged |
| Benefit, floor | 17.05 min a shift x 470 shifts = 133.56 line hours a year x 5 people x EUR 40.3 = EUR 26,912.00, counted when those hours come out of the plan |
| Benefit, upside | 128,216 bags a year x EUR 5.55 = EUR 711,598.80, only if sales take the extra bags |
| Scope in | Bag sealer, bag placement into the sealer jaws, bag film as received, sealer settings and wear parts |
| Scope out | Extruder, dryer, coater and filling scale; changeovers (separate kaizen); bag magazine refill (just-do-it) |
| Team | Sponsor: production manager. Lead: CI engineer. Members: maintenance technician for the sealer, a line lead from each shift, quality technician. Bag supplier's technical contact on call. |
| Milestones | Gate reviews with the sponsor after Define and Measure, after Analyse, and at Improve and Control close |
| Cost | About 240 hours of people's time, EUR 9,672.00 at EUR 40.3 an hour, plus parts |
| Stop rule | Close or convert the charter if the Measure step changes the picture (see below) |
| Sign-off | Sponsor signs the charter; finance signs the money basis; the savings check uses the same report as the baseline |
Two choices in that table matter more than the rest. The primary metric is short-stop minutes, not OEE: OEE moves for many reasons outside the scope, while sealer short-stop minutes move only if the project works. And the target is the line's own best quartile, so when someone asks why 24.0, the answer is "because 10 of the 40 shifts already did it".
Research on events backs the emphasis on clear goals and an engaged sponsor. A 2006 Virginia Tech doctoral study of 51 kaizen event teams in six manufacturing organizations (Farris) found that management support and goal difficulty were common predictors of three out of five outcomes it measured. A charter signed by a sponsor who has seen the data, with a target that is hard but already reached on some shifts, puts both on paper.
Pricing the benefit at a sourced margin, and the floor finance signs
Charters often carry one large benefit figure. Splitting it in two avoids the argument that follows a project when the big number never shows up in the accounts.
The floor. If demand is flat, recovered minutes do not become sales. They shorten the time the line needs to make the same bags: 17.05 minutes a shift over 470 shifts is 133.56 line hours a year. Priced at the Eurostat 2025 hourly labour cost figures, which give EUR 40.3 an hour for industry in the euro area (and a whole-economy range of EUR 12.0 in Bulgaria to EUR 56.8 in Luxembourg), and a crew of 5, that is EUR 26,912.00 a year. It only counts if the planner takes those hours out of the plan, for example by dropping overtime or a weekend shift, so the charter names that condition.
The upside. If the extra bags sell, the recovered output is 272.8 bags a shift, 128,216 a year. The sample bag sells at EUR 23.90 ex works. The margin comes from the NYU Stern margins by industry dataset (Aswath Damodaran, data as of January 2026, 78 US food processing firms), which shows a gross margin of 23.23%. Gross margin still carries the plant's fixed costs, so it understates what an extra bag adds, which keeps the figure on the safe side: EUR 23.90 x 23.23% = EUR 5.55 a bag, EUR 711,598.80 a year.
Against the cost. The sample charter takes about 240 hours of people's time: 120 for the lead and 40 each for three team members, EUR 9,672.00 at EUR 40.3 an hour. The floor alone returns about 2.8 times that in the first year. The sponsor can sign on the floor and treat the upside as a sales question, which is the honest order. Plant-level money from losses, valued at the constraint, is set out further in OEE for pet food production.
See short stops, OEE and the money they cost, line by line, on one screen: book a demo.
Milestones as gates, risks and the stop rule
The Purdue MEP guide to deploying Lean Six Sigma says that in Six Sigma every project starts with a charter, created, owned and maintained by the champion, and that teams should present progress at the D-M, A and I-C stages to their champions and leadership. The bagging line charter writes its milestones as those gates, each with an exit condition rather than a date:
- Define signed. Sponsor and finance sign the charter and the money basis. The baseline window is frozen.
- Measure confirmed. One shift of hand tally at the sealer is compared with the signal count, to prove the signal counts short stops correctly. A sample of short stops is sorted by what happened at the jaws, so the team knows which causes carry the minutes.
- Analyse reviewed. The top causes by share of short-stop minutes are presented to the sponsor with the evidence for each.
- Improve trialled. Changes run on both shifts while the guard metrics are watched every shift.
- Control handed over. Settings and standard work are locked, the line leads own the daily check, and the savings check runs on the same report as the baseline.
For scale, the same Purdue guidance advises scoping projects to finish in three to six months from launch; the gates above keep a project inside that without promising a date for each step.
Risks the charter names.
- The signal miscounts. If the stop threshold or the sensor is wrong, the baseline is wrong. The Measure gate checks it first.
- A supplier change mid-project. New bag film can move short stops either way and hide the result. Film lots are logged against shifts.
- Recipe mix. Some kibble sizes may stop the sealer more. Results are compared recipe by recipe.
- Double counting. The changeover kaizen runs on the same line. Its minutes are long stops, the charter's are short stops, so the two savings do not overlap; the charter says so.
- People pulled away. The maintenance technician is also on breakdown call. The sponsor agrees the hours up front.
The stop rule. Two outcomes at the Measure gate close or convert the charter. If the corrected signal shows short stops well below the baseline, the problem was partly a counting fault, and the charter is re-scoped or closed. If one cause carries most of the minutes and has an obvious fix, the work becomes a just-do-it and the team is released. A charter that cannot stop is a budget, not a project. Problem-solving formats such as A3 problem solving and 8D problem solving can carry the analysis inside the charter's gates.
Charter red flags a sponsor should send back
| Red flag | Why it fails later | What to ask for |
|---|---|---|
| Baseline with no window or source | Nobody can rerun it after the project | The dates, the definition and the report name |
| Round-number target (cut stops by 50%) | No evidence the line can reach it | The best shifts in the baseline, or a labelled stretch |
| OEE as the only metric | OEE moves for reasons outside the scope | A primary metric the project alone moves |
| One benefit figure at full sales value | It assumes every extra unit sells | A floor and an upside, each with its basis |
| Scope says "the line" | The team chases everything and closes nothing | Scope in and scope out, by machine |
| No guard metrics | Stops fall while rejects or giveaway rise | Two or three metrics that must hold |
| No stop rule | The project drifts when the cause turns out simple | The condition that closes or converts it |
The same seven points, turned into checks, fit on the back of the charter. A sponsor can go through them in the review meeting:
- Baseline: Taken from a stated data window, not a guess.
- Metric: One primary metric the line already records.
- Target: A level the line has already hit on some shifts.
- Money: A floor finance signs, upside shown apart.
- Scope: In and out written down, one line, one machine.
- Guards: Metrics that must not get worse while it runs.
- Stop rule: When the charter closes or turns into a quick fix.
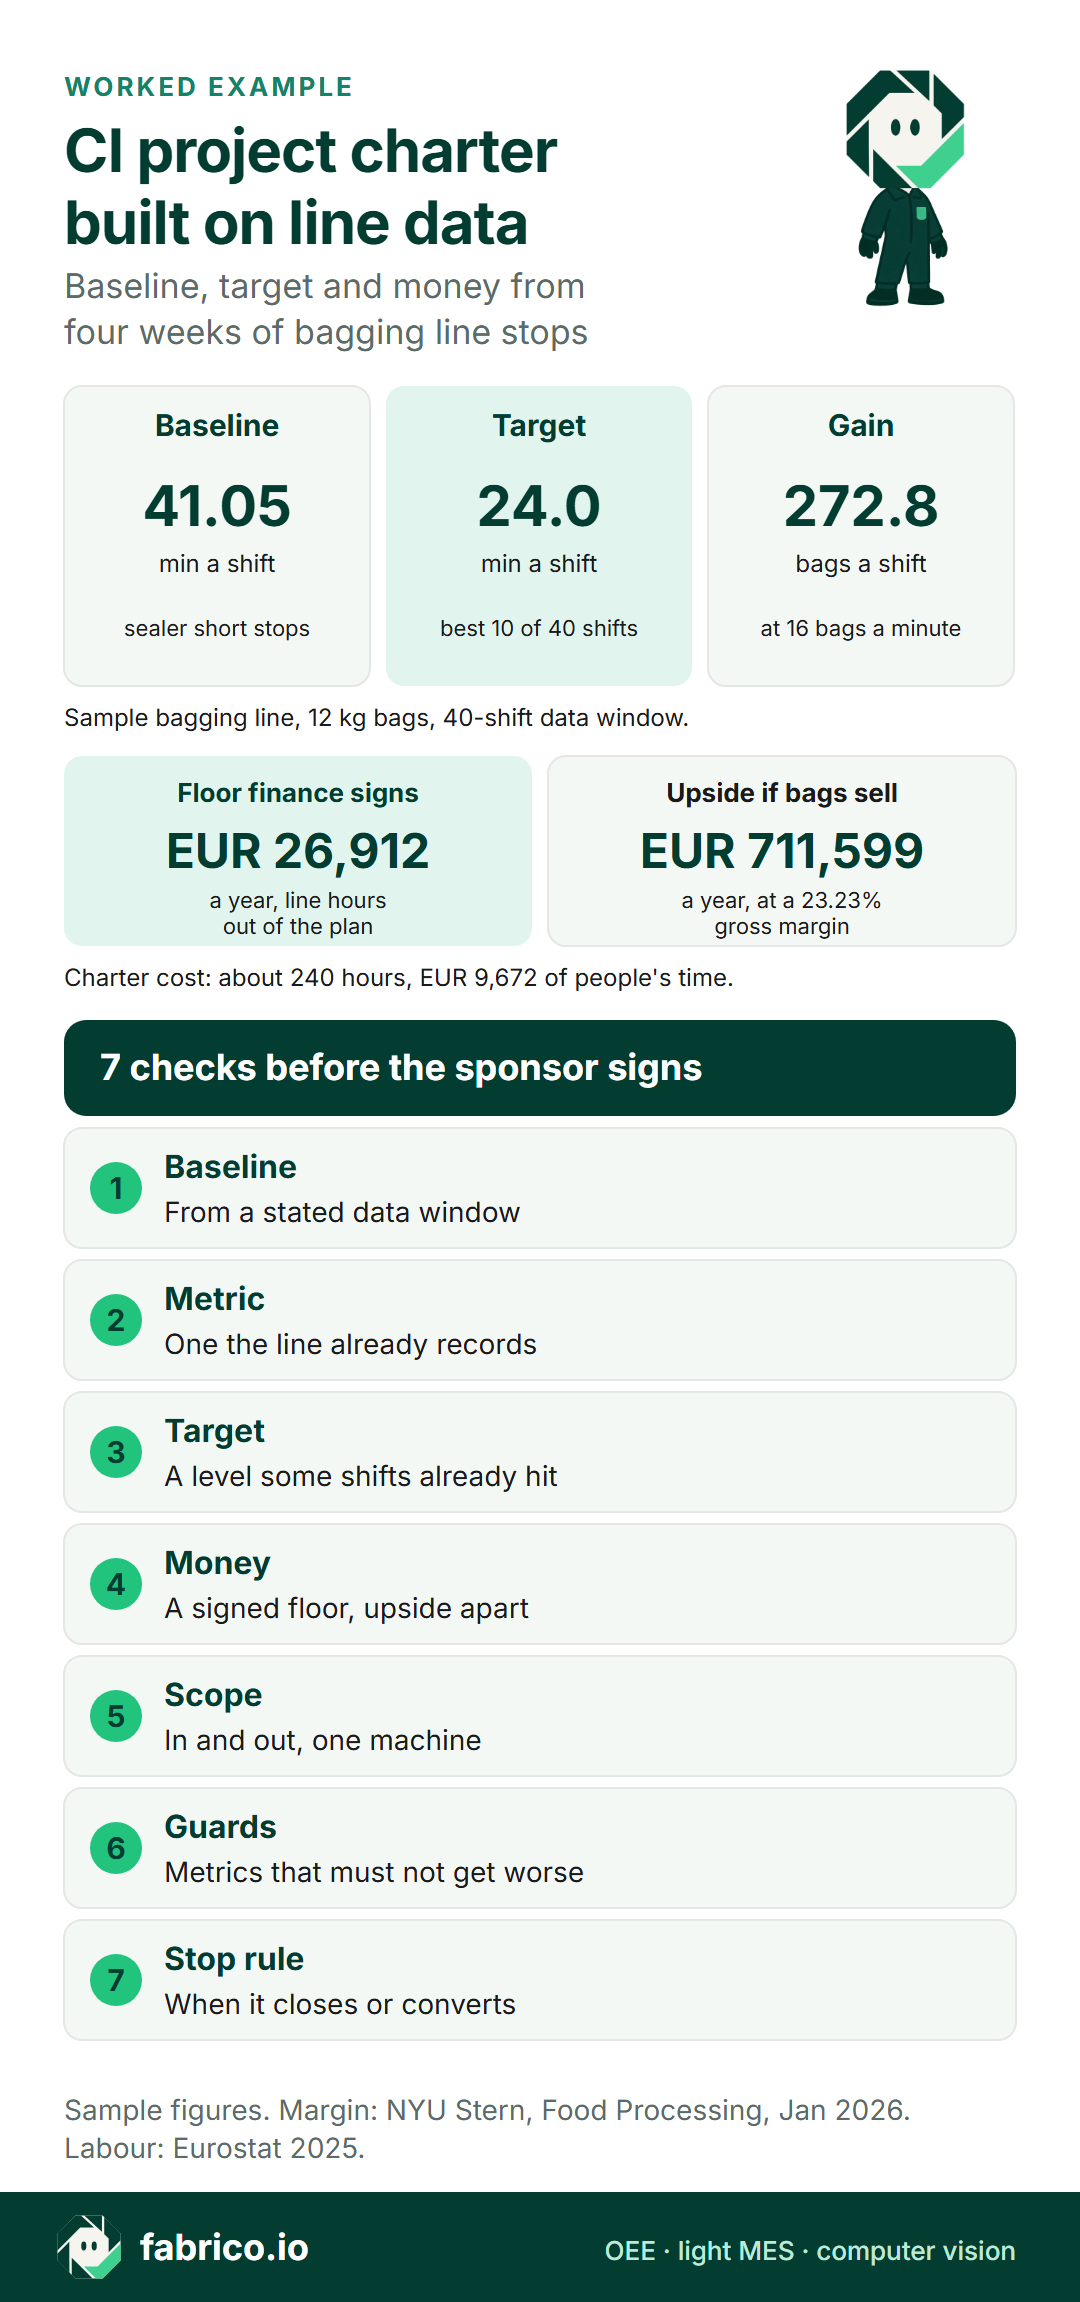
Text version of this infographic
- Baseline: 41.05 minutes a shift of bag sealer short stops, 40 shifts.
- Target: 24.0 minutes a shift, the level of the 10 best shifts.
- Floor: EUR 26,912 a year. Upside if bags sell: EUR 711,599 a year. Charter cost: EUR 9,672.
- Check 1, Baseline: Taken from a stated data window, not a guess.
- Check 2, Metric: One primary metric the line already records.
- Check 3, Target: A level the line has already hit on some shifts.
- Check 4, Money: A floor finance signs, upside shown apart.
- Check 5, Scope: In and out written down, one line, one machine.
- Check 6, Guards: Metrics that must not get worse while it runs.
- Check 7, Stop rule: When the charter closes or turns into a quick fix.
- Sample figures. Margin: NYU Stern, Food Processing, January 2026. Labour: Eurostat 2025.
Charter, quick kaizen, just-do-it or park: options, costs and who picks which
The cost ranges below are people's time only, priced at the Eurostat 2025 range of EUR 12.0 to EUR 56.8 an hour. Event lengths come from the US EPA guide to kaizen in lean methods, which says kaizen events are generally organized to last between one day and seven days. The hours for a just-do-it and for a chartered project are labelled sample assumptions.
| Option | Cost range | Choose it if |
|---|---|---|
| Just-do-it | 2 to 6 person-hours (sample): EUR 24.00 to EUR 340.80 | The cause is known and the fix is inside one person's authority, like the bag magazine refill |
| Quick kaizen | 5 to 8 people for 1 to 7 days: EUR 450.00 to EUR 23,856.00; a 2 to 3 day event at EUR 40.3: EUR 3,022.50 to EUR 7,254.00 | One area, a known method, a team that can fix it in days, like the changeover |
| Chartered project | 160 to 480 hours (sample): EUR 1,920.00 to EUR 27,264.00; the bagging line charter is EUR 9,672.00 | Cause unknown or crossing teams, and a yearly loss several times the cost, like the sealer |
| Park | Nothing now; the loss keeps running, EUR 5,050.93 a year at the floor for the checkweigher | The loss is small next to any team's time; review it monthly |
The 2 to 3 day figure is the event length the Missouri guide plans for, with planning starting 8 weeks before and follow-up in the 4 to 6 weeks after. The EPA guide adds that follow-up events are sometimes scheduled at 30 and 90 days after the initial event, so a quick kaizen still needs a little paperwork: a one-page event charter with the same baseline rules.
Who usually picks which. The line lead owns just-do-its and should not need a meeting to start one. The CI lead or engineer runs quick kaizens and decides with the area manager which losses fit an event. Charters go to the production or plant manager as sponsor, because they need people from several teams and a money basis finance will sign. Parked losses belong on the monthly review agenda, so parking is a decision with a date, not a way to forget.
Questions to put to the team, or to any vendor of improvement or line software:
- Where does the baseline come from, and can the same report be run after the project without anyone rebuilding it?
- How are short stops counted and timed: by the machine signal, by hand, or not at all?
- Can losses be shown in money from the plant's own prices and margins, by line and shift?
- Who agrees the floor and the upside before the work starts, and where is that written?
- What closes a charter early, and who has the authority to call it?
- How are guard metrics watched during the trial, shift by shift?
Keeping the baseline honest after sign-off
A charter is a promise to measure the same thing the same way at the end. Research on kaizen events points at what happens after the work. A 2010 Virginia Tech doctoral study of 65 events in eight manufacturing organizations (Glover), with surveys at the event and again about nine to eighteen months later, found that post-event performance review and accepting changes were significant predictors of whether outcomes lasted, alongside learning and experimentation in the work area. In charter terms: the Control gate needs a named review of the primary metric and the guard metrics, not just a closing slide.
For the bagging line, that review is the same short-stop report that built the baseline, run weekly by the line leads after hand-over. If short-stop minutes drift back above the target for two weeks in a row, the line lead raises it at the daily meeting. The savings check itself follows the validation steps, comparing like with like: same definition, same recipes, same counting.
With OEE software, the stop and its duration come from the signal at the machine and the operator adds the reason on a tablet or phone at the line, so the baseline and the weekly check are the same report someone runs, not a study someone has to organise. The walkthrough below shows a line screen and how a stop waits for its reason.
Demo data is synthetic. Book a demo.
Plays from YouTube. Google may set cookies when you press play. Privacy policy.
When charters fail, it is rarely the template. The pattern behind events that do not stick is covered in why kaizen events fail, and using OEE and loss data before and after an event is covered in running kaizen events with OEE data. The loop of plan, trial, check and lock in is the PDCA cycle; the charter is how a plant decides which loops get a team.
Where Fabrico fits
Fabrico is light MES and OEE software for the plant floor. The charter itself lives in whatever template the CI team uses; Fabrico supplies the line data that goes into it and the report that checks it afterwards:
- Stops and counts come from a PLC or IoT device with sensors, and the operator picks the stop reason from a grouped list on a tablet or phone at the line. The MES and OEE solution overview shows the screens.
- OEE, downtime and losses by line and shift, with losses shown in money from the plant's own prices and margins, so a charter's baseline and its savings check come from the same place.
- On stations with no usable signal, the camera add-on counts output; see MES and OEE with computer vision. Where the camera add-on covers a station, the video for the minute of a stop can be opened from the shift timeline, streamed on request and not stored in Fabrico.
- Reports export to Excel, so baseline tables can go into the charter or an A3, and Fabrico also has a REST API and webhooks.
For CI leads comparing tools, OEE software for continuous improvement managers sets out what to look for, and MES for food manufacturing covers the wider software picture for food and pet food plants.
Sources, accessed 17.11.2026: Purdue MEP, selecting, defining and scoping projects; Purdue MEP, deploying Lean Six Sigma; Missouri rapid improvement event guide; US EPA, lean methods: kaizen; Farris 2006, Virginia Tech; Glover 2010, Virginia Tech; FEDIAF statistics; NYU Stern margins by sector; Eurostat hourly labour costs.
Questions CI teams ask about project charters
What is a continuous improvement project charter?
A short document, usually one page, that states the problem, the business case, the goal, the scope, the milestones and the team for one improvement project. The sponsor signs it before the team starts, and it serves as the agreement between the team and the sponsor.
What should a project charter for a manufacturing line contain?
A problem statement with a measured baseline, one primary metric, a target, the expected benefit in money, the scope in and out, the team and sponsor, milestones as gate reviews, the main risks, the guard metrics that must not get worse, and a stop rule.
How do you set the baseline in a project charter?
Take it from the line's own records over a fixed window, for example four weeks of stop and count data, and write the window, the data source and the definition into the charter. A baseline from memory or a single bad week is the most common flaw in charters.
How do you set a target without guessing?
Look at the spread of the baseline. The average of the best shifts shows a level the line has already reached with the same people and machines, which makes it a credible target. A stretch beyond that should be labelled as a stretch.
Is a kaizen charter different from a Six Sigma project charter?
The fields are much the same. A kaizen charter covers a short event in one area, so it is lighter and the team is named for the event. A Six Sigma charter covers a longer DMAIC project with gate reviews, and the champion owns it throughout.
When is a project charter overkill?
When the cause is known and one person can fix it, a just-do-it with a short note is enough. When the loss is small next to what a charter costs in people's time, park it and look again at the next monthly review.
Who signs the benefit in a charter?
The sponsor signs the charter, and finance should agree the money basis before the work starts: which benefit counts as the floor, such as line hours removed from the plan, and which is upside that only counts if the extra output sells.
Want to see a baseline like this built from line data on a live line screen? Book a demo.
Related articles



Real Fabrico tiles, sample data.