







 Login
 Blog
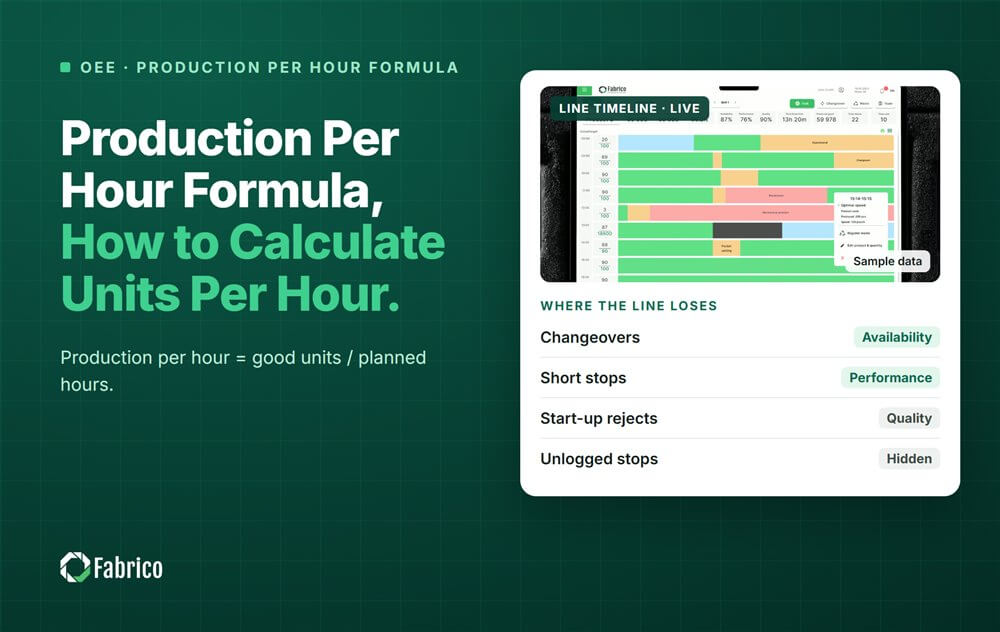
Production Per Hour Formula: How to Calculate Units Per Hour

Key takeaways
- Take good units and divide by the planned hours of the shift.
- Leave run hours out of it. They hide the stops.
- Divide by rated output per hour and you get the OEE of the shift.
- Track it hour by hour. A shift average hides a slow first hour.
Production per hour is the simplest number on the shop floor, and the one most often worked out three different ways. This guide gives one formula, a worked shift and the mistakes that make the number lie.
Fabrico, OEE and light MES software with AI cameras, counts good units per hour from the machine signal for every line and shift. The method below works the same on paper or in a spreadsheet.
What is the production per hour formula?
Production per hour tells you how many good units a line makes in one hour of planned time.
Production per hour = good units / planned production hours
- Good units are units that passed quality first time. Rejects and rework do not count.
- Planned production hours are the hours the line was meant to run. Take shift length and remove planned breaks and planned stops such as a scheduled clean.
Pick one unit and keep it. A filler counts bottles, a case packer counts cases. Convert with the pack size so every machine speaks the same language.
Should I divide by planned hours or run hours?
Divide by planned hours. This is the most common mistake with the formula.
If you divide by run hours, every breakdown and changeover vanishes from the number. A line that stopped for two hours can still show a fine rate. Run rate is useful for one question only: how fast does the line go when it runs?
So keep three rates apart and name them clearly:
- Rated output per hour: what the bottleneck machine can make at rated speed. A filler rated at 300 bottles a minute makes 18,000 an hour.
- Run rate: all units made / run hours. It shows speed loss and short stops.
- Production per hour: good units / planned hours. It matches what you shipped.
Our guide to run rate and design rate explains where the gap between the first two comes from.
Worked example: how many good bottles an hour did one shift make?
Sample line (illustrative numbers, not a customer): a bottle filler rated at 300 bottles a minute. The shift is 8 hours with a 30 minute break, so planned time is 450 minutes, or 7.5 hours.
- Stops during the shift: 60 minutes. Run time = 450 minus 60 = 390 minutes, or 6.5 hours.
- Bottles filled: 102,000. Rejects: 3,000. Good bottles: 99,000.
- Production per hour = 99,000 / 7.5 = 13,200 good bottles an hour.
- Run rate = 102,000 / 6.5 = 15,692 bottles an hour.
- Rated output = 300 x 60 = 18,000 bottles an hour.
Now divide production per hour by rated output: 13,200 / 18,000 = 73.3%. That is the OEE of the shift.
You can check it the long way: Availability 390 / 450 = 86.7%, Performance 102,000 / 117,000 = 87.2%, Quality 99,000 / 102,000 = 97.1%. Multiplied, they give 73.3% too. Our OEE calculation guide shows the same check with more examples.
Why does the average hide the problem in the sample shift?
A shift average of 13,200 an hour looks close to a target of 13,500. The hours tell another story. Here is the same sample shift, hour by hour, against a target of 13,500 good bottles per planned hour, which is 75% of rated output.
| Hour | Planned minutes | Target | Good bottles | Gap |
|---|---|---|---|---|
| 1 | 60 | 13,500 | 10,200 | minus 3,300 |
| 2 | 60 | 13,500 | 14,400 | plus 900 |
| 3 | 60 | 13,500 | 14,100 | plus 600 |
| 4 | 60 | 13,500 | 13,800 | plus 300 |
| 5 (break) | 30 | 6,750 | 6,900 | plus 150 |
| 6 | 60 | 13,500 | 14,400 | plus 900 |
| 7 | 60 | 13,500 | 13,500 | 0 |
| 8 | 60 | 13,500 | 11,700 | minus 1,800 |
| Shift | 450 | 101,250 | 99,000 | minus 2,250 |
Six of the eight hours met or beat the target. Hour 1 and hour 8 lost 5,100 bottles between them: a slow start and a late changeover. Fix those two hours and the shift ends 2,850 bottles ahead, not 2,250 behind.
At a sample contribution of $0.08 a bottle, the 2,250 bottle gap costs $180 a shift. In a euro plant at €0.08 a bottle, it is €180. Over 750 shifts a year that is $135,000. The hour by hour board is how crews catch this while the shift can still be saved.
How do I set the target per hour?
Start from rated output per hour, then decide what share of it is a fair plan. In the sample, the plant planned at 75% of rated output: 18,000 x 0.75 = 13,500 good bottles an hour.
- Set the target per SKU. A 1.5 litre bottle and a 0.5 litre bottle do not fill at the same speed.
- Scale the target to planned minutes. An hour with a 30 minute break gets half the target.
- Fix the target before the shift starts. Never change it after a bad hour.
Our guide to target vs actual production tracking covers what to write down when a gap appears.
How do I calculate production per hour in Excel?
Use one row per hour and four columns: hour, planned minutes, good units and target.
- Production per planned hour: =C2/(B2/60), where C2 is good units and B2 is planned minutes.
- Hourly target: =rated per hour x plan share x B2/60.
- Gap: =C2 minus the target cell, with red fill below zero.
Excel works for one line. It gets hard when counts are typed in late, or when nobody writes why an hour missed.
What mistakes make production per hour wrong?
- Dividing by run hours, so stops disappear.
- Counting all units, not good units, so rejects look like output.
- One target for every SKU on the line.
- Averaging hourly rates across hours with different planned minutes.
- Measuring at the wrong machine. Count at the bottleneck, usually the filler.
Where Fabrico fits
Fabrico is a computer vision enabled Manufacturing Performance Platform. OEE and light MES come first. It turns production per hour into a live view by line and shift.
- Automatic downtime logging from the machine signal, so every gap has its stops attached.
- The operator confirms the reason in one tap, and a camera clip can serve as evidence.
- Losses ranked by money, so hour 1 and hour 8 show up as the first things to fix.
You start with a pilot on one line. Devices are connected in about one month, and a full rollout takes 3 to 4 months. There is no free plan and there are no tiers: each plant gets a quote. See how the layer works on our light MES page.
Frequently asked questions
What is the formula for production per hour?
Production per hour equals good units divided by planned production hours. Planned hours are the shift length minus planned breaks and planned stops. Use good units only, so rejects do not count as output. Divide the result by rated output per hour and you get the OEE of the shift.
What is the difference between units per hour and run rate?
Units per hour usually means good units per planned hour, which matches what you shipped. Run rate is all units divided by run hours, so it ignores stops. Run rate tells you how fast the line goes when it runs. Units per planned hour tells you what the shift delivered.
How do I calculate production per hour from cycle time?
Divide 3,600 by the ideal cycle time in seconds to get rated units per hour. A cycle time of 0.2 seconds gives 18,000 units an hour. Then multiply by your planned share of rated speed to set a fair hourly target for that product.
Why is the first hour of a shift often below target?
The first hour carries the handover, start-up checks, material waits and the first good unit after a cold start. Those minutes come off one hour, so it looks bad while the rest of the shift looks fine. Track hour 1 on its own and fix its causes first.
Is production per hour the same as productivity?
Not quite. Production per hour measures the line's output against time. Productivity usually compares output with an input, such as labor hours or cost. On an automated line, production per hour moves first, and labor productivity follows it because the crew size stays the same.
Bring one line and last week's hourly counts to a Fabrico demo. We will show where each hour lost its bottles, or contact us with a question.
Latest from our blog






Real Fabrico tiles, sample data.