Login
 Blog
Real-Time Downtime Pareto Software: What It Needs and How to Test It

In short: Real-time downtime Pareto software ranks your stop causes from machine signals and operator tags as the line runs. It is worth buying only if the chart stays honest with no one cleaning the data by hand. Test that against your own stops before you choose.
- A trustworthy live Pareto needs machine-timed stops, one reason list, a clear shift calendar and a visible untagged bar.
- Read it two ways: by minutes to see what costs the most time, by occurrences to see what keeps coming back.
- Reason codes break it faster than software does. One cause under three names can fall out of the top four.
- Use shift-to-date to react, and a longer window to pick projects.
You run the downtime Pareto by hand. You export the log, merge the spellings, fix the obvious errors and build the chart.
By the time it is ready, the week is gone.
So you want it live. But when you build it by hand, you are the data cleaner, and a live chart has nobody in that job.
This guide covers what the chart needs instead, how reason codes break it, what to test in a tool, and how to use it in a daily meeting. One note: we sell this kind of software, so read our section with the same doubt.
What "live" should mean
A Pareto chart shows causes as bars, largest first, with a line for the running total. A live one redraws those bars as stops happen.
That raises questions a weekly chart never faces:
- Open stops. Does a stop count while it is still running, or only after it ends? If only after, your longest stop is invisible when it matters most.
- Delay. How long from machine stop to changed bar? Ask for the figure and measure it.
- Restating. When an operator tags a stop an hour later, the bars move. Good. But you must be able to see that it happened.
- Window. Ten minutes into a shift, one 25 minute stop from the last shift's end can look like your top loss if the window is wrong.
A chart that refreshes every few seconds but counts only closed, tagged stops is fast, not live.
The data a live Pareto needs
| Input | Why the chart needs it |
|---|---|
| Stop start and end from a machine signal | Minutes you can trust, including stops too short to write down |
| A cause from the operator | The machine knows when it stopped, not why |
| One reason list per process | Bars add up only if the names mean the same thing |
| A stop rule | How short counts as a stop, and when two stops are one |
| A shift calendar | Breaks and no-demand time must not land in your bars |
| Machine and line structure | A stop at one machine can stop three others |
| An untagged bucket | Shows how much of the chart is still unknown |
Two of these deserve more detail, because they change the ranking without anyone noticing.
The stop rule changes your count
Say a jam clears and returns three times in two minutes. That is one stop or four, depending on the rule.
The minutes stay the same, but the occurrence bar changes a lot.
The threshold matters too.
A 40 second stop is a stop under a 30 second rule. Under a 60 second rule, it may end up as slow running, which is a performance loss, not downtime.
One line stop can count several times
Example: a filler stops for 10 minutes and three machines after it run out of product. Add up the machines and you get 40 minutes, but the line lost 10.
Keep the waiting machines in their own starved or blocked reason. Otherwise the wrong cause climbs the chart.
Count it twice: minutes and occurrences
The same data can give a different order when you change what the bars count. That gap is the useful part.
Here is one line for one week, 10 shifts.
Example data:
| Reason | Stops | Minutes | Minutes per stop |
|---|---|---|---|
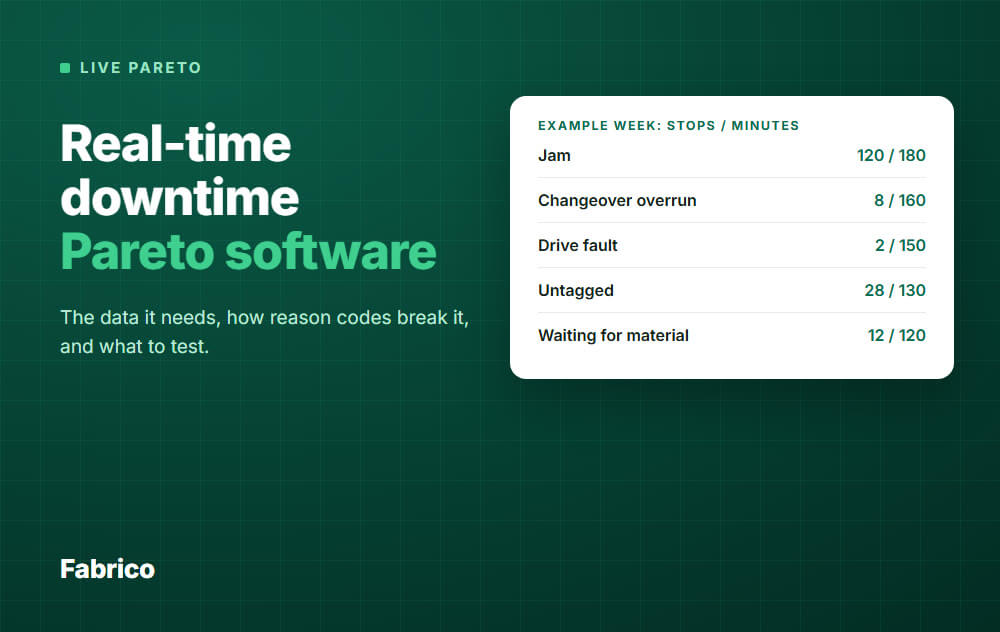
| Jam | 120 | 180 | 1.5 |
| Changeover overrun | 8 | 160 | 20 |
| Drive fault | 2 | 150 | 75 |
| Untagged | 28 | 130 | 4.6 |
| Waiting for material | 12 | 120 | 10 |
| Label roll out | 30 | 60 | 2 |
| Total | 200 | 800 | 4 |
What this example tells you:
- Jam leads both. Many short stops add up. That points to a process or design fix on the shop floor, not a faster repair.
- Drive fault is 2 stops and 150 minutes. Ask why it failed and why the repair averaged 75 minutes.
- Changeover overrun is 8 changeovers, each 20 minutes over standard. Look at standard work first, and note that the occurrence chart alone would bury it.
- Label roll looks big by count and small by time. It may be a quick win, not a priority.
Now look at the running total. Three bars make 61.3 percent of the minutes, not 80.
The 80/20 ratio is a rule of thumb, not a law, so do not distrust a chart for failing to match it.
The untagged test
Before you act on the ranking, compare the untagged minutes with the gaps between bars. Here, jam leads changeover by 20 minutes, and 130 minutes have no reason.
If just 21 of those minutes belong to changeover, the top bar changes.
So this ranking is not settled yet. Tag first, then decide.
How reason codes break a live Pareto
Software can read a stop perfectly and still show you the wrong list. These are the usual ways it happens.
One cause, several names
This is the worst one, because the chart looks fine. Take the jam minutes above and let operators use three names for it.
By hand, you would merge those names without thinking. A live chart will not.
Check the chart by shift: if one reason appears only on one shift, suspect a naming problem.
Other common breaks
- "Other" at the top. The chart is telling you the list has a gap. Split the code using the operator comments.
- First in the list wins. A rushed operator taps the top option. If one code is oddly popular, check the screen order.
- Symptom or cause. "Machine stopped" tells you nothing. Name what the operator can see, and leave the deeper why to the review.
- Tagged from memory. A stop tagged at the end of a shift is a guess. Tag at the line, close to the stop.
- Codes changed mid-month. Rename or merge a code without a mapping, and last month's trend breaks.
Read our guides on reason code design and unclassified downtime before you switch on a live chart. Fix the list first, since a live chart will publish its faults faster.
What to test in a tool
Do not judge this from a demo with clean sample data. Ask to run these on a real line, or at least on a real export of your stops.
| Test | What to do | Pass |
|---|---|---|
| Open stop | Stop a machine, watch the chart with a clock | It shows during the stop, and you know the delay |
| Untagged | Leave a stop with no reason | It gets its own visible bar, not "Other" |
| Late tag | Tag that stop an hour later | Minutes move to the reason, and the original time stays |
| Two counts | Switch minutes to occurrences on one filter | Same data, same period, totals agree with the stop list |
| Reconcile | Open a bar and add up its stops | The sum equals the bar. You can export it |
| Short stop | Create a stop under the threshold | Someone can tell you where it went, and why |
| Line stop | Stop an upstream machine | Line minutes do not double count the waiting machines |
| Code change | Merge two reasons | Old stops stay readable and the trend holds |
| Window | Compare shift-to-date, 24 hours and 4 weeks | Your shift calendar is respected, breaks stay out |
| Operator | Have an operator tag a stop at the machine | Done in seconds, with no help from you |
For a wider look at the market, see our review of downtime tracking software.
When you do not need live
Be honest about this before you buy. If your line has few, long stops that are already logged well, and you review weekly, a spreadsheet can do the job.
Live earns its place when short stops are hiding, several lines must share one view, the manual build eats hours, or you want people reacting during the shift.
How to use it in a daily meeting
A live chart can pull a meeting into chasing whatever bar moved last. Use two windows, with one job each:
- Shift-to-date: for reacting now. It is noisy, so never start a project from it.
- Longer window, such as 4 weeks: for choosing projects. One week can rank causes differently from a longer period.
Then give the Pareto about 5 minutes of a 15 minute daily OEE meeting:
- Check the data. How much of yesterday is untagged? Have the shift lead clear it before the meeting.
- Read yesterday by minutes. Name the top three bars.
- Read yesterday by occurrences. Is anything repeating that minutes hide?
- Compare with the 4 week view. A new bar is an event to look into. A standing bar is a project.
- Close with one owner, one action, one date. Then check whether yesterday's action moved its bar.
Do not argue about reason codes in the meeting. Note the problem and fix the list in a monthly review, so the numbers stay comparable. When the same causes stay on top, compare tool types in our guide to plant downtime prevention software.
How Fabrico fits
Fabrico is a light MES: cloud software for OEE and production monitoring. For this job, it gives you the inputs and the ranking.
- A stop on a connected machine is recorded with its start time and duration. The signal comes from a PLC, an IoT device with sensors on older machines, or an AI camera where there is no machine signal.
- Operators tag the cause on a tablet or phone, from your own list of reason codes.
- You see downtime by cause, machine and shift, with a ranked list of top reasons, for the current week or a past period.
- The OEE dashboard updates while the line runs.
- Line status shows running or stopped, how long the current stop has lasted, and its cause once tagged.
- Short stops are detected from the machine signal, including those too short to write down.
- Any list can be exported to Excel or CSV, so you can add up a bar or count stops yourself.
That list is what our product pages state. A refresh delay for the top reasons list, a count by occurrences on screen, late tag history and code merges are not on it, so ask to see them in the demo.
Plan on about 1 month to install and connect devices, and 3 to 4 months for a full rollout.
What it does not do: Fabrico ranks causes, but it has no root cause analysis workflow. Your team still runs the investigation and the fix.
Job dispatching, BOMs, routings and genealogy stay in your ERP. See the Fabrico MES and OEE overview for details.
Bring the test table above to the conversation. Request a demo or Contact us.
What people ask next
Should a downtime Pareto rank by minutes or by occurrences?
Start with minutes, since that is the time you lost. Then check occurrences, because frequent short stops need a different fix than rare long ones.
How much untagged time is too much?
There is no standard figure. Use the test above: if the untagged minutes are larger than the gap between your top bars, the ranking is not settled.
Can a live Pareto work with no PLC?
Yes, if something else gives a reliable stop signal, such as an added sensor or a camera. Run the same open stop test on that signal.
Should we add money to the chart?
Yes, once minutes are trusted. Multiply minutes by the value of a stopped hour at that line, since an hour on your bottleneck may be worth far more than one elsewhere.
How is this different from an OEE loss tree?
A loss tree shows where all the time goes. A Pareto ranks the causes inside one part of it, so you know what to fix first.
Want to see how Fabrico ranks stop causes? Request a demo or Contact us.