








 Login
 Blog

Use Pareto Analysis to Reduce Downtime: The 80/20 Rule

Key Takeaways:
- The rule of thumb: the Pareto principle says a few causes usually make up most of the loss. 80/20 is a pattern, not a law, so measure your own split.
- The trap: most maintenance teams treat every breakdown with equal urgency. This spreads scarce resources too thin and the top 20% stay broken.
- The strategy: rank assets by total downtime hours, identify the vital few, put most of the improvement effort there, and measure the result on the same list.
The Pareto Reality in European Manufacturing
Quick answer: Pareto analysis for downtime means ranking your stoppage causes by total minutes lost and focusing on the top 3, because a few causes usually make up most of the loss. Check the share on your own data, then attack the biggest first.
Related deep-dives: 6 root causes of downtime · true cost of downtime · auto-categorization comparison · closing the OEE-CMMS loop.
Vilfredo Pareto noticed in 1906 that 20% of Italians owned 80% of the land. The same uneven distribution shows up everywhere, including industrial downtime.
Concrete numbers from typical European packaging plants:
- A typical line has 20-30 critical assets
- 4-6 of those (the top 20%) drive 75-85% of all unplanned downtime hours
- The other 14-24 contribute roughly 20% combined
The implication is uncomfortable: if you spread maintenance attention evenly, you spend 80% of resources on assets that only cost you 20% of the problem. The top 20% stay broken because there is never enough focus.
The Pareto fix is not glamorous. It is a ranking exercise followed by ruthless prioritization. See OEE benchmarks by sector for typical asset-tier distributions.
Before you rank, put a price on the hours. Why Lines Stop, our free field guide, shows how to cost one stopped hour on your line.
How to Find Your 20%: The Ranking Method
Find your 20% by ranking assets by unplanned downtime hours over 12 weeks and cutting the list at 80% of cumulative hours. The ranking method is mechanical. No judgment calls, no politics. Three columns of data over 12 weeks:
- Asset name
- Total unplanned downtime hours
- Number of unplanned events
Sort by downtime hours descending. Sum the column. Find the cutoff at 80% of cumulative hours. Every asset above that cutoff is your Pareto top.
Those assets are your vital few. The cutoff depends on your plant.
Two data quality requirements before the ranking is trustworthy:
- Micro-stops captured (not just 30+ minute events). PLC-only tracking misses 60-70% of true downtime. Computer Vision closes the gap.
- Consistent classification. „Operator error" on one asset and „setup issue" on another may be the same root cause. Data collection methodology.
Without these two, your Pareto ranks the wrong assets.
The 4-Week Sprint: Act on the Vital Few
Once you have the top 20%, run a focused 4-week sprint per asset:
Week 1: Root cause. Pull every unplanned event for that asset in last 90 days. Cluster by symptom. Identify the 1-3 dominant root causes.
Week 2: Intervention. For each root cause, pick one of: condition-based PM trigger, standardized procedure, spare parts policy change, sensor upgrade. Match the cause type to the intervention type. See the 6 OEE losses framework.
Week 3: Implement + measure. Execute the intervention. Set up a daily monitoring chart for that asset only. Watch event frequency hour-by-hour.
Week 4: Decide. If the intervention reduced events 40%+, lock it in and move to the next top-20% asset. If not, the diagnosis was wrong. Restart at week 1 with a different cluster.
Measure the sprint on the same ranked list after 12 weeks. Fixes often carry over to similar assets, so check those too.
Stop Spreading Yourself Thin. Attack the Vital Few.
The hardest part of Pareto is not the math. It is saying no to the lower 80%.
Operators will complain that their asset is „always broken." It probably is. But if it is not in the top 20% of downtime hours, fixing it should NOT get the same urgency. The top 20% has to come first.
An OEE solution can keep this ranking current from stops logged on connected machines and the causes operators tag. Finding the root cause stays a job for your team. See what to test in real-time downtime Pareto software.
That is the difference between Fabrico and an analytics dashboard that shows you everything equally.
Want OEE captured straight from your machines, no manual logs?
Request a demoRelated articles







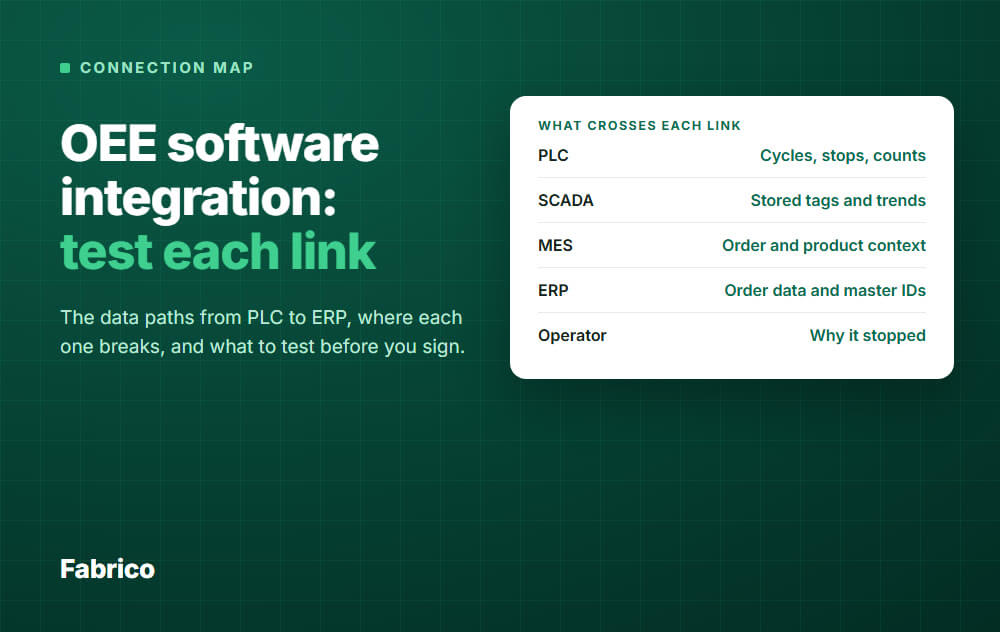
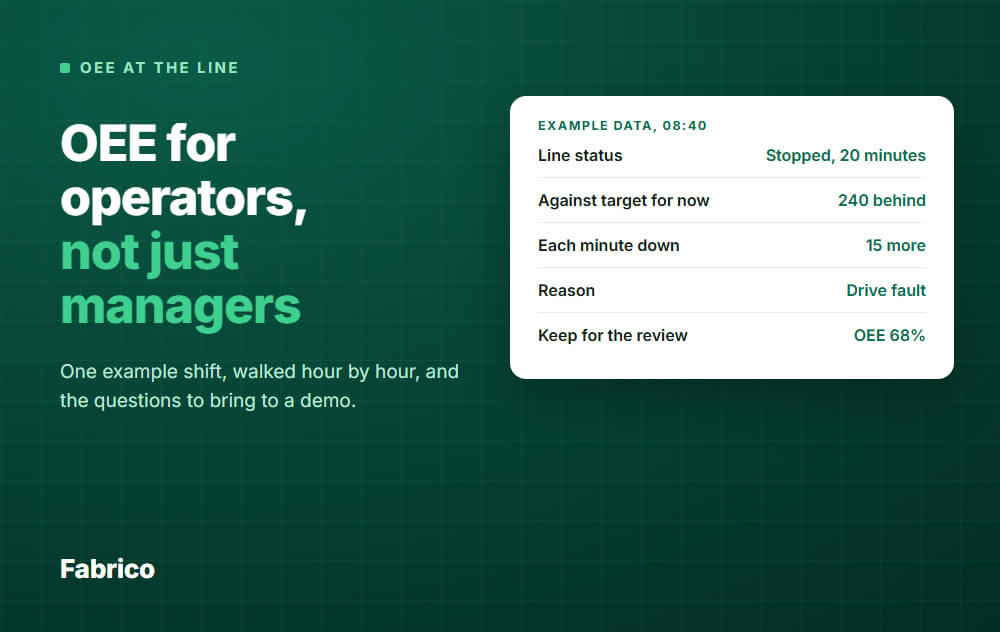


Real Fabrico tiles, sample data.