


 Login
 Blog
Brownfield vs Greenfield Manufacturing: Expand a Site or Build New?

In short: Brownfield vs greenfield manufacturing comes down to how much capacity you still need after the existing site runs at the OEE it can reach: expand the plant you have when that remainder fits its space, utilities and permit, and build new when it does not.
- Measure OEE per line first; recovered output changes the size of the build.
- A decision table for expand, build new, or recover first and then decide.
- A worked example: 45% more demand, how much recovery closes, and whether a sixth day or one new line covers the rest.
- An 8-item checklist for the site review.
A food or FMCG maker that needs more output can add to the factory it runs, build a new one, or first get more from the lines it has. This page covers the operating side. Real estate, tax incentives and finance structuring are out of scope.
Brownfield and greenfield: two meanings of one word
In plant engineering, a brownfield project works inside or beside an existing site, and a greenfield project starts on land with no plant on it. Regulators use the first word differently. The US EPA says a brownfield is a property where expansion, redevelopment or reuse may be complicated by the presence or potential presence of a hazardous substance, pollutant or contaminant. So a "greenfield" plot bought from an old industrial estate can be a brownfield in the legal sense. Check which meaning each document uses.
This page is about the capacity decision. Making old machines report data is a separate job, covered in brownfield OEE for legacy equipment.
Start from measured OEE, not the rated speed
The size of a new build is the demand gap divided by what a line really makes. Start either number from the plate speed and the build comes out too small. Use effective capacity: rated speed at the constraint, times planned time, times measured OEE. The difference between the two is set out in nameplate vs real capacity.
The Federal Reserve reports that US capacity utilization for manufacturing increased 0.1 percentage point in September to 75.9 percent (September 2026, all manufacturing), but a national average cannot size a build. Only line data from the plant itself, measured at the constraint, can.
Log a reason for each stoppage, then split the lost time on each line into fixable and structural. The Census Bureau asks plants the same question in its capacity survey, which collects data and produces statistics on reasons for operating at less than full production capacity. Changeovers, breakdowns, starved and blocked time and start-up rejects are the losses a team can work on. A machine slowed by its design, or a cleaning window set by the hygiene plan, is structural until something is rebuilt. Minor stops and slow running count under performance. Count each loss once, at the constraint. The method for finding the fixable share is in hidden capacity before buying a line; the cost side, line against recovery, is in new line cost vs recovering capacity.
Worked example: a dairy that needs 45% more packs
Sample figures for illustration only. A dairy runs three identical yoghurt lines. Each cup filler-sealer, the constraint, is rated at 140 packs a minute. Planned time is 7,200 minutes a week per line (5 days, three 8-hour shifts). The hall has one empty bay. Sales want 45% more within four years.
Today, measured over eight weeks (method in the OEE calculation guide):
- Most the site could make: 3 x 140 x 7,200 = 3,024,000 packs a week.
- OEE: availability 75.0% x performance 82.5% x quality 97.0% = 60.0%.
- Good packs: 3,024,000 x 60.01875% = 1,814,967 a week. Lines run all planned time: this is today's output.
- Year 4 demand: 1,814,967 x 1.45 = 2,631,702. Gap: 816,735 packs a week.
Without recovery, a new line rated like the others, at an assumed first-year OEE of 50%, makes 140 x 7,200 x 50% = 504,000 a week. The gap needs 816,735 / 504,000 = 1.62 lines, so two. Two lines will not fit one bay. That points to an extension or a new site.
With recovery. The loss review (the general method is in finding the hidden factory before adding capacity) finds fixable minutes in changeovers and breakdowns (availability to 85.0%), minor stops and slow restarts (performance to 87.5%) and start-up rejects (quality to 98.0%).
- New OEE: 85.0% x 87.5% x 98.0% = 72.9%.
- Good packs: 3,024,000 x 72.8875% = 2,204,118 a week, 389,151 more than today.
- Left for a new line: 2,631,702 minus 2,204,118 = 427,584. One new line at 50% makes 504,000, so one line in the empty bay closes it.
Recovery moved the answer from an extension or a new site to one line in the empty bay, if the bay passes the space, utility and permit checks below. It also carries a risk. If recovery reaches only halfway, at 80.0% x 85.0% x 97.5% = 66.3% OEE, the site makes 2,004,912 and 626,790 is left. The new line, at most 140 x 7,200 = 1,008,000 packs a week, would then need 626,790 / 1,008,000 = 62.2% OEE in its first year, well above the 50% planned. So prove the recovery on one line before the board approves the bay.
In money: say each pack earns a contribution of EUR 0.08 and the plant runs 50 weeks a year (sample figures). The 389,151 packs a week that recovery returns are worth 389,151 x 50 x 0.08 = EUR 1.56 million a year at year-4 demand, with no new floor space. In the halfway case the new line falls short by 626,790 minus 504,000 = 122,790 packs a week, about EUR 491,000 a year of contribution lost on demand the plant cannot serve. With full recovery the margin holds: at a first-year OEE of 45%, 5 points below plan, the new line still makes 453,600 packs a week against the 427,584 needed. Below 42.4% it no longer covers the remainder.
A third option: a sixth production day. The dairy runs five days, so its calendar still has room. Add Saturday's three shifts and each line gets 8,640 planned minutes a week instead of 7,200. After full recovery the site then makes 3 x 140 x 8,640 x 72.8875% = 2,644,942 packs a week, against 2,631,702 needed in year 4. On paper that closes the gap with no build at all. Whether it holds depends on five things:
- The margin is thin. 2,644,942 minus 2,631,702 leaves 13,240 packs a week, 0.5% of demand. At 72.9% OEE the three lines together make about 306 good packs a minute, so about 43 minutes of site-wide stoppage in a week uses the margin up. Six days need 2,631,702 / 3,628,800 = 72.5% OEE, so recovery has to land almost in full.
- The halfway case still needs the bay. At 66.3% OEE, six days give 3,628,800 x 66.3% = 2,405,894 packs and leave 225,808. A new line on the five-day pattern would cover that at 225,808 / 1,008,000 = 22.4% OEE, so far less rides on its ramp-up.
- Labour costs more at the weekend. Three lines times three shifts is nine extra shifts a week, each needing a full crew. Weekend hours often carry a premium under the employment contract or collective agreement, and covering them with overtime puts the same people on a sixth day every week. Check whether crews can be hired for a fixed sixth day before counting on it.
- Cleaning and maintenance lose their window. In a five-day plant the weekend usually holds the deep clean and planned maintenance. Squeeze them into Sunday or into the week, and any planned time they take comes straight off the 8,640 minutes.
- No buffer is left. Today a lost day can be made up on Saturday. With six days booked, Sunday has to hold catch-up, cleaning and repairs at once, and demand above the year-4 level has nowhere to go.
So the order becomes: recover first, then add a sixth day if crews can be hired for it, and build only when they cannot or when a 0.5% margin is too thin to trust. A sixth day can also bridge the months while the new line is installed and ramps up. Before treating weekend hours as capacity, work through overtime and weekend shifts as a capacity diagnostic.
A second case: a bottler with a full calendar. Sample figures for illustration only. Two bottling lines run 3 shifts, 7 days: 10,080 planned minutes a week each. The filler, the constraint, is rated at 400 bottles a minute, and measured OEE is 70.0%, so output is 2 x 400 x 10,080 x 70% = 5,644,800 bottles a week. Demand is to rise 60%, to 9,031,680, a gap of 3,386,880. Recovery to 78.0% OEE adds 645,120 bottles and leaves 2,741,760. One new line at a first-year OEE of 55% makes 400 x 10,080 x 55% = 2,217,600, so the remainder needs 1.24 lines, in practice two. No extra shift is left to add. Here recovery does not change the answer, it sizes it: two lines, and a site that can hold them.
Book a demo to see how a connected line's downtime splits by cause and shift, with losses shown in money.
Expand, build new or recover first: the decision table
Once the gap is sized, eight factors decide the site. Read each cell as a question to check against the plant's drawings and permit.
| Factor | Expand the existing site | Build a new plant | Recover first, then decide |
|---|---|---|---|
| Site limits | Walls, plot and floor loading set the ceiling | Layout drawn around the process | Shows how much new space is needed |
| Utilities | Check headroom on each supply | Sized for the new load from the start | Lower load if fewer lines are built |
| Permits | A change to an existing permit | A new permit, and the land's history | Can shrink the change to apply for |
| Labour | Existing crews and skills on site | A new team to hire and train | Extra shifts tested with current crews |
| Logistics | Current routes and suppliers | A chance to sit nearer to demand | No change while recovery runs |
| Equipment age | Old lines stay in the mix | All new, with new teething losses | Shows which old line still earns its place |
| Time to output | Works around a running plant | Starts from bare land or shell | Recovered output comes before any build |
| Ramp-up risk | One new line beside proven ones | Whole plant ramps at once | Measured baseline to plan the ramp-up |
Signs the existing site can take it: the remainder fits one bay or one extension, utilities have headroom, and the permit change is small. Signs a new site is needed: the remainder is more than the plot holds, or labour and freight work better elsewhere. Signs it is too early to choose: the OEE record is too short to tell fixable loss from structural, or a third or more of downtime has no reason, so the fixable share is still a guess.
What a new line or plant carries from day one
A greenfield plant does not start at the OEE of the site it relieves: every line ramps at once, with new crews and suppliers. A brownfield line ramps beside proven ones, but building work can cost output on the running lines, so plan shutdown windows into the gap. Either way, agree the target curve and the supplier's part in it before the order: see the new line ramp-up plan and the OEE clause in a new line contract.
If one old line holds most of the breakdown minutes, replacing it in place may beat adding a fourth. An extra shift adds hours without floor space, if crews can be found; TEEP shows the calendar time left unused.
Land, permits, hygiene, labour and power: the paper checks
The capacity number decides how much to build. These checks decide where it can go.
- Land history: a plot with an industrial past may need a contamination assessment before any build. Across the UK, the Environment Agency and the other regulators expect you to follow LCRM if you are managing the risks from historic land contamination, a staged process of risk assessment, options appraisal and remediation. If the land has a past, those stages belong in the greenfield timeline.
- Permits: an extension can change what a site emits, drains or abstracts. Guidance for England says you may need an environmental permit or licence for an activity that could pollute the air, water or land, or take water from a surface or underground source. Ask the permit holder early how large a change the new line is.
- Hygiene layout: in a US food plant, 21 CFR 117.20 requires the plant to provide adequate space for such placement of equipment and storage of materials as maintenance, sanitary operations and safe food production need. A bay that fits the line's footprint but not its cleaning access fails that test.
- Labour: a new site needs a new crew, hired at the local wage. Across the EU, Eurostat put average hourly labour costs of EUR 34.9 in the EU in 2025, whole economy, with the country figures running from EUR 12.0 (Bulgaria) to EUR 56.8 (Luxembourg). For a plant crew, the industry figure is closer: EUR 40.3 an hour in the euro area, the highest of the sectors on the same page. Between two EU countries, the hourly rate can differ by close to five times.
- Power: an extension draws on the site's existing supply, while a new plant contracts its own. Eurostat puts the EU average non-household electricity price at EUR 0.1800 per kWh for the first half of 2026 (users of 500 to 2,000 MWh a year); compare headroom and tariff at both sites.
Eight checks before the site review
Operations, engineering and finance answer these together. Each needs a number or a document, not a view.
- Measured OEE per line: At least four weeks of availability, performance and quality per line, taken from the machine signal, not the shift report.
- Fixable minutes by cause: Changeovers, breakdowns, minor stops, starved and blocked time and start-up rejects, each tagged fixable or structural, with an owner.
- Demand in units at the constraint: The forecast turned into packs a week at the slowest machine, by product family, with the year each step is needed.
- Space, layout and hygiene zones: A scaled drawing of the bay with the line, buffers, cleaning access and zone boundaries marked.
- Utilities and permit headroom: Peak reading against the limit for each supply, and the permit holder's written view of the change.
- Labour and logistics: Crew count per option, a sixth day included, and freight distance for inputs and finished goods.
- Age of the lines you keep: Breakdown minutes per line over the last year, so old equipment's losses are not carried into the plan.
- Date of steady output: Months from approval to steady OEE for each option, with ramp-up weeks and the disruption to running lines during works.
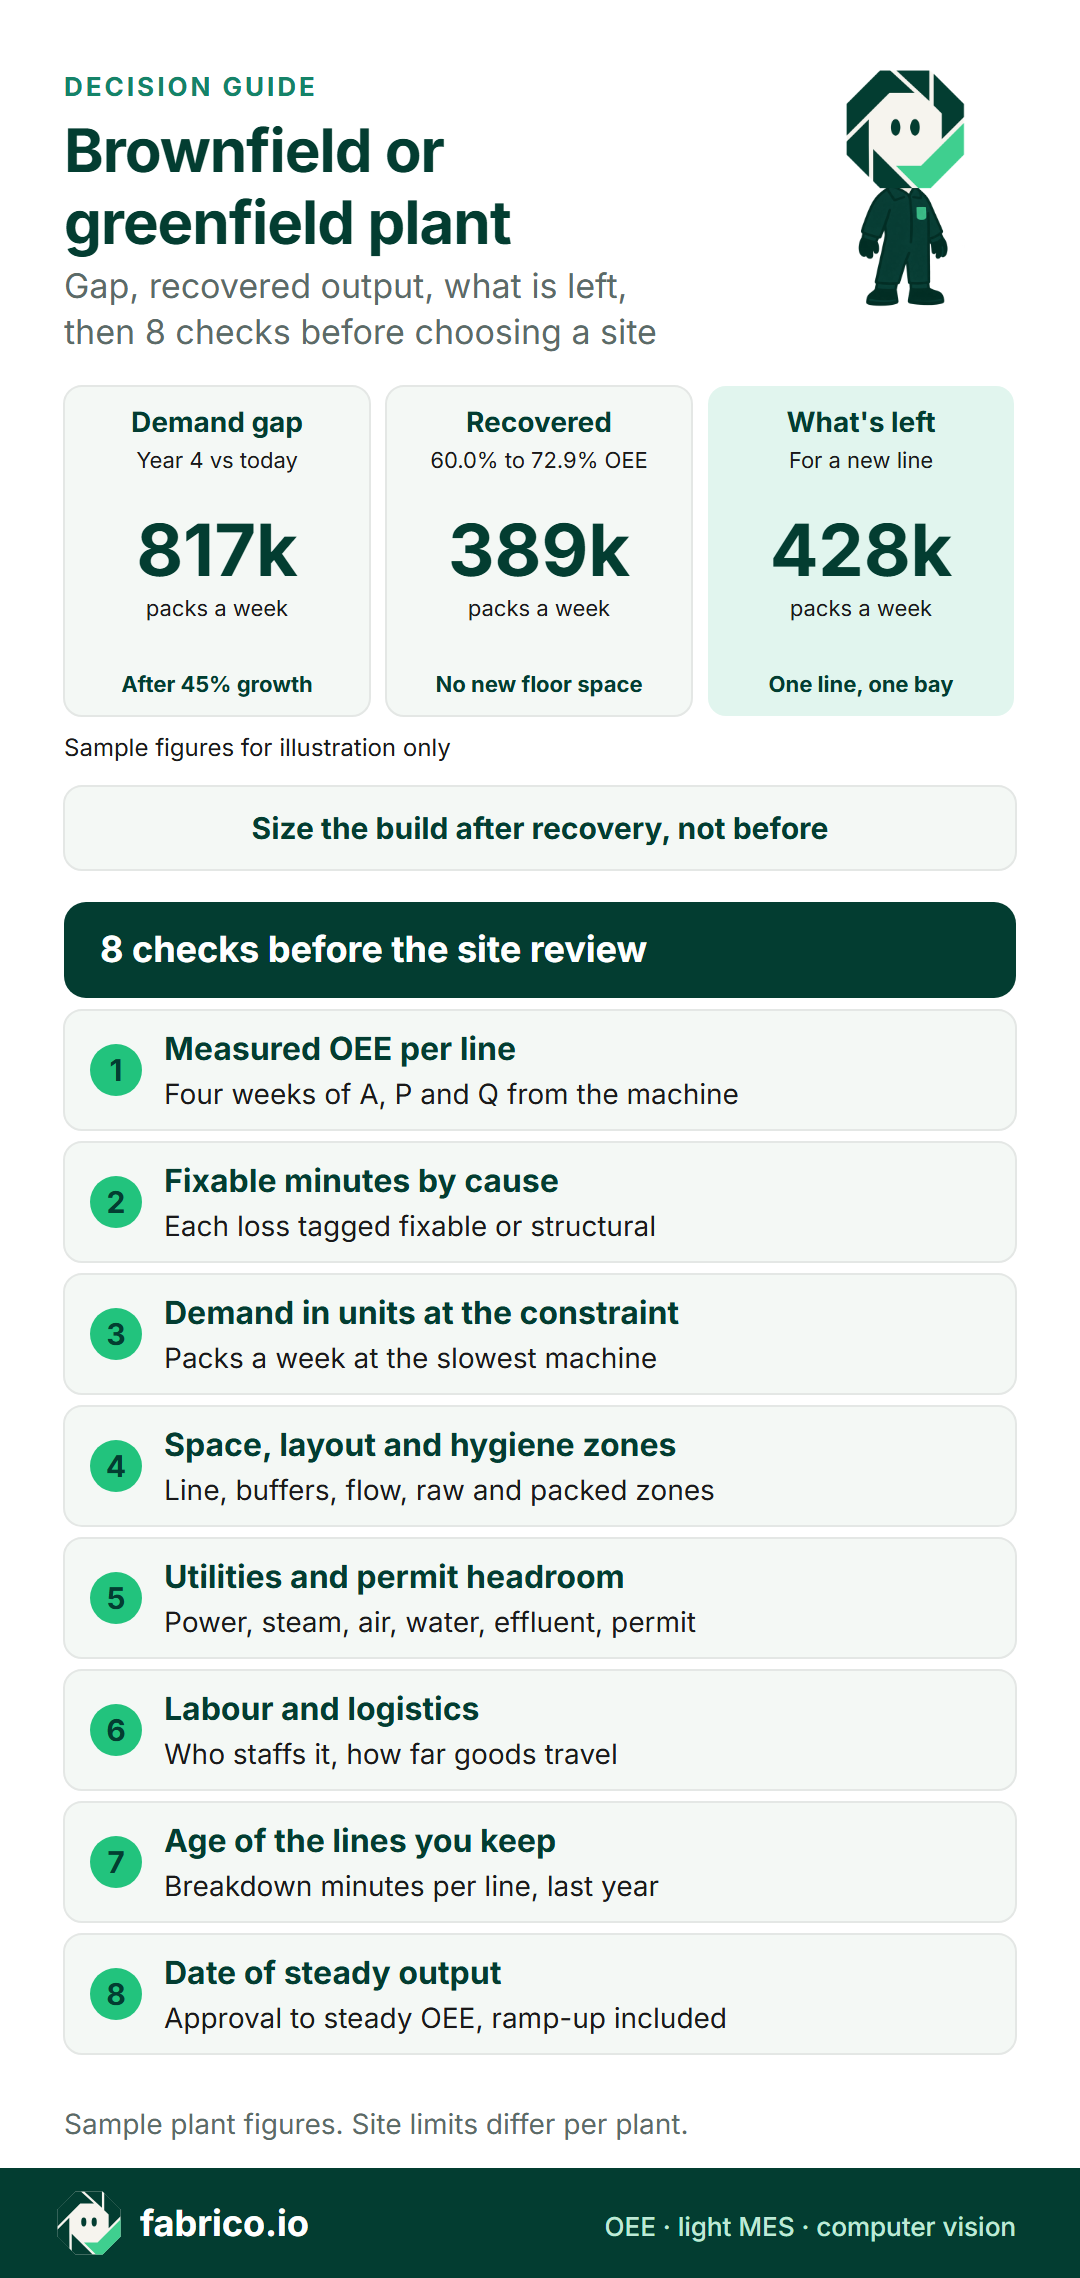
Text version of this infographic
- Title: brownfield or greenfield plant.
- Gap, recovered output, what is left, then 8 checks before choosing a site.
- Sample figures for illustration only.
- Demand gap: 817k packs a week between year 4 demand and today, after 45% growth.
- Recovered: 389k packs a week by raising OEE from 60.0% to 72.9%, with no new floor space.
- What is left: 428k packs a week, enough for one new line, which fits one bay.
- Size the build after recovery, not before.
- Sample plant figures. Site limits differ per plant.
- Eight checks: Measured OEE per line: four weeks of A, P and Q from the machine; Fixable minutes by cause: each loss tagged fixable or structural; Demand in units at the constraint: packs a week at the slowest machine; Space, layout and hygiene zones: line, buffers, flow, raw and packed zones; Utilities and permit headroom: power, steam, air, water, effluent, permit; Labour and logistics: who staffs it, how far goods travel; Age of the lines you keep: breakdown minutes per line, last year; Date of steady output: approval to steady OEE, ramp-up included.
What to do this week and this quarter
- Start the clock: connect or log the constraint on each line now, so the OEE record in check 1 is ready by the site review.
- Rank the old lines: pull last year's breakdown minutes per line, so the line that might be replaced in place is known.
- Tag the losses: in one meeting, mark each loss fixable or structural and give each fixable one an owner.
- Read the utilities: ask engineering for peak readings of power, steam, air, water and effluent against the supply limits.
- Restate demand: ask finance for the forecast in packs a week at the constraint, by year.
This quarter: run the recovery plan on one line for 8 to 12 weeks. If it lands near the halfway case in the worked example, size the build on that figure, not on the full target.
What Fabrico measures before a capacity decision
The site review needs a capacity number taken from the lines, not from the plate. Fabrico, OEE and light MES software, supplies that measured side:
- Sites on one screen: the multi-plant view puts plants side by side, with reports that compare them, so the site that would host the new line is judged on the same OEE as its sisters.
- The fixable share: downtime by cause, machine and shift over a past period, with causes picked by operators at the line and micro-stops taken from the machine signal.
- The oldest line too: Fabrico reads automated lines from the PLC and fits an IoT device with sensors to older ones, so old and new lines sit in one comparison.
- Manual packing after a line: where no machine signal exists, the camera add-on counts packs into the same OEE figure as connected machines.
- Figures for the business case: losses shown in money; lists go to Excel or CSV, or out through the REST API.
The full feature list is in the OEE and MES overview, the scope in light MES explained, and the camera add-on in the computer vision add-on page. Choosing a vendor is its own step: how to judge OEE software. Food and FMCG readers can go on to MES in food plants, light MES at a mid-size FMCG site or computer vision on FMCG lines.
Questions boards ask about brownfield and greenfield
What is the difference between brownfield and greenfield manufacturing?
Brownfield means adding capacity on a site that already exists: a new line in an empty bay, an extension or a refit. Greenfield means a new plant on land with no plant on it. In US environmental law, a brownfield is also land whose reuse may be complicated by actual or potential contamination, so check which meaning a document uses.
Is a brownfield expansion always faster than a greenfield plant?
Not always. It can avoid buying land and may need only a change to the existing permit, but building work beside running lines needs shutdown windows, and utilities can set limits that take time to lift. Compare dated plans for both options.
How much of the gap can recovery close before choosing a site?
There is no general figure. Measure four weeks or more of OEE per line from the machine signal, tag each loss as fixable or structural, and count only the fixable part.
Should the new line's OEE in the business case match the existing lines?
No. A new line starts lower and climbs as faults are fixed and crews learn it. Use a first-year figure below the site's measured OEE and plan the climb, as the guide to a new line ramp-up plan sets out.
Can old lines without a usable PLC signal be measured before the decision?
Yes. On older machines a Fabrico IoT device with sensors supplies the production signal, and at manual stations the camera add-on counts the output instead.
Who should own the capacity number in a site decision?
Operations owns the measured OEE and the recovery plan, and finance owns the demand case and the business case. Both sign one units-a-week figure before sites are compared.
Want to see measured OEE from a connected line laid out the way a capacity study needs it? Book a demo.
Related articles




Latest from our blog


Real Fabrico tiles, sample data.