


 Login
 Blog
Kepware vs Litmus: Connectivity Server or Edge Data Platform?

In short: Kepware vs Litmus compares a connectivity server with an edge data platform. Kepware, now part of Velotic, offers a common connectivity layer for PLCs and devices: Kepware Server reaches controllers through 150+ drivers and serves their data as OPC UA and MQTT. Litmus Edge, per its documentation, is an industrial edge data platform: it collects device data, models it and runs flows and analytics on site, managed from Litmus Edge Manager.
- They can stack: Kepware Server serves OPC UA, and Litmus documents Litmus Edge running as an OPC UA client or server.
- Comparable OEE across plants needs one stop-code list and one rule for planned time, held in a layer above both.
A group engineering lead looks after six plants. Two already run Kepware Server beside the packing lines, the other four have mixed controllers and no shared data layer, and head office wants OEE it can compare plant to plant. One proposal says "standardise on Kepware", another says "put Litmus Edge in every plant". The products meet at the controller, then answer different questions: how to get a value off a machine, and what to do with it before it leaves the site.
Vendor facts come from velotic.com, home of the Kepware product pages, and from litmus.io and docs.litmus.io, all checked on 13.11.2026 and linked in place.
Kepware vs Litmus in one table
Each cell links to the vendor page that states it, as of 13.11.2026.
Two products at different heights in the stack
Velotic's Kepware overview page states that Kepware is now part of Velotic and stays open and interoperable between OT and IT. It frames Kepware as a common connectivity layer that helps manufacturers standardise how operational data is collected across equipment, lines and sites, through three products: Kepware Server, Kepware Edge and Kepware+ Manager.
Litmus places its product a step higher. The Litmus Edge product page puts it where machines meet enterprise systems, and the Litmus Edge documentation describes a platform to collect, analyze and act on real-time data at the edge.
In ISA-95 terms, as isa.org sets them out, Level 2 covers the monitoring and supervising of physical processes, and Level 3 covers MES and other systems that manage manufacturing operations. Both products carry Level 2 data upward; OEE is Level 3 work (guide to the ISA-95 levels).
Job by job, from the controller to the fleet
Reaching the controller
This is the centre of Kepware's pages. The Kepware Server page says the server connects old and new devices through 150+ drivers and customisable interfaces, and hands their proprietary data on as normalised data ready for applications. The Kepware Edge page names drivers for Siemens S7 Ethernet, Allen-Bradley ControlLogix Ethernet and Modbus Ethernet.
Litmus collects data as well. Its data connectivity page describes a library of native drivers, automatic identification of assets on the network, and tag discovery to browse and organise signals at scale. The DeviceHub documentation says each device register is mapped to a Litmus Edge tag, and names Siemens, Allen Bradley and Hitachi as examples of supported makers. Hand both vendors the same controller models and ask for an answer per machine.
Handing data to other software
Per Velotic's Kepware Server page, the server turns proprietary device protocols into OPC UA and MQTT, sends device data to MES, SCADA, AWS and Azure applications, and works with ODBC-compliant databases. Litmus's Integration documentation describes publishing data from Litmus Edge to third-party connections, among them cloud providers, databases and MQTT message brokers, and subscribing to data that comes back. Its OPC UA documentation says Litmus Edge is deployed either as an OPC UA server or as an OPC UA client when it handles OPC UA devices.
Both standards are open. For OPC UA, the OPC Foundation says its information modelling framework turns data into information. The MQTT site calls MQTT an OASIS standard messaging protocol for IoT, built as a very light publish/subscribe transport. Our OPC UA vs MQTT guide compares the two.
Shaping data and running logic on site
The Litmus Edge feature list includes data normalisation and schema consistency, reusable machine and line data models, and a Docker-based application runtime. Flows are built in Node-RED, per the Flows Manager documentation, and pull from DeviceHub, databases, enterprise systems and files. The Analytics documentation chains processors into analytics flows on site, with built-in KPIs, statistical functions and TensorFlow models for prediction, classification and anomaly detection. Velotic's pages centre on normalised device data and on the applications that receive it, such as MES and SCADA: one consistent tag source for whatever reads it.
Managing a fleet of sites
Both vendors offer a central plane. The Kepware+ Manager page describes a SaaS platform hosted on Velotic cloud to monitor, configure and troubleshoot Kepware Server and Kepware Edge remotely, see which version each instance runs, and scale server configurations across lines, sites and the enterprise. On the Litmus side, the Litmus Edge Manager page offers one control plane for Litmus Edge installs spread over many sites, reusable deployment templates for standardised onboarding, grouped or scheduled over-the-air updates, and versioned data models across projects and sites.
Where the software runs
The Kepware Server card reads industrial connectivity for Windows. Kepware Edge is Linux-based and deployed via a container. Litmus Edge runs on site. For the trade-offs, see our doing the work at the edge or in the cloud guide.
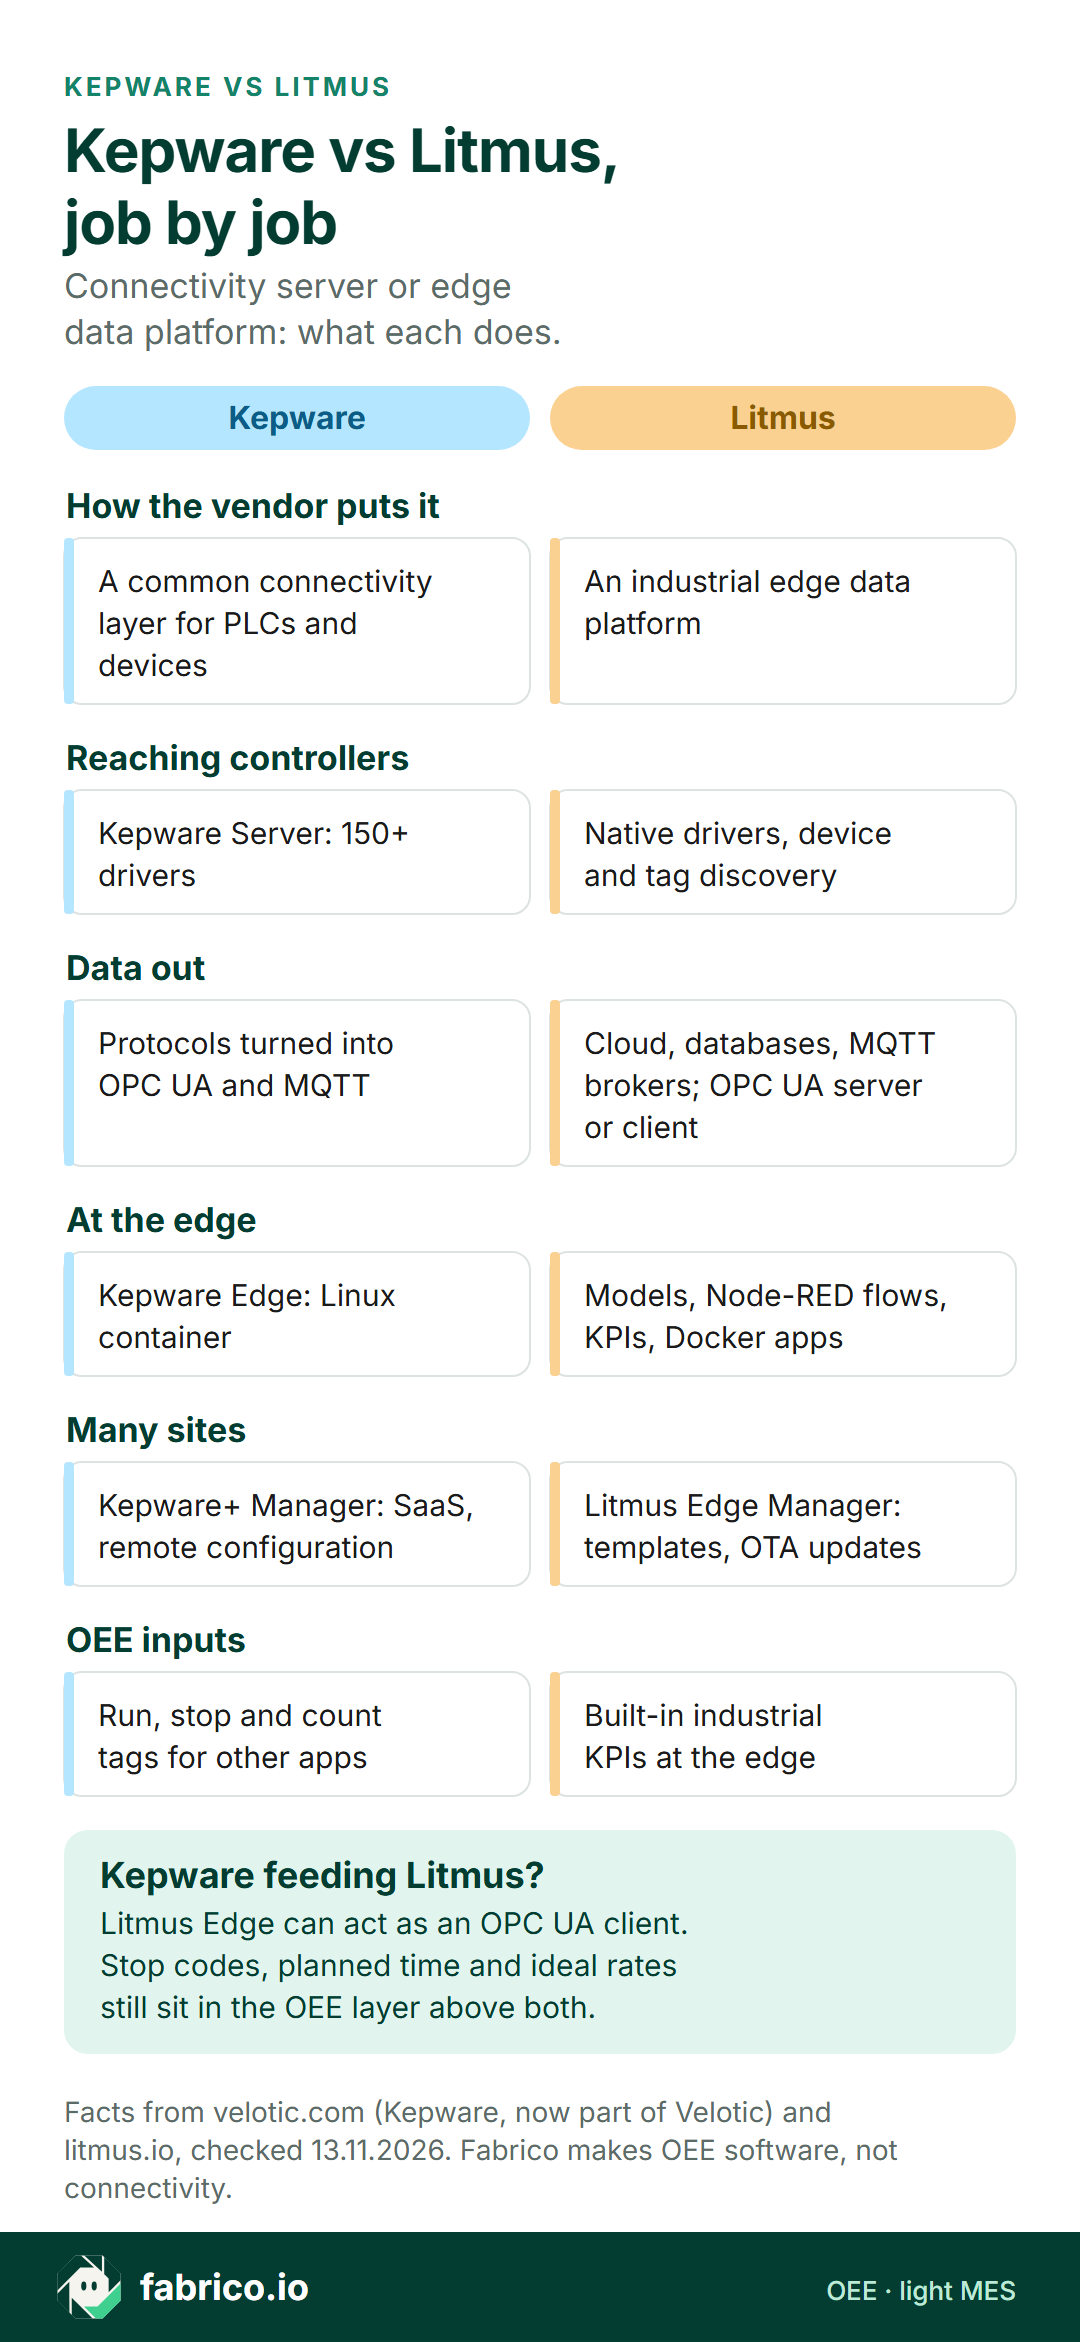
Text version of this infographic
- How the vendor puts it. Kepware: a common connectivity layer for PLCs and devices. Litmus: an industrial edge data platform.
- Reaching controllers. Kepware: Kepware Server, 150+ drivers. Litmus: native drivers, device and tag discovery.
- Data out. Kepware: protocols turned into OPC UA and MQTT. Litmus: cloud, databases and MQTT brokers; OPC UA server or client.
- At the edge. Kepware: Kepware Edge in a Linux container. Litmus: models, Node-RED flows, KPIs and Docker apps.
- Many sites. Kepware: Kepware+ Manager, SaaS and remote configuration. Litmus: Litmus Edge Manager, templates and OTA updates.
- OEE inputs. Kepware: run, stop and count tags for other apps. Litmus: built-in industrial KPIs at the edge.
- Kepware feeding Litmus? Litmus Edge can act as an OPC UA client. Stop codes, planned time and ideal rates still sit in the OEE layer above both.
Kepware alone, Litmus alone, or Kepware feeding Litmus
Three setups come up in multi-site projects.
| Setup | What it looks like | Check with the vendors |
|---|---|---|
| Kepware alone | Kepware Server or Edge serves tags to MES, SCADA or cloud | Which application models the data and runs the logic |
| Litmus alone | Litmus Edge reads the controllers through its own drivers | Driver coverage per controller model |
| Kepware feeding Litmus | Kepware serves OPC UA; Litmus Edge reads it as a client | Who owns tag names and who supports the link |
The third suits a plant where Kepware Server is already installed and trusted: the drivers stay, and modelling and edge logic go on top. Give each shared tag one named owner. If Ignition is also on the list, our Ignition vs Kepware comparison covers that pair, and our roundup of Litmus Edge alternatives looks at other edge platforms.
Match the first job to the product
- If the first job is reaching many controller models and serving clean tags to software the plant already runs, look at Kepware Server or Kepware Edge.
- If it is modelling data the same way at many sites and running flows or analytics on site, look at Litmus Edge with Litmus Edge Manager.
- If it is central control of many installs, compare Kepware+ Manager and Litmus Edge Manager on the same site list.
- If the plant needs both, look at Kepware Server serving OPC UA and Litmus Edge reading it as a client, side by side.
- If it is comparable OEE with stop causes, look at the layer where operators record causes: an OEE or light MES application above the data layer.
Where OEE and stop codes sit in a multi-site stack
A tag can show that the capper halted at 06:15. OEE also needs planned time, an ideal rate per product, a reject count and the reason for the loss, and across plants, one rule for what counts as planned.
| OEE input | Usual source | Comparable across plants when |
|---|---|---|
| Machine running or stopped | PLC tag via Kepware or Litmus Edge | The edge template names it the same |
| Output count | Counter tag, sensor or camera | One tag name per line type |
| Rejects | Reject count from the inspection system | One rule for rework |
| Planned time | Shift calendar in the OEE layer | One planned-stop rule |
| Ideal rate | Product standard in the OEE layer | One source of rates |
| Stop cause | The operator, from a set list | One group code list |
Whichever system computes the figure, a group that compares plants needs one owner for the stop-code list and one rule for planned stops. Without that, the same changeover is a loss in one plant and planned time in the next, and the league table measures coding habits.
Worked example: six plants, one edge template, two coding habits
Sample figures for illustration only; no real plant or product screen. A group runs the same packing line type in six plants, A to F. One edge template gives all six the same tag names for run state, count and rejects, through Kepware, Litmus Edge or both. Each plant reports a 480 minute shift with 30 minutes of breaks: 450 planned minutes, and at an ideal 50 packs a minute, 22,500 packs possible.
The tags agree; the stop codes do not. Plants C and E code changeovers as "planned setup" and take those minutes out of planned time. The other four count them as downtime, the group rule.
| Local code | Plants | Group code |
|---|---|---|
| Planned setup | C, E | Changeover, counted as downtime |
| Size change | A, D | Changeover, counted as downtime |
| Format change | B, F | Changeover, counted as downtime |
| Lunch break | All six | Planned break, outside planned time |
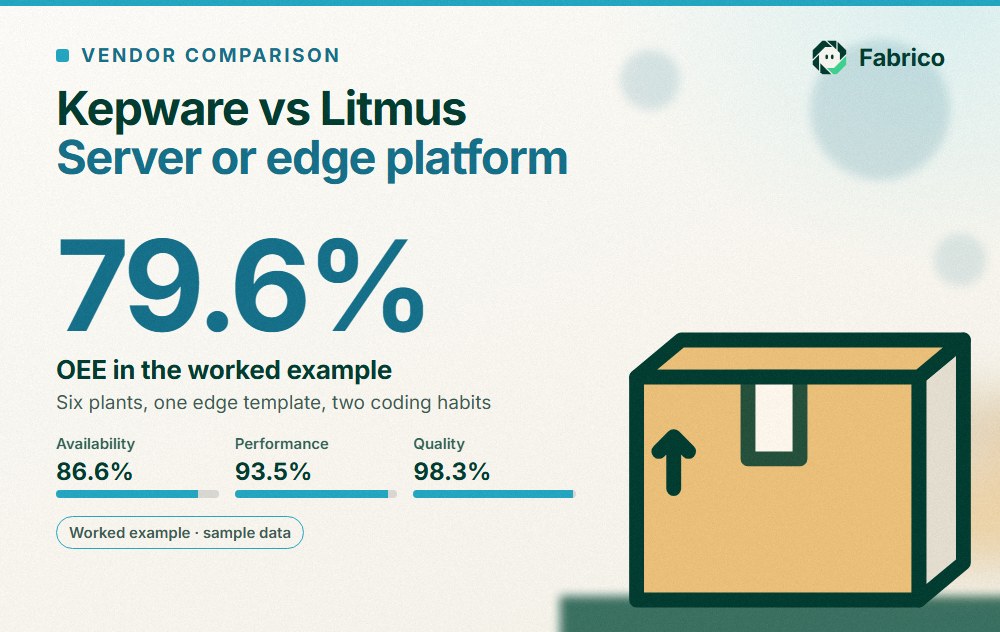
Plant C on local codes. The run tag shows 95 minutes stopped, 40 of them coded as planned setup. Planned time becomes 450 minus 40 = 410 minutes, and run time is 410 minus 55 = 355 minutes, so availability is 355 / 410 = 86.6%. In 355 minutes the ideal is 17,750 packs; the counter shows 16,600, so performance is 93.5%. Inspection rejected 280, leaving 16,320 good, so quality is 98.3%. OEE is 86.6% x 93.5% x 98.3% = 79.6%, which matches 16,320 good of 20,500 possible.
Plant C on group codes. The 40 changeover minutes go back into downtime. Availability is 355 / 450 = 78.9%; performance and quality stay put. OEE is 78.9% x 93.5% x 98.3% = 72.5%, or 16,320 good of 22,500 possible (how OEE is calculated).
| Plant | OEE, local codes | OEE, group codes | Rank, local to group |
|---|---|---|---|
| A | 77.8% | 77.8% | 5th to 3rd |
| B | 80.7% | 80.7% | 2nd to 1st |
| C | 79.6% | 72.5% | 3rd to 6th |
| D | 75.3% | 75.3% | 6th to 4th |
| E | 82.4% | 74.1% | 1st to 5th |
| F | 78.7% | 78.7% | 4th to 2nd |
On the group list, changeover becomes the largest loss across the six plants: 182 of 461 stopped minutes, against 97 of 376 visible minutes before. The edge layer did not change; the improvement plan did.
Fabrico for a group buying data for many plants
Fabrico does not sell connectivity servers, edge data platforms, DataOps, SCADA or HMI. It is cloud OEE software with a light MES: the layer where the stop cause is recorded and OEE is calculated by line and shift.
- Signal in. Our machine connectivity page lists PLC links over OPC UA, Modbus, PROFIBUS, PROFINET, EtherNet/IP and EtherCAT, with MQTT in the wider protocol list; a Fabrico IoT device with sensors goes on older machines. The route for each machine is agreed when the project starts.
- Stations with no signal. At manual steps, and on machines that give no usable signal, the camera add-on counts finished output. Supervisors can open camera add-on video for a point on the shift timeline; it is streamed live on request, with no copy kept by Fabrico in the standard setup. Roadmap: a camera add-on that offers a likely stop reason. More on the camera add-on page.
- Causes and losses. Operators choose the stop reason on a phone or tablet beside the line; Fabrico then shows OEE and downtime, with a money value on the losses, by line and by shift, in the browser and the iOS and Android apps (MES and OEE overview).
- Data out. Pull by REST API, push by webhooks, or export to Excel or CSV for group reporting.
If some of the six sites still pack by hand, the edge template has no tag to read there; our guide to cameras on FMCG lines shows where the camera add-on takes that count instead. Book a demo to see stop causes, OEE by line and the group export in Fabrico.
Questions to put to both vendors
- Which of our controller models do you reach today, and through which driver? Send both the same list.
- If Kepware Server feeds Litmus Edge over OPC UA, who supports the link when data stops?
- Where do tag names and data models live, and how does a change reach six plants?
- How is a site template rolled back if a change breaks one plant?
- What is buffered on site when the link to the cloud drops, and for how long?
- How are certificates and user access handled between controllers, the edge and the cloud?
- Which OEE inputs will arrive as tags, and which system owns planned time, ideal rates and the stop-code list?
Checks for the OEE layer itself are in our OEE software buyer guide; PLC vs SCADA vs MES shows how the layers stack.
What people ask next
What is the difference between Kepware and Litmus?
Velotic describes Kepware as a portfolio of industrial connectivity solutions, with Kepware Server reaching devices through 150+ drivers and converting their protocols into OPC UA and MQTT. In the Litmus docs, Litmus Edge is an industrial edge data platform: it collects data too, then models it, runs flows and analytics on site and publishes it on.
Can Litmus Edge read data from Kepware Server?
On paper the pieces fit. Kepware Server converts device protocols into OPC UA, and Litmus documents Litmus Edge deployed as an OPC UA server or OPC UA client. Ask both vendors for a tested setup with the controller models in scope.
Does either one calculate OEE?
The Litmus Edge page names built-in industrial KPIs, and Velotic says Kepware Server sends device data to applications such as MES and SCADA. Plant-to-plant OEE still depends on planned time, ideal rates and a shared stop-code list, so decide which system owns them.
Where should the stop-code list live in a multi-site project?
In the system where operators record causes and the official OEE figure is calculated, with one owner for the group list. The edge template keeps tag names the same; the code list keeps the meaning of a stop the same.
Does Fabrico replace Kepware or Litmus?
No. Fabrico is cloud OEE software with a light MES, not a connectivity server or an edge data platform. It reads stops and counts from a PLC, a sensor or a counter, operators give the reason at the line, and data can be pulled by REST API, pushed by webhooks or exported to Excel or CSV.
Want comparable OEE and stop causes on top of the data layer you pick? Book a demo.
Related articles

Latest from our blog


Real Fabrico tiles, sample data.