


 Login
 Blog
Make or Buy Decision in Manufacturing: Co-Packer or In-House Line

In short: a sound make or buy decision in manufacturing compares the co-packer against your in-house line at its measured OEE, not its nameplate speed, and then picks make, buy or a split from the hours gap.
- Measure four things first: real OEE, hidden capacity in availability and performance, changeover cost per SKU and start-up waste.
- Compute the hours the volume needs at the measured rate and set them against planned hours.
- Make if the hours fit, buy if they do not and nobody owns the gap, split if the gap is small, seasonal or owned.
- Put both routes on the same cost items and review the decision on a fixed date.
The co-packer's offer is on the desk, and the first spreadsheet divides the annual volume by the line's nameplate speed. On paper the in-house line has room. The real question is how many good packs it makes in a planned hour, and that number comes from the line, not the machine's data plate. We build Fabrico, an OEE and light MES platform, so this guide comes from a vendor and covers the measurement side of the choice; the commercial terms are yours to judge.
If you already work with a co-packer, these related pages cover what this one does not: line-level OEE for co-packers, OEE terms in co-packing agreements, contract packaging software and computer vision for co-packers.
Outsourcing vs in-house production: what the choice turns on
A 2020 paper in the Journal of Industrial Engineering and Management, built on a literature review, practitioner interviews and an in-firm case study, frames the choice as making in-house, buying from external providers or combining both. That third route matters for food and FMCG brands: a split between the in-house line and a co-packer is a normal answer, not a failure to decide.
Researchers at the University of Cambridge's Institute for Manufacturing built a structured method for the same question and report that their make-or-buy methodology was developed and tested in eight companies. Decide by a method the team can repeat at the next review, not by the first quote.
Spare capacity is the first argument for bringing volume in. The US Federal Reserve's October 2026 release put US manufacturing capacity utilization at 75.9 percent in September 2026 (a preliminary figure), 2.3 points below its 1972 to 2025 average. It covers all US manufacturing and is not OEE, so measure what the in-house line can really absorb.
What you see: a shift timeline, unclassified time waiting for a reason, and the operator's line-down screen, on sample lines.
Plays from YouTube. Google may set cookies when you press play. Privacy policy.
Measure the in-house line first: four numbers
The make or buy decision in production management rests on four measured numbers from the constraint, the machine that sets the line's rate:
- Real OEE: availability x performance x quality, from machine data over at least one full cycle of the normal SKU mix. Our guide to OEE calculation sets out the conventions used here.
- Hidden capacity: the planned minutes lost to stops (availability) and to slow running and short stops (performance). This is the time you could win back without new equipment; see finding hidden capacity in availability and performance and how reduced speed differs from minor stops.
- Changeover cost per SKU: changeover minutes x nameplate rate gives the packs of capacity each change costs. A 35-minute change at 100 packs a minute costs 3,500 packs of capacity before any scrap. More SKUs on the line means more changes; sequencing by changeover cost shows how the order affects it.
- Start-up waste: the packs rejected or run slow after each start and change. Keep them in the quality and performance figures; see start-up loss vs reduced yield.
Treat the gap between nameplate and real output as something to explain, the way national statistics do. The US Census Bureau's quarterly survey of US manufacturing plants collects the primary reasons for actual production being less than full production capacity each quarter. A make or buy review needs the same thing at line level: which losses, how many minutes, and who owns each one. The difference between the two capacity figures is covered in nameplate capacity vs real capacity.
Make, buy or split: the decision table
| Signal | Make | Buy | Split |
|---|---|---|---|
| Hours at measured OEE vs planned | Fit with margin | Short all year | Short at peaks or slightly |
| Losses in the gap | Not needed | No owner or plan | Owned, dated plan |
| Demand pattern | Steady | Volatile, unforecast | Seasonal peaks |
| Changeover load from new SKUs | Few extra changes | Many short runs | Long runs in, short runs out |
| Process and skills | On the in-house line | Only at the co-packer | Base SKUs in, special ones out |
| Equipment needed | None | A new line | None for the base volume |
| Cost or effort (sample) | Own variable cost for the hours at measured OEE, plus the loss plan: 3 people for 4 hours a week over 12 weeks, 144 hours x EUR 40.3 = EUR 5,803.20. Saves the co-packer's premium, EUR 252,480 a year at 66.0% | The co-packer's price, EUR 0.45 a pack in the sample, about EUR 0.048 above own variable cost; no capital or loss plan, but minimums, notice and exit cost | The premium saved only on packs that fit: EUR 200,640 to EUR 252,480 a year at 61.0% to 66.0% OEE, plus a review at each volume step |
The cost row uses one sourced rate, labour at the euro-area industry figure of EUR 40.3 an hour from Eurostat (cited in the cost lines section below), and prices the co-packer premium at the food processing margin range worked out in the example. Power, at Eurostat's EUR 0.1800 per kWh, belongs in your own variable cost for the hours, so add it there. Everything else is a sample figure; swap in your own.
Make if the hours needed for own and co-packed volume, computed at measured OEE, fit the planned hours with a margin for peaks, the extra SKUs add few changeovers, and the line already has the process the product needs.
Buy if the hours do not fit across the year, the losses that would close the gap have no owner or plan, or closing it would take new equipment. Weigh that case with new line cost vs recovering capacity. If you keep the co-packer, the agreement side is covered in OEE in co-packing agreements.
Split if the gap is small, seasonal or limited to a few SKUs, or if a measured loss plan will close it on a known date. The base volume moves in now; peaks and short runs stay out until the next review.
Questions to put to the co-packer and your own team
- Co-packer: can the price per pack be split into conversion, materials and freight, so each part can be set against your own cost lines?
- Co-packer: what minimum volumes, notice period and exit cost apply if volume moves back in steps?
- Co-packer: which output and reject terms will it sign, and measured at which point? See OEE in co-packing agreements.
- Finance: what premium over own variable cost does the offer imply, and does it sit inside the food processing margin range?
- Your production team: which three losses close the hours gap, each with an owner, a target in minutes and a date?
- Your OEE or MES software vendor: can stop minutes by cause be exported per SKU, as CSV or through an API, into the hours model?
- Your production team: how much stop time has no reason? Above a fifth, the record is too thin to decide on.
- Planning: where does peak volume go, and on which date is the decision measured again?
Book a demo to see how a line's stop minutes become the hours figure this decision rests on.
Worked example: bringing 6 million packs back from a co-packer
Sample figures for illustration only. A snack brand makes 9 million packs a year on its own bagging line and buys 6 million more from a co-packer. The bagger is the constraint, rated at 100 packs a minute. Planned time is 2 shifts of 7.5 hours, 5 days a week, 48 weeks: 3,600 hours a year.
The nameplate view: 15,000,000 / (100 x 60) = 2,500 hours. That leaves 1,100 hours spare, so the spreadsheet says bring it all in.
The measured view: four weeks of machine data, covering a full SKU cycle, give availability 75%, performance 76% and quality 97%.
- OEE: 0.75 x 0.76 x 0.97 = 55.3%.
- Good packs an hour: 100 x 60 x 0.553 = 3,317.
- Hours needed: own volume 9,000,000 / 3,317 = 2,713 hours; co-packed volume 6,000,000 / 3,317 = 1,809 hours. Total 4,522 hours, 922 hours more than planned.
After recovering losses: the stop log shows long changeovers and slow running after starts. A dated plan with named owners targets availability 83% and performance 82%, with quality unchanged.
- OEE: 0.83 x 0.82 x 0.97 = 66.0%.
- Good packs an hour: 100 x 60 x 0.660 = 3,961.
- Hours needed: 15,000,000 / 3,961 = 3,787 hours, still 187 hours short.
- What fits: 3,600 x 3,961 = 14.26 million packs. After the 9 million own packs, 5.26 million of the 6 million can come in; about 0.74 million stay at the co-packer.
What the recovered capacity is worth: the co-packer charges EUR 0.45 a pack, a sample price. Its premium over the brand's own variable cost has to cover at least its own profit, so the sample prices the gap at a sourced margin: the NYU Stern margin dataset by industry (Aswath Damodaran, January 2026 data, 78 US food processing firms) shows a pre-tax operating margin of 10.63% and a gross margin of 23.23%. The sample takes the low end: EUR 0.45 x 10.63% = about EUR 0.048 a pack. A co-packer that also recovers its fixed costs from the price sits nearer the gross margin end, which makes making in-house worth more. Bringing 5.26 million packs in is worth about 5,260,000 x 0.048 = EUR 252,480 a year, but only once the line runs at 66.0%. At 55.3% the in-house line can take its own volume plus only about 2.94 million of the co-packed packs, less than half. The sample decision is a split now, with the 0.74 million packs reviewed when the loss plan is measured. For a full business case, see the OEE business case guide.
If changeovers run long: say the brought-in SKUs add 4 changeovers a week, 192 a year. If each takes 20 minutes longer than planned, that is 3,840 minutes, or 64 planned hours gone. While running, the line makes 100 x 60 x 0.82 x 0.97 = 4,772 good packs an hour, so the overrun costs 64 x 4,772 = 305,408 packs, or about EUR 14,660 a year. If the loss plan also stops at 61.0%, step 2 in the volume table further down, about 3.87 million packs fit instead of 5.26 million. Plan the later steps on that low case, and add volume only as measured weeks confirm the plan.
What goes wrong after volume comes back in
Five ways a make or split decision slips in its first quarter, and the sign to watch for each:
| What goes wrong | Early sign in line data | Fix |
|---|---|---|
| Hours sized on a good month | Hours needed above planned hours two weeks running | Re-baseline over a full SKU cycle; hold the next volume step |
| Loss plan slips | Availability flat for six weeks while the plan says it should rise | Re-date each owner's action; the next step stays at the co-packer |
| Short runs break up the week | Changeovers per week up, average run length down | Sequence by changeover cost; send the shortest runs back out |
| Start-up scrap grows | Quality in the first hour after a change below the shift average | Record settings per SKU; check the first packs after a change |
| Reasons stop being recorded | Stop time with no reason rising past a fifth of the total | Shorten the reason list; clear open stops at each shift start |
Put both routes on the same cost lines
A make or buy comparison is only fair when both sides carry the same cost items. An offer may arrive as one figure per pack, while the in-house figure is built from parts. List the same items on both sides before comparing:
- Conversion: labour, energy and line overhead for the hours computed at measured OEE, not at nameplate.
- Materials: who buys the film, cartons and ingredients, and at what volume.
- Contract: minimum volume commitments, notice period and exit cost, because they decide whether a split can move volume in steps.
- Waste: start-up scrap and changeover run-off on the in-house side, and the reject terms on the other.
- Freight and stock: transport between sites and the safety stock each route needs.
- Quality release: who tests, who signs off, and how long each batch waits.
- People: planners, buyers and quality staff the volume ties up on either side.
Labour and energy are where offers from different regions differ most, so price both from your own payroll and tariff. As a cross-check, Eurostat estimated average hourly labour costs of EUR 34.9 in the EU in 2025, across the whole economy, from EUR 12.0 in Bulgaria to EUR 56.8 in Luxembourg; in the euro area, industry was the highest paying sector at EUR 40.3 an hour, the closer figure for a plant. For power, Eurostat puts the EU average non-household electricity price at EUR 0.1800 per kWh in the first half of 2026, for medium users of 500 to 2,000 MWh a year, 5.4% lower than a year earlier. Rates move, so date each rate in the model.
Then cost only the volume that actually fits. In the sample above, the saving applies to 5.26 million packs, not 6 million, and only after the loss plan holds.
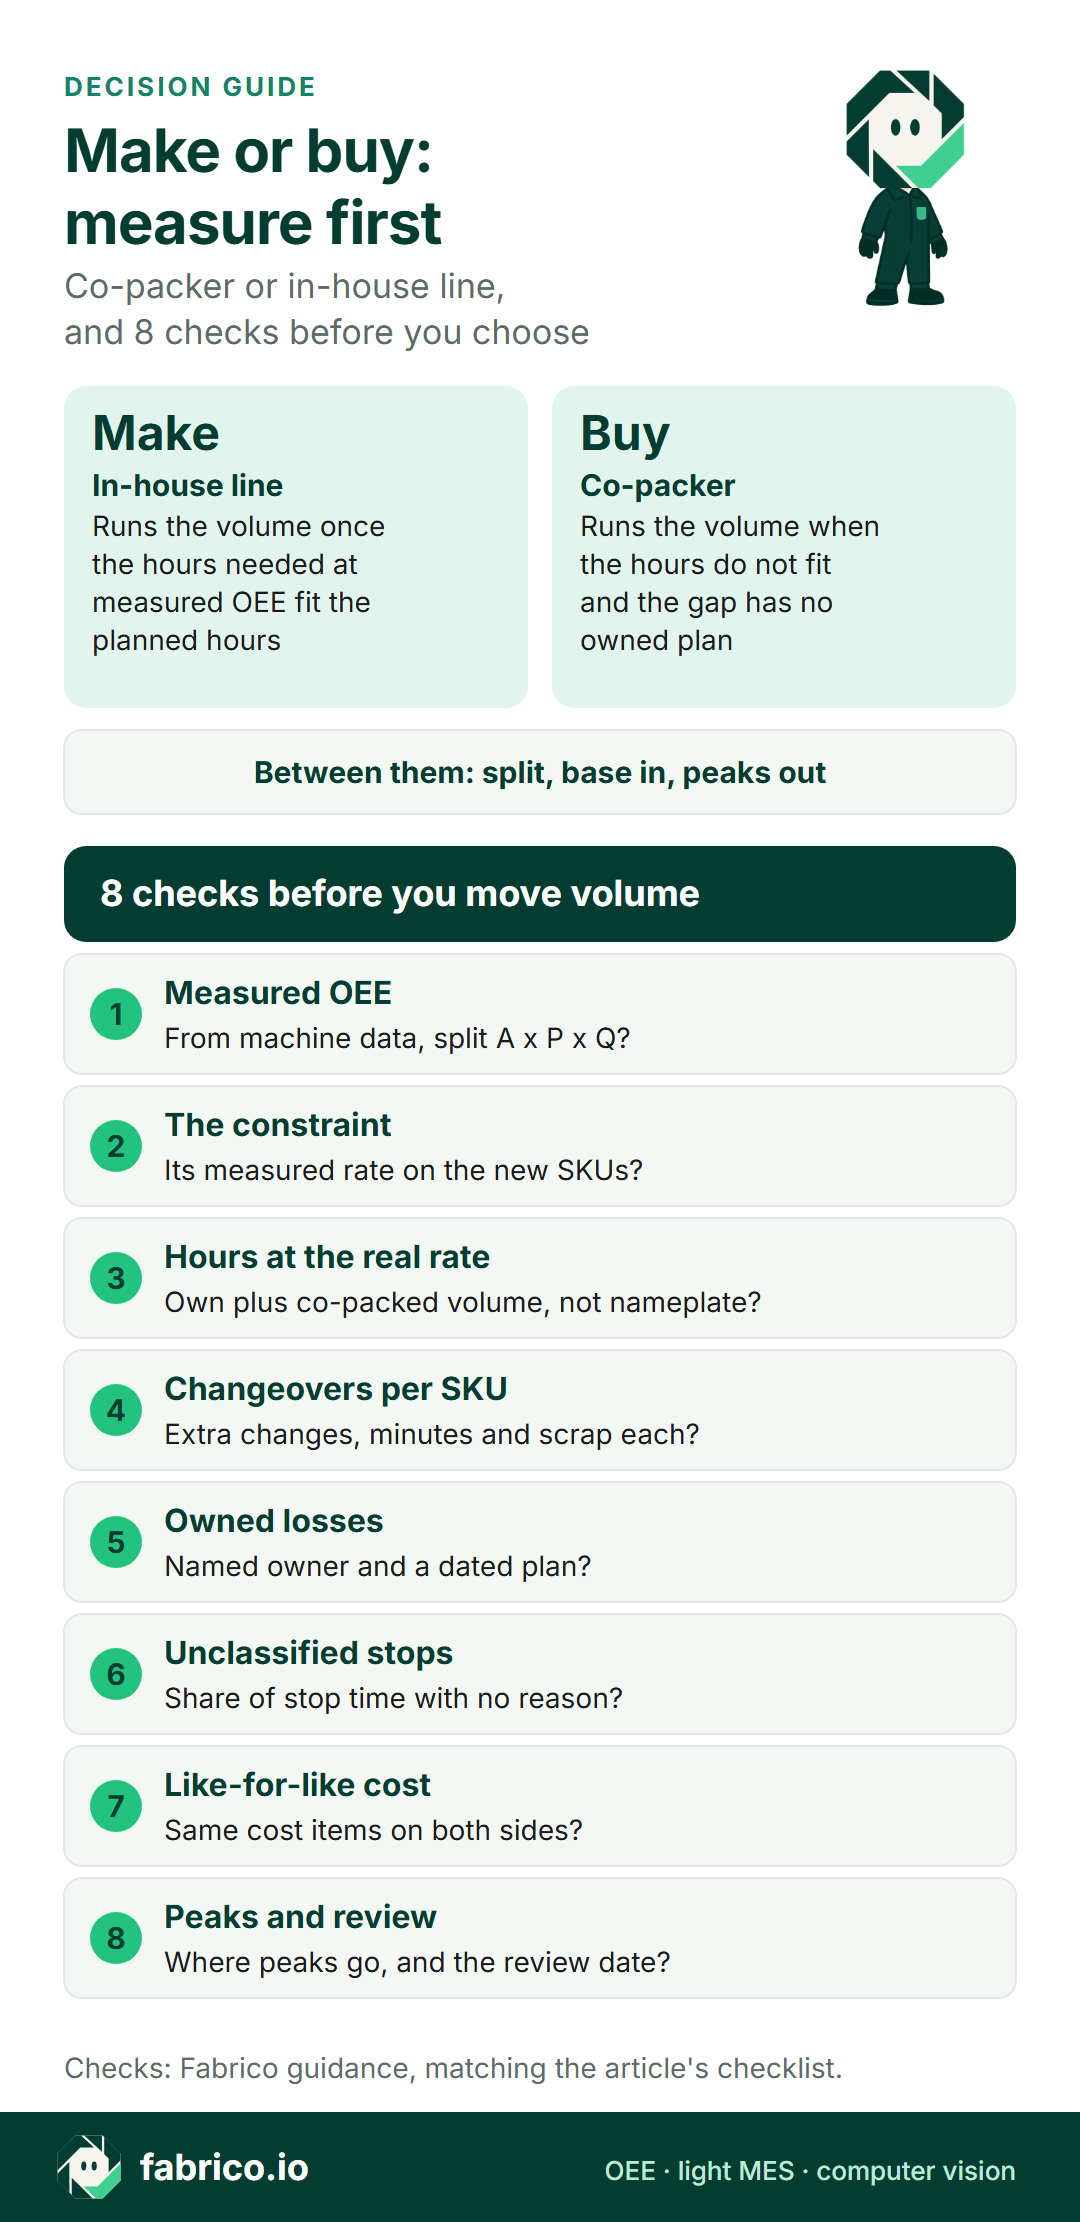
Text version of this infographic
- Card title: Make or buy: measure first. Co-packer or in-house line, and 8 checks before you choose.
- Make: the in-house line runs the volume, once the hours needed at measured OEE fit the planned hours.
- Buy: a co-packer runs the volume, when the hours do not fit and the gap has no owned plan.
- Between them: split, peaks or a few SKUs go out, the base volume stays in.
- 8 checks: measured OEE, the constraint, hours at the real rate, changeovers per SKU, owned losses, unclassified stops, like-for-like cost, peaks and review. Each is covered in the sections and questions above.
Testing the co-packer's offer: five days, then three volume steps
One week gives the review a measured footing:
- Monday: name the constraint for the SKUs in question and pull its last four weeks of stops, counts and rejects. Write availability, performance and quality as three numbers.
- Tuesday: total the stop minutes with no reason. If they pass a fifth of all stop time, fix reason capture for two weeks before trusting the hours figure.
- Wednesday: rebuild next year's volume plan in hours at the measured rate, own and co-packed together, month by month, so the peaks show.
- Thursday: put both routes on the cost lines above, with dated rates.
- Friday: list the three largest losses at the constraint, each with an owner, a target in minutes and a date.
Then bring the volume in steps. Each step waits until measured OEE has held the next gate for four weeks running:
| Step | Co-packed packs brought in, a year | Gate before the step | Premium saved, a year, at EUR 0.048 |
|---|---|---|---|
| 1, now | 2.94 million | Fits at today's measured 55.3% | about EUR 141,000 |
| 2 | 4.18 million | 61.0% held four weeks running | about EUR 200,000 |
| 3 | 5.26 million | 66.0% held four weeks running | about EUR 252,000 |
| Stays out | 0.74 million | Review at the next budget round | none |
Each step fills the planned hours. If peaks need margin, hold a step back.
How Fabrico supports a make or buy review
Fabrico measures the in-house line; the make or buy call stays with your operations and finance teams.
- OEE from the machine, not the shift report: Fabrico calculates OEE from data collected at the machine, through a PLC or an IoT device with sensors, so the hours calculation starts from measured availability, performance and quality.
- Losses by cause for the gap plan: operators record why the line stopped, using a tablet or phone, and the downtime view splits by cause, machine and shift for this week or a past period, the baseline a loss plan needs.
- The gap in money: losses are shown in money, and the OEE calculator prices the gap between current OEE and the target the decision needs.
- Manual packing after the line: hand-pack tables and bagging stations often have no usable signal, so the camera add-on counts their output, the manual-station option set out in the light MES guide. The camera add-on video for a stop minute is streamed on request and not stored in Fabrico. Suggested stop reasons from the camera add-on are roadmap work.
- Figures for the finance model: data leaves through the REST API and webhooks, and any list exports to Excel or CSV.
Before the review, read how the OEE and MES solution overview collects the line data, how the camera add-on for OEE counts hand-pack stations, and what MES for mid-size FMCG plants covers.
Questions buyers ask about make or buy
How do you make a make or buy decision in manufacturing?
Measure the in-house line first: OEE split into availability, performance and quality, changeover minutes per SKU and start-up waste. Then compute the hours the volume needs at that measured rate, compare them with planned hours, and choose make, buy or split from the gap and from who owns the losses that would close it.
What should be measured before bringing co-packed volume in-house?
Measured OEE at the constraint, the rate on the SKUs you would bring in, the changeovers those SKUs add, the start-up scrap after each change and the share of stop time with no reason. Cover at least one full cycle of the normal SKU mix.
Why not use nameplate capacity for the decision?
Nameplate assumes the line never stops, never slows and never makes a reject. In the sample on this page, nameplate says 2,500 hours and the measured rate says 4,522 hours for the same volume, which turns an easy fit into a shortfall.
When does outsourcing beat in-house production?
When the hours needed at measured OEE do not fit, the losses that would close the gap have no owner or plan, and the shortfall is spread across the year rather than at peaks. It can also win when the product needs a process or skill the in-house line does not have.
What does a split decision look like?
The base volume runs on the in-house line and a defined part stays with the co-packer: seasonal peaks, a few low-volume SKUs, or the share the line cannot reach until a dated loss plan closes. Review the split on a fixed date against the measured hours.
How often should a make or buy decision be reviewed?
On a fixed date, for example each budget round, and whenever volume, SKU count or measured OEE moves enough to change the hours calculation. Keep the same rules for planned time and counts, so the review compares like with like.
Want to test the co-packer's offer against measured hours? Book a demo to see how measured OEE turns a volume plan into line hours.
Related articles




Real Fabrico tiles, sample data.