


 Login
 Blog
Oil Mill Software: From Seed Intake to the Bottling Hall

In short: oil mill software is several products, not one. A seed crushing and edible oil refining plant runs commodity procurement and an ERP for seed contracts and lots, an intake and lab system for moisture, FFA and peroxide value, a DCS or SCADA for the presses, extractor and refinery, tank records and a WMS for oil in stock, and an OEE and light MES layer for the bottling hall. Edible oil refinery software is mostly process control; OEE starts where oil reaches the filler.
- Seed is bought by the tonne at a moisture and oil content basis, so intake readings and the ERP decide the crush margin.
- Pressing, solvent extraction and refining run around the clock under process control, with a historian holding temperatures, vacuum and flows.
- Lab results decide when crude or refined oil may move to the next tank. That record belongs to the lab.
- The bottling hall is discrete work: blow moulder, filler, capper, labeller and case packer. The sample worked example prices one 1 L shift there: 68.5% OEE, and EUR 375 a shift back from two fixes.
An oil mill is a continuous plant with a packing plant bolted on the end. Seed arrives by truck, gets weighed, sampled and dried, then goes through cleaning, cracking and conditioning to the expellers. Press cake goes on to solvent extraction, and the crude oil goes to the refinery. Only at the end does the work turn into bottles, caps and cases.
Crushers, refiners and bottlers need a map more than a feature list, because the right first purchase depends on where the plant loses money.
The USDA Economic Research Service says that for US soybeans, more than 80 percent of the crop is processed into soybean meal and oil through crushing. So every tonne of seed carries oil and meal, and the software stack books both.
Fabrico builds the OEE and light MES layer for the bottling hall, so that is where this page prices a shift in euros.
Oil mill software, system by system
Oil mill systems fall into three groups: those that price and track seed, oil and meal; those that run and prove the process; and the one that measures the hall's machines.
| System | What it does in an oil mill | Owner |
|---|---|---|
| Commodity procurement and ERP | Seed contracts, intake weights, crush margin, oil and meal sales, lots, costing | Trading, finance |
| Intake and weighbridge | Truck weights, moisture and foreign matter at intake, silo allocation | Intake team, lab |
| Lab system (LIMS) | Moisture, oil content, FFA, peroxide value, colour, residual solvent | QA lab |
| DCS or SCADA and historian | Expellers, extractor, desolventiser, degumming, neutralising, bleaching, deodorising | Process engineers |
| Tank records and WMS | Crude and refined oil tanks, cased oil, jerrycans, bulk dispatch | Logistics, QA |
| Quality system (QMS) | HACCP plan, audits, complaints, supplier approval | QA, food safety |
| OEE and light MES | Stops, counts and losses from blow moulder to case packer | Operations, CI |
The last row is the one that measures the line. It records when the blow moulder, filler, capper, labeller and case packer run and stop, how many bottles or cases each counts, and the reasons the crew gives for its stops, per machine and per shift. Availability, performance and quality come out of those three records, and so does the money a stopped minute costs.
What you see: a shift timeline, unclassified time waiting for a reason, and the operator's line-down screen, on sample lines rather than an oil mill. Book a demo.
Plays from YouTube. Google may set cookies when you press play. Privacy policy.
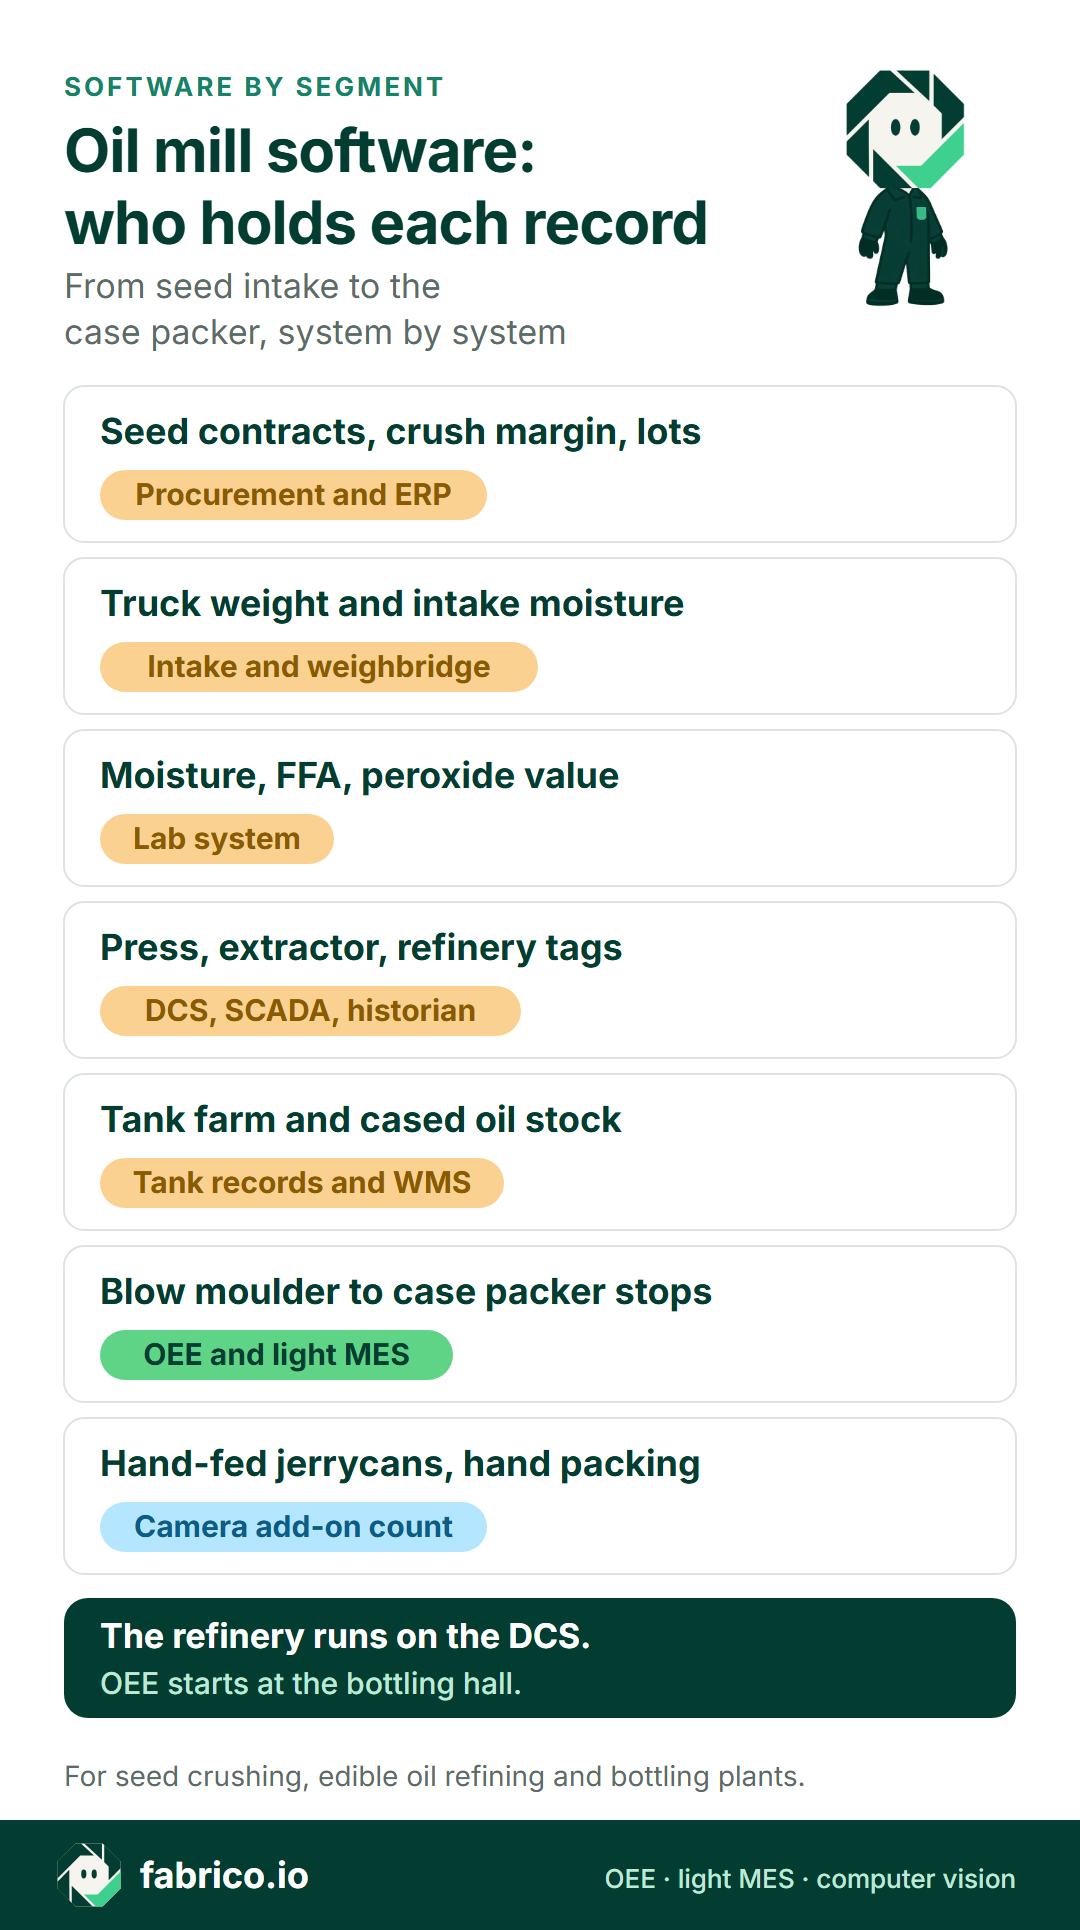
Text version of this infographic
- Seed contracts, crush margin and lots: procurement and ERP.
- Truck weight and intake moisture: intake and weighbridge.
- Moisture, FFA and peroxide value: lab system.
- Press, extractor and refinery tags: DCS, SCADA and historian.
- Tank farm and cased oil stock: tank records and WMS.
- Blow moulder to case packer stops: OEE and light MES, where Fabrico sits.
- Hand-fed jerrycans and hand packing: camera add-on count.
- The refinery runs on the DCS. OEE starts at the bottling hall.
Commodity procurement and ERP
This is where the crush margin lives: what the seed cost, what the oil and meal sold for, and what drying, solvent and energy took in between. In the standard board crush, a 60-pound bushel of soybeans yields 11 pounds of soybean oil, 44 pounds of 48 percent protein meal, 4 pounds of hulls and 1 pound of waste, as farmdoc daily at the University of Illinois sets out. That is about 18 percent oil by weight, our arithmetic, which is why meal matters as much as oil in the margin.
Seed contracts carry a basis for moisture and oil content, so the ERP needs the intake readings to settle each truck. For oilseed sunflower, a Purdue University extension guide to sunflower from the 1980s says the seed contains 38 to 50 percent oil, that purchasers and processors usually pay a premium over 40 percent oil and discount lots under it, and that an analysis for oil content is made of each sale before payment. Supply shifts reach the same contracts: the USDA Foreign Agricultural Service oilseeds circular of November 2026 reports that since July 2026, Argentina has been the dominant sunflowerseed oil supplier to India.
Intake, weighbridge and lab
At intake, the truck is weighed and sampled, and moisture decides whether seed goes to the dryer or straight to a silo. Later, the lab tests crude and refined oil for free fatty acids (FFA), peroxide value, colour and residual solvent. These results release or hold a tank, so the lab system must tie each result to a tank and a time, not to paper.
The benchmarks are public. The Codex Standard for Named Vegetable Oils (CODEX-STAN 210-1999), as published by FAO, lists in its appendix an acid value of 0.6 mg KOH/g for refined oils against 4.0 for cold pressed and virgin oils, and a peroxide value up to 10 milliequivalents of active oxygen per kg for refined oils against 15 for cold pressed and virgin oils. The appendix is meant for voluntary use between trading partners, and later revisions apply, so QA works from the current text and the customer specification.
Tank records and warehouse
Crude, neutralised, bleached and deodorised oil all wait in tanks between steps. Tank records show what is in each tank and its status. Once oil is bottled, a WMS takes over: cased oil on pallets, 5 L and 20 L jerrycans, and bulk oil leaving by tanker or IBC.
What edible oil refinery software covers
Refining is the most automated part of the plant. Degumming removes phosphatides, neutralising takes out free fatty acids, bleaching removes colour and traces, and deodorising strips odour under heat and vacuum. Physical refiners skip chemical neutralising and remove FFA in the deodoriser. All of it runs continuously, so the software is a DCS or SCADA that holds setpoints and a historian that keeps every tag.
This layer is usually bought with the refinery or from an automation integrator, and it answers to process engineers. Its numbers are tonnes an hour, temperatures, vacuum and oil loss. An OEE tool adds little here: there are no discrete cycles, and a slowdown is a process question, not a stop reason picked at a tablet. Where a DCS ends and an MES begins is set out in MES vs DCS.
Two rules show why the lab and the refinery records matter more than any line metric:
- Solvent residue. Directive 2009/32/EC on extraction solvents, as published on legislation.gov.uk, lists hexane for "Production or fractionation of fats and oils and production of cocoa butter" with a limit of 1 mg/kg in the fat or oil or cocoa butter. That proof comes from the lab, after extraction and desolventising.
- Contaminant limits. Regulation (EC) No 1881/2006 as retained in Great Britain, on legislation.gov.uk, sets 1 000 µg/kg for glycidyl fatty acid esters, expressed as glycidol, in vegetable oils and fats placed on the market for the final consumer or for use as an ingredient in food, with listed exceptions. EU plants should check the current EU text with their QA team.
Both limits are proven with lab results against refinery runs and tanks, not with a filler stop log.
The scale of a lost crushing hour is simple arithmetic. Sample figures for illustration only: a soybean plant crushing 2,000 tonnes a day handles about 83 tonnes an hour. At the board crush ratio of 11 and 44 pounds from every 60, one lost hour holds back about 15 tonnes of oil and 61 tonnes of meal. The process team owns that loss; the ERP prices it.
Bottling hall failure modes
A PET blow moulder that stops starves the filler, cold oil slows the fill, and the case packer and palletiser can block the whole line. Station rules per pack size are in OEE for edible oil bottling lines; planned work on expellers, the extractor and the hall machines is covered in software for vegetable oil refineries.
| Loss | Early sign in line data | Fix |
|---|---|---|
| Filler starved by the blow moulder | Filler stops while the filler itself is healthy, right after preform or oven alarms | Book starved by the blow moulder as its own reason and keep a bottle buffer between the two |
| Waiting for a released tank | Long stops at the start of a run, booked as no oil | A separate reason for tank release waits; plan releases with the lab before the run |
| Cold oil slows the fill | Bottles per minute under the ideal on early shifts and in winter, with no stop booked | Log oil temperature at the filler and agree a minimum with the tank farm |
| Capper jams and loose caps | Many stops under two minutes, rejects rising after a new cap lot | Log stops against the cap lot and check torque settings with the cap supplier |
| Labeller faults on oily bottles | Repeat labeller stops, skewed labels, cleaning stops on the same shift | Find the drip point at the filler and book cleaning separately |
| Checkweigher rejects | Rejects climb while speed holds, just after a pack change | Re-check fill settings at each change and track rejects per pack size |
| Long pack changes, 1 L to 5 L | Change minutes differ by a factor of two between crews | One written change sheet per pack size, timed and reviewed; see changeover time |
| Case packer and palletiser blocks | Filler stops with the outfeed full and the filler healthy | A separate reason code; see palletizer OEE |
| Running below rated speed | Bottles per minute under the ideal with no stop booked | Set the ideal per pack size from the maker's rating; see reduced speed loss vs minor stops |
Worked example: what one 1 L bottling shift costs
Sample figures for illustration only. A refiner bottles its own sunflower oil in 1 L PET on one line rated at 120 bottles a minute at the filler, two 8-hour shifts a day. Agree the time definitions before you compare lines; our OEE and ISO 22400 guide covers them, and our OEE calculation guide shows each formula step by step. Bottles convert to cases and litres as in OEE units: bottles, cases and pallets.
| Step | Figure | How it is worked out |
|---|---|---|
| Planned production time | 450 min | 480 min shift minus 30 min planned breaks and cleaning |
| Stops | 80 min | Waiting for a released tank 25, starved by the blow moulder 20, pack change 2 L to 1 L 20, capper jams 15 |
| Run time | 370 min | 450 minus 80 |
| Availability (A) | 82.2% | 370 / 450 |
| Ideal output in run time | 44,400 bottles | 370 min x 120 bottles a minute |
| Bottles counted | 37,740 | From the filler count; cold oil kept the speed down |
| Performance (P) | 85.0% | 37,740 / 44,400 |
| Good bottles | 37,000 | 37,740 minus 740 checkweigher rejects and loose caps |
| Quality (Q) | 98.0% | 37,000 / 37,740 |
| OEE | 68.5% | 0.822 x 0.850 x 0.980; check: 37,000 / (450 x 120 = 54,000) |
The gap to a perfect shift is 54,000 minus 37,000, or 17,000 bottles, which is 17,000 litres of oil. It splits cleanly by loss: 9,600 bottles to the 80 stopped minutes, 6,660 to slow running, and 740 to rejects. At a sample contribution of EUR 0.15 per 1 L bottle, the whole gap is worth EUR 2,550.00 a shift. Price the part a team can act on.
Say the lab releases the next tank before the run starts instead of after the filler asks, so tank waits fall from 25 to 10 minutes, and a bottle buffer cuts blow moulder starving from 20 to 10. That gives back 25 minutes. At the shift's own speed and quality, that is 25 x 120 x 0.85 x 0.980, or 2,500 good bottles. At EUR 0.15 a bottle:
- Per shift: 2,500 x EUR 0.15 = EUR 375.00.
- Per month, at 42 shifts (2 shifts x 21 days): EUR 15,750.00.
- Per year, at 504 shifts (42 x 12): EUR 189,000.00. Bottling runs from tank stock, so the year counts 12 months even where the crush is seasonal.
- New OEE: 39,500 good bottles / 54,000 = 73.1%, with availability up from 82.2% to 87.8%.
The contribution counts only when bottled orders are waiting; otherwise the 25 minutes are worth the overtime they avoid, so price it with finance. One check: set this line's ideal from a good shift instead of its 120 rating, say 100 bottles a minute, and the same shift shows a performance of 37,740 / (370 x 100) = 102.0%. Over 100% means the ideal is too low for this line; use its maker's rating per pack size.
Which oil mill software to buy first
Start with the row that costs the most this year. The first four are commercial, lab and process buys, and they come first when seed is mispriced or a tank release is on paper. The bottling hall row comes first when the plant sells all it can bottle and the hall is the limit.
Plant type changes the order. A refiner with its own brand usually buys the lab system first. A bottler that buys refined oil in tankers starts in the hall.
Book a demo to see how a filler's stops, bottle counts and lost money appear on one shift timeline.
Who hands what between oil mill systems
Most trouble in an oil mill stack sits in the links, not in the systems. Agree each link and its owner before go-live. A complaint traced from bottle to seed breaks wherever a tank change or a lot code moves by hand, so only the ERP, lab and tank records should claim lot data.
One link to avoid: copying refinery or lab data into the line layer. The filler does not need the deodoriser temperature. It needs to know it waited for oil, and one reason code says so.
Six questions to put to oil mill software vendors
Test each shortlisted vendor with a month of intake records, lab results and filler stop sheets.
| Ask | How to test the answer |
|---|---|
| Does procurement read moisture and oil content from intake? | Ask for one truck priced with a moisture discount, from weighbridge to contract. |
| Can a lab result hold a tank? | Ask to see a refined oil tank blocked until FFA and peroxide value pass, then released. |
| Which historian tags does the refinery keep, and for how long? | Ask for one deodoriser run pulled up by date and tank. |
| Which ERP fields does the bottling hall layer read and write? | Pack sizes, products and orders in; good cases and stop minutes out. Ask who maintains the link. |
| How are hand-fed jerrycan and 5 L lines counted? | Ask what happens where no machine count exists, and who checks the count. |
| How does the bottling layer mark a filler waiting for oil? | Ask for a reason that books the minutes to refinery supply, not to the filler crew. |
What to do this week and this quarter
This week, for the bottling hall or production manager:
- Add up last week's filler stop minutes by cause: tank waits, blow moulder, capper, labeller, pack changes, case packer, palletiser.
- Time one pack change on the busiest line, from the last good bottle to the first good bottle.
- Ask the lab how long a refined oil tank waits between its sample and its release.
- Write down the maker's rated bottles per minute for each pack size.
- Note the oil temperature at the filler on the first hour of each shift.
This quarter:
- Put a run signal and a count on the filler, the blow moulder and the case packer of the busiest line.
- Agree 8 to 12 stop reasons with the crews, in their own words, with tank waits as their own reason.
- Price one bottling minute with finance, from contribution per bottle and overtime cost.
- Set a target on the largest loss, such as halving tank waits, and review it weekly with the lab.
- Send good cases and stop minutes to the ERP.
Fabrico in the oil bottling hall
Fabrico is a cloud OEE and light MES platform. In an oil mill it covers the bottling hall, from the PET blow moulder to the palletiser:
- Refinery supply waits in their own bucket: when the filler waits for oil from the refinery or the tank farm, operators pick that reason, so the hall does not carry the refinery's minutes.
- Pack size by pack size: 1 L, 2 L, 5 L and 20 L runs each get their own ideal rate and count, so a pack change shows as its own loss in cases and money.
- Stops from the hall's machines: run state and counts come from the blow moulder, filler, capper, labeller and case packer signals, and the crew tags the reason on a tablet or phone.
Where jerrycans are filled by hand or cases are packed at a table, the camera add-on counts output where no machine count exists. Where a camera covers the station, the video for the minute of a stop can be opened from the shift timeline, streamed on request and not stored in Fabrico. The FMCG camera guide and the computer vision add-on page explain how those counts work.
The platform as a whole, from loss pricing to apps and exports, is on the MES and OEE software page. For where a light layer stops, see light MES vs full MES.
Procurement, intake, the lab, the DCS, tank records, the WMS and the QMS each keep their own home, and QA owns the quality records. Quality inspection is not part of Fabrico. Production planning and scheduling are not part of Fabrico today.
Questions oil mill managers ask
Is edible oil refinery software the same as a DCS?
Mostly, yes. The refinery runs continuously, so its control software is a DCS or SCADA with a historian, often bought with the refinery equipment. Lab and tank records sit beside it.
Does OEE software belong in the refinery?
Rarely. An edible oil refinery runs degumming to deodorising as one continuous process, measured in tonnes an hour, temperatures and vacuum. OEE fits the discrete machines of the bottling hall far better.
Which system should release a tank of refined oil?
The lab system, or the QA team through it. A tank should move to bottling only when its FFA, peroxide value and other results pass.
What OEE should an oil bottling line reach?
There is no fixed figure. Set the ideal from the maker's rating for each pack size, then track availability, performance and quality per shift. In the sample shift above, 68.5% rose to 73.1% once tank and blow moulder waits fell.
Does Fabrico record FFA or peroxide values?
No. Lab results stay in the lab system. Fabrico records run times, stops and counts on the bottling lines, and the reasons operators give.
Want the bottling hall's lost hours sorted by cause? Book a demo to see a bottling line's stops, bottle counts and lost money per shift.
Related articles

Latest from our blog



Real Fabrico tiles, sample data.