


 Login
 Blog
Sugar Mill Software: From the Cane Yard to the Bagging Line

In short: sugar mill software is a set of separate systems, not one package. A cane or beet factory runs a weighbridge and grower payment system at the gate, a DCS or SCADA for milling or diffusion, clarification, evaporation and the pans, a laboratory system for pol and brix, an ERP and warehouse system for sugar stock and sales, and an OEE and light MES layer for the centrifugals, bagging and retail packing lines.
- The DCS runs the continuous process. OEE and light MES control nothing; they time stops and count output.
- Grower payment depends on weight and sugar content, so the weighbridge and the lab feed it, not the production floor.
- The campaign is the year. On the FAO handbook's average, a beet factory runs about 90 days a year, so a lost hour of slicing is hard to win back.
- The worked example prices one 1 kg retail packing shift: 72.2% OEE, and EUR 208 a shift back from two fixes.
A sugar factory is two plants joined by a silo. Upstream, cane or beet becomes juice, syrup and massecuite in a process that runs day and night through the campaign under a control system. Downstream, sugar is spun, dried, stored and packed in machines that start, stop and change over like any packing hall.
Buying sugar mill software goes wrong when one product is asked to do both jobs. A process control vendor is not a packing line OEE vendor, and a grower payment system knows nothing about why the 1 kg packer stood still. This map sorts the systems and the record each one owns, then prices one packing shift in euros.
Fabrico builds OEE and light MES for the batch and packing end of the factory, so that is where the worked example sits.
Sugar mill software: the systems and who owns them
From the cane yard to the dispatch bay: the cane office and the lab own the money record, process engineers the control system, operations the packing hall.
| System | What it does in a sugar factory | Owner |
|---|---|---|
| Weighbridge | Gross and tare per cane truck, tractor trailer or beet load, linked to the grower | Cane or beet office |
| Grower and cane payment | Deliveries per grower, quality payment rules, advances and final payment | Cane office, finance |
| Laboratory system | Pol, brix and purity of cane, juice, syrup, massecuite and sugar; colour of the product | Lab, QA |
| DCS or SCADA | Mills or diffuser, clarifiers, evaporators, vacuum pans, boilers; control and history | Process engineers |
| ERP and WMS | Sugar stock by grade, silo and warehouse, lots, sales and dispatch | Finance, logistics |
| OEE and light MES | Running and stopped time at centrifugals, dryers, baggers and retail packers | Operations, CI |
The last row is the one that measures the line. It records when each centrifugal, dryer and packer runs and stops, how many cycles or packs it counts, and the reasons the crew gives for its stops, per machine and per shift. Availability, performance and quality come out of those three records, and so does the money a stop costs.
What you see: a shift timeline, unclassified time waiting for a reason, and the operator's line-down screen, on sample lines rather than a sugar mill. Book a demo.
Plays from YouTube. Google may set cookies when you press play. Privacy policy.
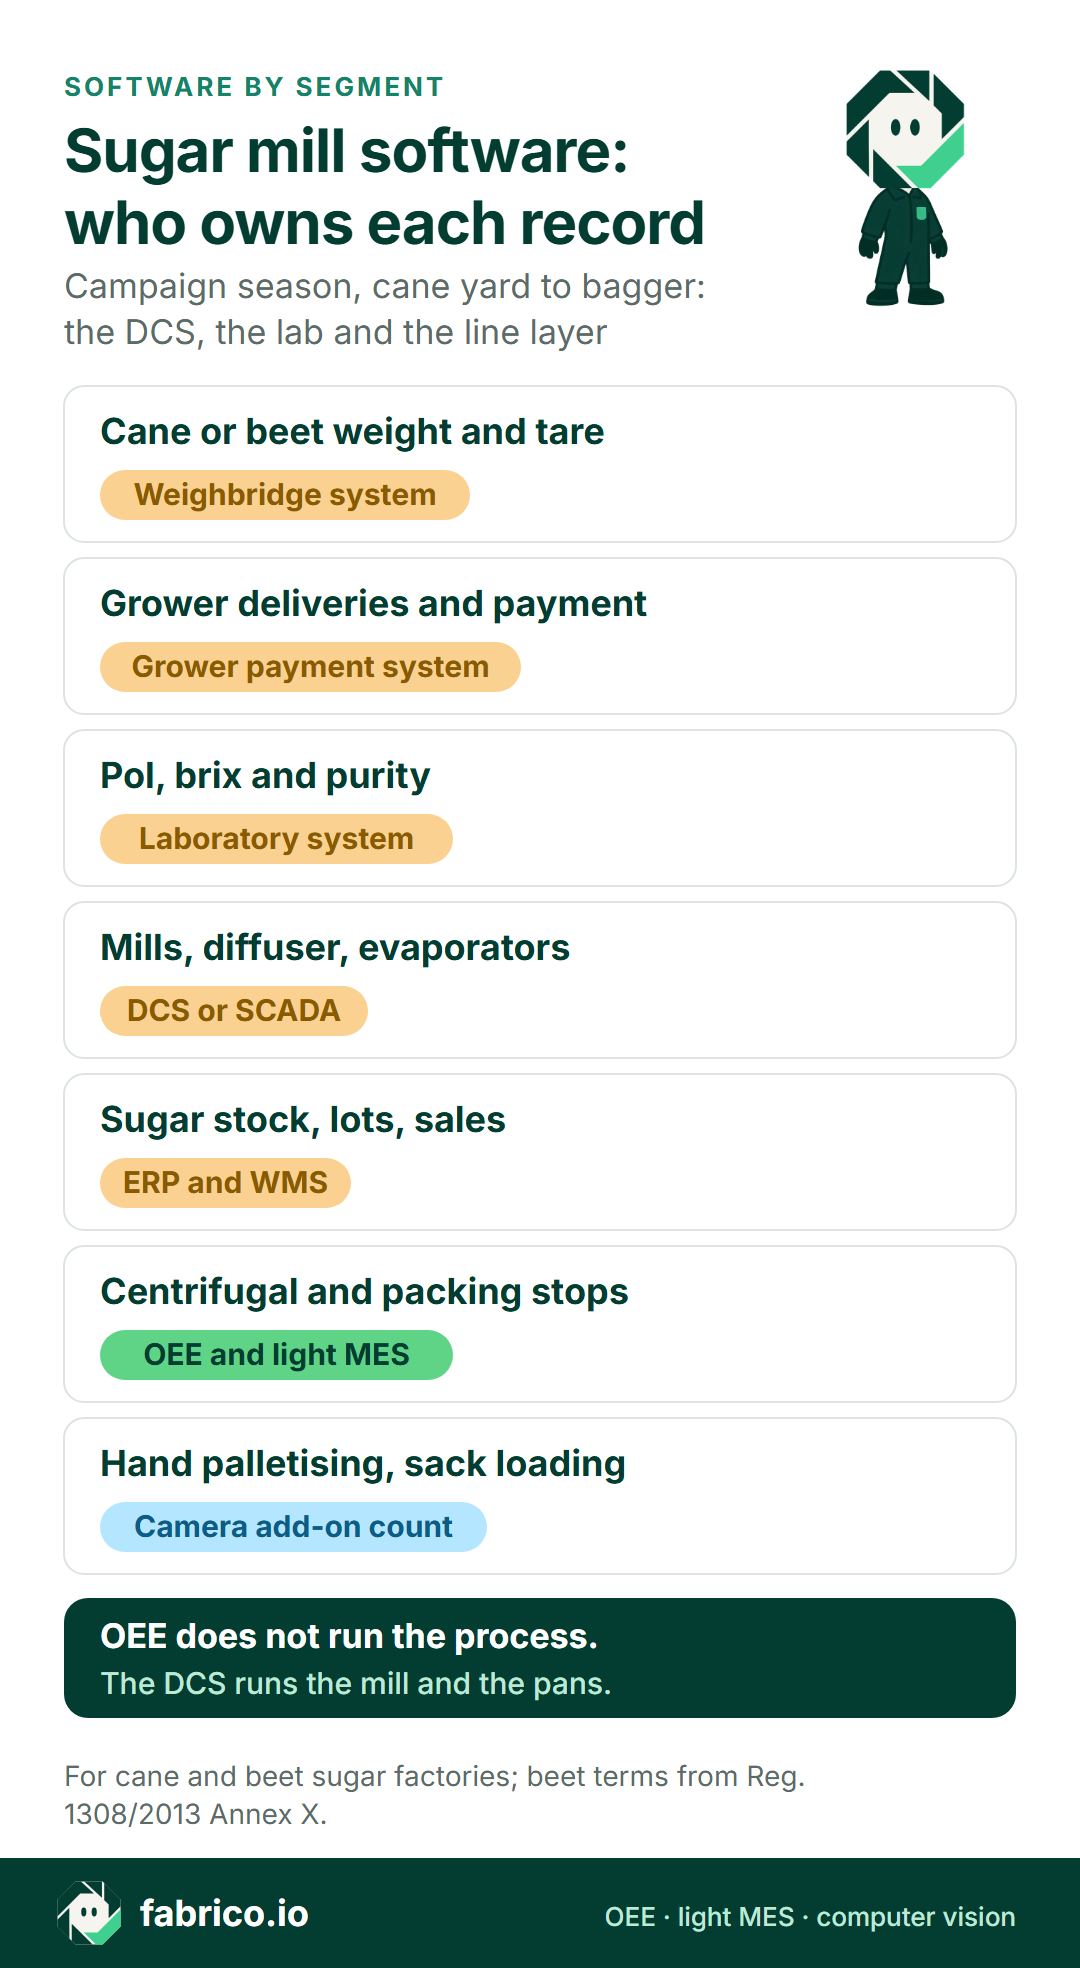
Text version of this infographic
- Cane or beet weight and tare: weighbridge system.
- Grower deliveries and payment: grower payment system.
- Pol, brix and purity: laboratory system.
- Mills, diffuser and evaporators: DCS or SCADA.
- Sugar stock, lots and sales: ERP and WMS.
- Centrifugal and packing stops: OEE and light MES.
- Hand palletising and sack loading: camera add-on count.
- Footer: OEE does not run the process. The DCS runs the mill and the pans.
- Note: for cane and beet sugar factories; beet terms from Reg. 1308/2013 Annex X.
Weighbridge and grower payment
Every delivery starts on the scale, and every grower is paid from it. In the EU the purchase terms for beet are written into law: Annex X of Regulation (EU) No 1308/2013 says delivery contracts shall lay down a fixed sugar content for beet, shall provide for the gross weight, tare and sugar content to be determined using procedures agreed, and shall fix the time limits for any advance payments and for payment of the purchase price. Cane industries use their own national rules. Either way, payment runs on the weighbridge and the lab.
Laboratory: pol, brix, recovery and the product spec
The lab measures pol and brix from cane or beet samples through to the final sugar. Purity, the ratio of the two, tells the process team how well each stage is working. At the end, the lab proves the product spec. The UK Specified Sugar Products Regulations 2003, as made, define white sugar with polarisation not less than 99.7°Z, and similar national rules apply elsewhere. These are lab and QA records, held by lot or silo sample.
Recovery is a lab number too. The FAO and EBRD agribusiness handbook on sugar beet says beet contains on average 16 percent sugar, 80 percent of which can be recovered by extraction, so one tonne of beet gives at most 130 kg of white sugar. For cane, the LSU AgCenter summary of the 2024 Louisiana crop reports that the 11 operating raw sugar factories processed 17,366,115 tons of cane at an average recovery of 236 pounds of sugar (96° pol) per ton.
DCS or SCADA: the continuous process
Milling tandems or the beet diffuser, juice heaters, clarifiers, multiple effect evaporators and vacuum pans run under a distributed control system or SCADA, with a historian behind it. An OEE tool should never sit in that loop. For how these layers differ, see SCADA vs DCS and SCADA vs MES.
ERP and warehouse
The ERP holds sugar stock by grade, raw and refined sales contracts, molasses and pulp, and costing. A warehouse system or ERP module tracks silos, bagged stock and dispatch.
OEE and light MES: the batch and packing end
From the centrifugals onward the factory behaves like a discrete plant. Batch centrifugals cycle, dryers and coolers run or trip, and baggers and retail packers start, stop and change format. This is where an OEE layer reads machine signals and operators record why the line stopped. See ERP vs MES for the general split.
Which records cross between sugar factory systems
The links that carry money run from the gate and the lab to grower payment. Output links run between the ERP and the packing hall: pack orders down, bags and run hours back. The centrifugal PLCs report cycles and run state, and the DCS stays closed to the OEE layer.
Lot tracing is where these handovers break. Sugar from many pan strikes mixes in the silo before it is bagged, so one bag lot traces to a window of silo time, not to one strike. The trace fails where the DCS clock, the lab sample times and the bag coder disagree, so agree one clock for all three before the campaign.
What a lost campaign hour costs
The USDA Economic Research Service puts it plainly: once harvested, sugarcane must be processed quickly before its sucrose deteriorates, and stored beet must also be processed before sucrose deterioration occurs.
The beet calendar is short. The FAO and EBRD handbook, an older reference, puts its average beet sugar factory at only 90 days a year, about 2,100 hours, while a cane factory produces raw sugar for about 5 months and may refine in the same plant for some months after. ERS adds that in the Red River Valley, long, cold winters allow the slicing of beet well into the following spring, and that in the Far West, ventilated and covered storage has allowed a longer season.
Our arithmetic on the handbook's own illustrative plant, which slices 11,000 tonnes of beet a day: that is about 458 tonnes an hour. At the ceiling of 130 kg of white sugar per tonne, one hour of a stopped diffuser holds back up to about 60 tonnes of white sugar while the beet in the yard keeps losing sucrose.
Those are process losses, owned by the process team with the DCS and the lab. The losses an OEE layer can see sit downstream: a centrifugal waiting for massecuite or held for a screen wash, a dryer trip, a bagger stopped for empty sacks or a sewing head, a retail packer changing from 1 kg to 2 kg packs. For cycle based machines, see OEE for batch processes; packing hall stops are covered in VFFS bagger stops and in palletizer OEE.
Sugar packing hall failure modes
Most visible stop time sits between the centrifugals and the pallet. The losses that recur in sugar, their early sign in line data, and the usual fix:
| Loss | Early sign in line data | Fix |
|---|---|---|
| Centrifugal waiting for massecuite | Gaps between cycles grow while the machine is healthy, clustered after late pan drops | Book no massecuite as its own reason and share the gap log with the pan floor |
| Screen wash booked as a fault | Long stops at regular intervals on every centrifugal, all under fault | Make the wash a planned reason, timed per machine, so real faults stand out |
| Dryer or cooler trip | All packers stop within minutes of one another | Take the dryer run state as a signal and book the packer stops as starved |
| Lumps from the conditioning silo | Short stops at the packer feed and weigher, worse after humid days | Log stops against the silo and the day's conditioning; check the sieve before the packer |
| Bag and paper jams | Many stops under two minutes, rising after a new reel or sack delivery | Log stops against the packaging lot and review it with the supplier |
| Check weigher rejects | Rejects climb while speed holds, just after a format change | Re-check fill settings at each change and track rejects per format |
| Long format changes, 1 kg to 2 kg | Change minutes differ by a factor of two between crews | One written change sheet per format, timed and reviewed; see changeover time |
| Running below rated speed | Packs per minute under the ideal with no stop booked | Set the ideal per pack format from the maker's rating; see reduced speed loss vs minor stops |
| Sugar dust and spills | Cleaning stops grow, and spills get booked as other | Give spills their own stop reason and an owner on every shift |
Dust is more than lost sugar. The US Chemical Safety Board's Imperial Sugar investigation records that on 7 February 2008 an explosion and fire at the refinery near Savannah caused 14 deaths and injured 38 others, fuelled by massive accumulations of combustible sugar dust throughout the packaging building. A stop reason for spills puts them on the same shift report as the lost packs.
Worked example: what one 1 kg retail packing shift costs
Sample figures for illustration only. A beet factory packs white sugar from the silo into 1 kg paper packs on one retail line rated at 100 packs a minute, two 8-hour shifts a day. Agree the time definitions before you compare lines; our OEE and ISO 22400 guide covers them, and our OEE calculation guide shows each formula step by step.
| Step | Figure | How it is worked out |
|---|---|---|
| Planned production time | 450 min | 480 min shift minus 30 min planned breaks and cleaning |
| Stops | 75 min | Format change 1 kg to 2 kg 30, starved by lumps at the feed 20, bag jams 15, case packer block 10 |
| Run time | 375 min | 450 minus 75 |
| Availability (A) | 83.3% | 375 / 450 |
| Ideal output in run time | 37,500 packs | 375 min x 100 packs a minute |
| Packs counted | 33,000 | From the packer count |
| Performance (P) | 88.0% | 33,000 / 37,500 |
| Good packs | 32,505 | 33,000 minus 495 check weigher rejects and torn packs |
| Quality (Q) | 98.5% | 32,505 / 33,000 |
| OEE | 72.2% | 0.833 x 0.880 x 0.985; check: 32,505 / (450 x 100 = 45,000) |
The gap to a perfect shift is 45,000 minus 32,505, or 12,495 packs, about 12.5 tonnes of sugar. It splits cleanly by loss: 7,500 packs to the 75 stopped minutes, 4,500 to slow running, and 495 to rejects. At a sample contribution of EUR 0.10 per 1 kg pack, the whole gap is worth EUR 1,249.50 a shift. Price the part a team can act on.
Say the crews cut the format change from 30 to 18 minutes with a written change sheet, and starved minutes fall from 20 to 8 once the silo conditioning and the feed sieve are checked at the start of each shift. That gives back 24 minutes. At the shift's own speed and quality, that is 24 x 100 x 0.88 x 0.985, or about 2,080 good packs. At EUR 0.10 a pack:
- Per shift: 2,080 x EUR 0.10 = EUR 208.00.
- Per month, at 42 shifts (2 shifts x 21 days): EUR 8,736.00.
- Per year, packing from silo stock all year, at 504 shifts (42 x 12): EUR 104,832.00.
- Per campaign only, at 180 shifts (the handbook's average of 90 slicing days x 2 shifts): 180 x EUR 208 = EUR 37,440.00.
- New OEE: about 34,585 good packs / 45,000 = 76.9%, with availability up from 83.3% to 88.7%.
Use the year figure for a hall that packs from silo stock all year, the campaign figure for a line that packs only during slicing. The contribution counts only when packed orders are waiting; otherwise the 24 minutes are worth the overtime they avoid, so price it with finance. If silo space runs short during the campaign, ask the process team what a slow packing hall costs upstream; that is a different and larger number. One check on the ideal: set it from a good shift, say 85 packs a minute, and the same shift shows a performance of 33,000 / (375 x 85) = 103.5%. Over 100% means the ideal is wrong; use the maker's rating per pack format.
Which sugar mill software to buy first
A factory that cannot pay growers correctly has no campaign, so payment and the lab come before anything on the floor. After that, buy for the loss you can see: idle centrifugals and slow packers point to OEE and light MES, process upsets to DCS work, and silos that never reconcile with bagged stock to the ERP and WMS.
Book a demo to see how centrifugal cycles and packer stops appear on one shift timeline, with the lost time priced in money.
Five questions for a sugar mill software vendor before the campaign
Put them to every shortlisted supplier, with last campaign's packing reports and a week of centrifugal logs to hand.
| Ask | How to test the answer |
|---|---|
| Does the product control anything in the process? | For an OEE tool the right answer is no. Control stays in the DCS or SCADA. |
| Which signals does it read from the centrifugals? | Cycle complete and run state from the PLC is enough. Ask who wires it and who keeps it working. |
| How is a planned screen wash kept apart from a fault? | Ask for both as separate reasons, so washing time shows up as planned work. |
| Can a bagger hold one rate for 50 kg sacks and another for bulk bags? | Ask to see two pack formats on one machine, each judged on its own speed. |
| Which ERP fields does the packing hall read? | Pack orders, sizes and brands in; bags and run hours out. Agree who maintains the interface. |
What to do this week and this quarter
This week, for the packing hall or production manager:
- Add up last week's packer and centrifugal stop minutes by cause: no massecuite, screen wash, dryer trip, lumps, jams, format changes, palletiser.
- Time one format change on the busiest retail line, from the last good pack to the first good pack.
- Ask the process team which signal shows the dryer or the conditioning silo stopping, so packer stops can be booked as starved.
- Write down the maker's rated packs per minute for each pack format.
- Walk the packing hall with the safety lead and mark where sugar dust and spills collect.
This quarter:
- Put a run signal and a count on the busiest packer, its check weigher, the palletiser and one centrifugal.
- Agree 8 to 12 stop reasons with the crews, in their own words, with the screen wash as planned work.
- Price one packing minute with finance, from contribution per pack and overtime cost.
- Set the off season as not planned time before the next campaign starts.
- Send pack counts and stop minutes to the ERP.
Fabrico at the sugar packing end
Fabrico is a cloud OEE and light MES platform. In a sugar factory it covers the batch and packing end:
- Centrifugals and dryers: run state and cycles come from the PLC or a sensor, and the operator enters the reason on a phone or tablet: no massecuite, screen wash, discharge fault, dryer trip.
- Bagging and retail packing: each packer gets an ideal rate per pack format, from 1 kg retail packs to 50 kg sacks and bulk bags, so changeovers, sack supply and sealing stops are counted apart.
- Campaign downtime in money: machine stop time in the packing hall is shown by line and shift, with the lost time priced. The data can be exported to Excel or CSV, or pulled by the ERP over the REST API and webhooks.
Sacks stacked or loaded by hand have no machine count, so there the camera add-on counts them. Where the camera add-on covers the station, the video for the minute of a stop can be opened from the shift timeline, streamed on request and not stored in Fabrico. See the computer vision add-on and the FMCG camera guide. Platform features are listed under MES and OEE software, the general case is in OEE software, and the food plant software map is in food manufacturing software.
The DCS, the weighbridge, grower payment, the lab, the ERP and the warehouse each keep their own home, and QA owns the quality records. Quality inspection is not part of Fabrico. Production planning and scheduling are not part of Fabrico today.
Questions sugar factory managers ask
Is sugar mill software the same as a DCS?
No. The DCS or SCADA controls the continuous process from the mills or diffuser to the pans. Sugar mill software also covers grower payment, the lab, the ERP and packing line OEE, each a separate product.
Can OEE software calculate grower payments?
No, and that is not Fabrico's job. Grower payment depends on delivered weight and sugar content, which come from the weighbridge and the lab, and the payment itself belongs in the grower payment or ERP system. OEE software counts packed output and machine time.
Where does OEE help most in a sugar factory?
At the centrifugals and in the packing hall, where machines start and stop. The continuous process upstream is judged by the process team on throughput and recovery, not by a packing line OEE.
How should the off season appear in the data?
As time not planned for production, so repair months do not drag the campaign figures down. The packing hall may still run from silo stock, and it can keep its own planned hours.
What OEE should a sugar packing line reach?
There is no fixed figure. Set the ideal from the maker's rating for each pack format, then track availability, performance and quality per shift. In the sample shift above, 72.2% rose to 76.9% once format change and starved minutes fell.
Does Fabrico read data from the DCS?
It does not need to. Fabrico works from centrifugal and packing machine signals. If a factory wants a DCS value shown, that is a separate integration agreed with the process team.
Want to see a campaign week of packing hall stops in one view? Book a demo to see centrifugal cycles, packer stops and lost money per shift.
Related articles
Latest from our blog






Real Fabrico tiles, sample data.