


 Login
 Blog
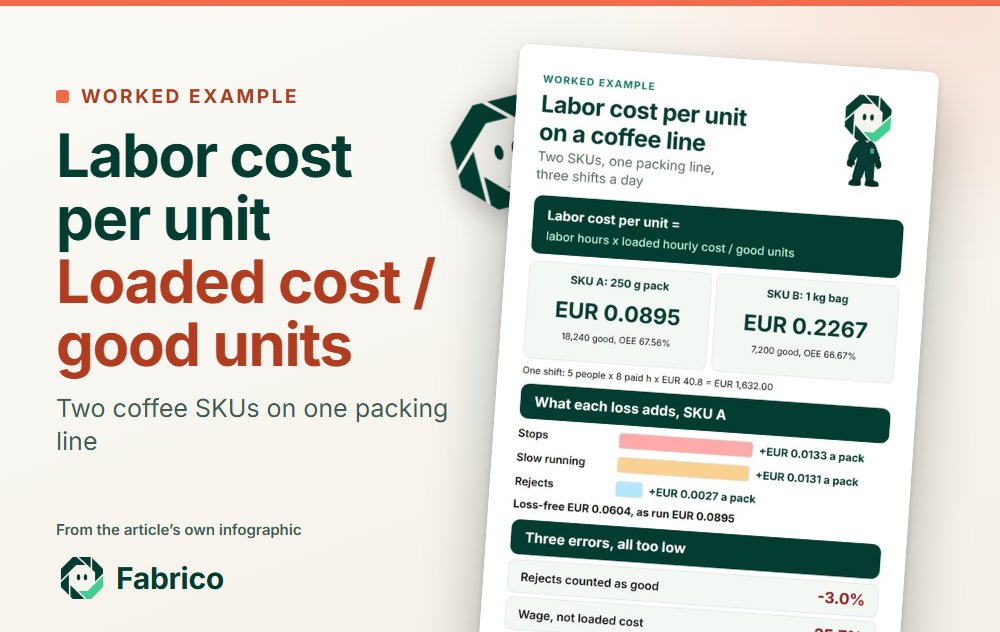
Labor Cost per Unit: Formula, Worked Example and How OEE Moves It

In short: labor cost per unit is what a plant pays its people for each good unit. The labor cost per unit formula is (direct labor hours x fully loaded hourly cost) / good units, and that is the whole labour cost per unit calculation. On a machine-paced line the paid hours are fixed for the shift, so labor cost per unit of output moves with OEE: stops, slow running and rejects spread the same hours over fewer good units.
- Use the loaded hourly cost: wages were 74.3% of labour cost in euro area manufacturing in 2025.
- Divide by good units made, never by total units or the plan.
- Price an OEE gain at half delivery, in whole shifts: it is cash only when paid hours fall.
A controller who prices a SKU or explains a labor variance needs one number per product. The arithmetic is short; the result turns on which hours, which hourly cost and which units go in. This guide works one ground coffee packing line with two SKUs, a 250 g pack and a 1 kg bag, through the line's OEE, prices an improvement at half delivery in EUR a year, and comes with a labor cost per unit calculator in the same steps.
The labor cost per unit formula
For one product over one period:
Labor cost per unit = (direct labor hours x fully loaded hourly cost) / good units
When a shift runs two SKUs, split the hours and the units at the changeover.
| Input | What goes in | Where it comes from |
|---|---|---|
| Direct labor hours | Paid hours of the line crew, overtime and borrowed people at actual hours | Time and attendance (HR or payroll) |
| Fully loaded hourly cost | Wages plus employer social contributions, payroll taxes and benefits | Payroll cost report for the crew's cost centre (finance) |
| Good units | Total count minus rejects, for the SKU and the period | Line counts and checkweigher rejects (production) |
The OpenStax managerial accounting text (Rice University), section 4.2 on product costs defines direct labor as the total cost of wages, payroll taxes, payroll benefits and similar expenses for the people who work directly on the product: the loaded cost, by definition. The BLS explainer on unit labor cost adds the two levers: rising hourly compensation pushes unit labor cost up, rising output per hour worked pulls it down. On a packing line the plant controls the second one shift by shift.
Put the hours on the same basis as the rate. The ILO report on the measurement of working time (18th ICLS, 2008) notes that hours paid for may include paid leave and other paid absences, while short rest breaks count as hours worked. A published rate per hour worked, paid leave priced inside it, multiplies hours worked; a payroll rate, crew cost / paid hours, multiplies paid hours. Mixing them counts paid leave twice. Which people count as line labor is set out in units per labor hour.
Fully loaded hourly cost vs wage: what the rate must carry
The Eurostat labour cost levels dataset for 2025 (lc_lci_lev, euro area, manufacturing) puts euro area manufacturing at EUR 40.8 an hour of total labour cost, EUR 30.3 of it wages and salaries. The other 25.7% is employer social contributions and taxes minus subsidies. In the United States, the BLS Employer Costs for Employee Compensation release for June 2026 gives private industry manufacturing USD 48.62 per hour worked: wages USD 32.50 (66.9%), benefits USD 16.12 (33.1%), paid leave included.
| Manufacturing, per hour | Total labour cost | Wages and salaries | Wages as share of total | SKU A labor cost per pack |
|---|---|---|---|---|
| Euro area, 2025 | EUR 40.8 | EUR 30.3 | 74.3% | EUR 0.0895 |
| Germany, 2025 | EUR 49.5 | EUR 37.7 | 76.2% | EUR 0.1086 |
| Spain, 2025 | EUR 28.2 | EUR 20.5 | 72.7% | EUR 0.0618 |
| Poland, 2025 | EUR 17.1 | EUR 14.0 | 81.9% | EUR 0.0375 |
| Bulgaria, 2025 | EUR 10.2 | EUR 9.0 | 88.2% | EUR 0.0224 |
| United States, June 2026 | USD 48.62 | USD 32.50 | 66.9% | USD 0.1066 |
The country rows come from the same Eurostat dataset, queried for Germany, Spain, Poland and Bulgaria; the last column applies each rate to the sample line below (40 crew hours, 18,240 good packs). One shift costs EUR 1,980.00 in Germany and EUR 684.00 in Poland, so a group making one SKU in two countries prices it per plant. What this changes: a figure built on the wage leaves out a quarter of the cost in the euro area and a third in the United States. Use payroll's loaded rate for the crew; the averages are a check.
Worked example: labor cost per unit on a coffee packing line with two SKUs
Sample figures for illustration only. Ground coffee runs from a silo through a vertical form-fill-seal bagger, a checkweigher and a case packer to a hand-built pallet, 3 shifts a day, 21 days a month. 5 direct people a shift (operator, assistant, two case packers and palletisers, a material handler) are each paid 8 hours with a paid 30-minute break: 40 paid hours and 450 planned minutes. At EUR 40.8 an hour a shift of labor costs EUR 1,632.00. The bagger is rated at 60 packs a minute for SKU A and 24 bags for SKU B; each shift runs one SKU.
| One shift | A: ground coffee, 250 g pack | B: ground coffee, 1 kg bag |
|---|---|---|
| Rated output in 450 min | 27,000 | 10,800 |
| Run time (availability) | 369 min (82.00%) | 360 min (80.00%) |
| Total counted (performance) | 18,800 (84.91%) | 7,450 (86.23%) |
| Rejected at the checkweigher (quality) | 560 (97.02% good) | 250 (96.64% good) |
| Good units | 18,240 | 7,200 |
| OEE | 67.56% | 66.67% |
| Labor cost per unit | EUR 0.0895 (EUR 89.47 per 1,000) | EUR 0.2267 (EUR 226.67 per 1,000) |
| Labor cost per kg of coffee | EUR 0.3579 | EUR 0.2267 |
OEE is good units over rated output, 18,240 / 27,000 = 67.56%, the same as 82.00% x 84.91% x 97.02%. In a U.S. plant the shift costs USD 1,944.80. The per-kg row is the one for a pricing meeting: the bag costs 2.53 times the pack in labor but holds four times the coffee, so the small pack is the labor-heavy product.
The same steps as a calculator:
| Step | Calculation | SKU A | SKU B |
|---|---|---|---|
| 1. Crew hours | people x paid hours | 5 x 8 = 40 | 5 x 8 = 40 |
| 2. Labor cost | crew hours x loaded rate | 40 x 40.8 = 1,632.00 | 40 x 40.8 = 1,632.00 |
| 3. Good units | total minus rejects | 18,800 minus 560 = 18,240 | 7,450 minus 250 = 7,200 |
| 4. Labor cost per unit | step 2 / step 3 | EUR 0.0895 | EUR 0.2267 |
| 5. Check against OEE | step 2 / (rated a minute x planned minutes x OEE) | 1,632.00 / (60 x 450 x 67.56%) | 1,632.00 / (24 x 450 x 66.67%) |
How OEE moves labor cost per unit
The bagger sets the pace and the crew is paid for the shift whether it stops or not, so the EUR 1,632.00 is fixed and only good units move. Step 5 is the identity: labor cost per unit = crew hours x loaded rate / (rated output x OEE), inverse to OEE. Each loss can be priced by taking the shift apart in OEE sequence:
- Stops: 81 minutes of stops on SKU A cut rated output from 27,000 to 22,140 packs, adding EUR 0.0133 a pack.
- Slow running: running at 84.91% of rated speed cuts it to 18,800, adding EUR 0.0131.
- Rejects: 560 packs rejected leave 18,240 good, adding EUR 0.0027.
The losses add EUR 0.0290 to every pack, nearly half again on the EUR 0.0604 of a loss-free shift. Another sequence changes the split slightly, never the total.
| OEE on SKU A | Good packs a shift | Labor cost per pack | Change vs today |
|---|---|---|---|
| 60.00% | 16,200 | EUR 0.1007 | +12.6% |
| 67.56% | 18,240 | EUR 0.0895 | today |
| 75.00% | 20,250 | EUR 0.0806 | -9.9% |
| 85.00% | 22,950 | EUR 0.0711 | -20.5% |
A weak line gains more per OEE point. The whole conversion cost, energy and overhead included, is worked through in OEE vs cost per unit; this page keeps to the labor line.
Pricing the gain at half delivery
Sample figures for illustration only. The plant's loss study of the stop log names three fixes: a film splice table for the repeat bagger stops, a jaw temperature check after film changes, and a checkweigher set-up sheet per SKU. Done in full, they lift good output to 21,000 packs or 8,300 bags a shift. A study states what is possible, not what will happen, so the base case takes half the gain and the low case a quarter.
| Case | Good a shift, A / B | OEE, A / B | Labor cost per unit, A / B | Shifts no longer needed a year | Cash a year, whole shifts |
|---|---|---|---|---|---|
| Today | 18,240 / 7,200 | 67.56% / 66.67% | EUR 0.0895 / 0.2267 | 0 | EUR 0 |
| Low (25% delivery) | 18,930 / 7,475 | 70.11% / 69.21% | EUR 0.0862 / 0.2183 | 27.65 | EUR 44,064.00 |
| Base (50% delivery) | 19,620 / 7,750 | 72.67% / 71.76% | EUR 0.0832 / 0.2106 | 53.36 | EUR 86,496.00 |
| High (100% delivery) | 21,000 / 8,300 | 77.78% / 76.85% | EUR 0.0777 / 0.1966 | 99.68 | EUR 161,568.00 |
Demand holds at 8,536,320 packs and 2,073,600 bags a year (756 shifts, EUR 1,233,792 of direct labor). In the base case the same volume needs 435.08 + 267.56 shifts, 53.36 fewer, worth EUR 87,077 a year on paper. A crew is paid by the shift, so the cash is 53 whole shifts x EUR 1,632.00 = EUR 86,496.00 a year, and only if the plant takes them out: about four night shifts a month, or the crew moved to a line that runs on agency hours today. A seasonal plant counts only the months in which hours can come out. If the extra output sells instead, the gain is margin: see when a lower unit cost turns into cash.
Standard vs actual labor cost per unit
The OpenStax section 8.1 on how a standard cost is developed separates an ideal standard, set as if machines never break down and there is no scrap, from an attainable one people reach with reasonable effort. This line's cost sheet uses 80% of rated output, 21,600 packs or 8,640 bags a shift: a standard labor cost per unit of EUR 0.0756 for A and EUR 0.1889 for B.
Actual minus standard, times good units, is the labor variance: (EUR 0.0895 minus 0.0756) x 18,240 = EUR 253.87 unfavorable on a shift of A. In hours, the good packs were worth 33.78 standard crew hours and took 40. A shift of B carries EUR 272.00; a month of 39 A and 24 B shifts runs EUR 16,428.80 unfavorable, EUR 197,145.60 a year. The accounting terms are compared in standard cost vs actual cost, and the hours side in earned hours in manufacturing.
Direct vs indirect labor: who goes in the numerator
OpenStax section 4.2 places a supervisor's salary under indirect labor, in overhead. On a packing line:
| Role | Direct or indirect | Where its cost goes |
|---|---|---|
| Operator, assistant, case packers, palletisers, the line's material handler | Direct | Labor cost per unit of the SKU that ran |
| Shift lead over three lines, quality technician, hygiene crew, forklift pool | Indirect | Overhead, allocated |
Keep the two apart. A third of the shift lead's 8 hours added to SKU A would add EUR 108.80 a shift, EUR 0.0060 a pack, and the figure would move with the lead's span rather than with how the line ran. Keep indirect labor on its own overhead line, allocated by run hours.
Three errors that make labor cost per unit look too low
| Error | Calculation on SKU A | Result | Too low by | Sign of it |
|---|---|---|---|---|
| None | 1,632.00 / 18,240 | EUR 0.0895 | ||
| Rejects counted as good | 1,632.00 / 18,800 | EUR 0.0868 | 3.0% | Count taken before the checkweigher |
| Wage, not loaded cost | 40 x 30.3 / 18,240 | EUR 0.0664 | 25.7% | Rate matches the pay slip |
| Planned output, not actual | 1,632.00 / 21,600 | EUR 0.0756 | 15.6% | Same figure every month |
| Wage and plan together | 40 x 30.3 / 21,600 | EUR 0.0561 | 37.3% | A price that loses money on labor |
Rejects as good is small here because rejects run at 2.98%, and it grows with the reject rate: the paid hours are credited to packs that never shipped (see good count vs total count). Wage instead of loaded cost is constant, so trends look fine while every price built on it is short. Planned output is the quiet one: it returns the standard every month, so the variance leaves the labor line and turns up later as a cost nobody can place; nameplate output, 27,000, gives EUR 0.0604, the ideal standard OpenStax warns against. Wage over planned output gives EUR 0.0561, 37.3% short: EUR 284,794 a year of labor across 8,536,320 packs that the price list does not carry.
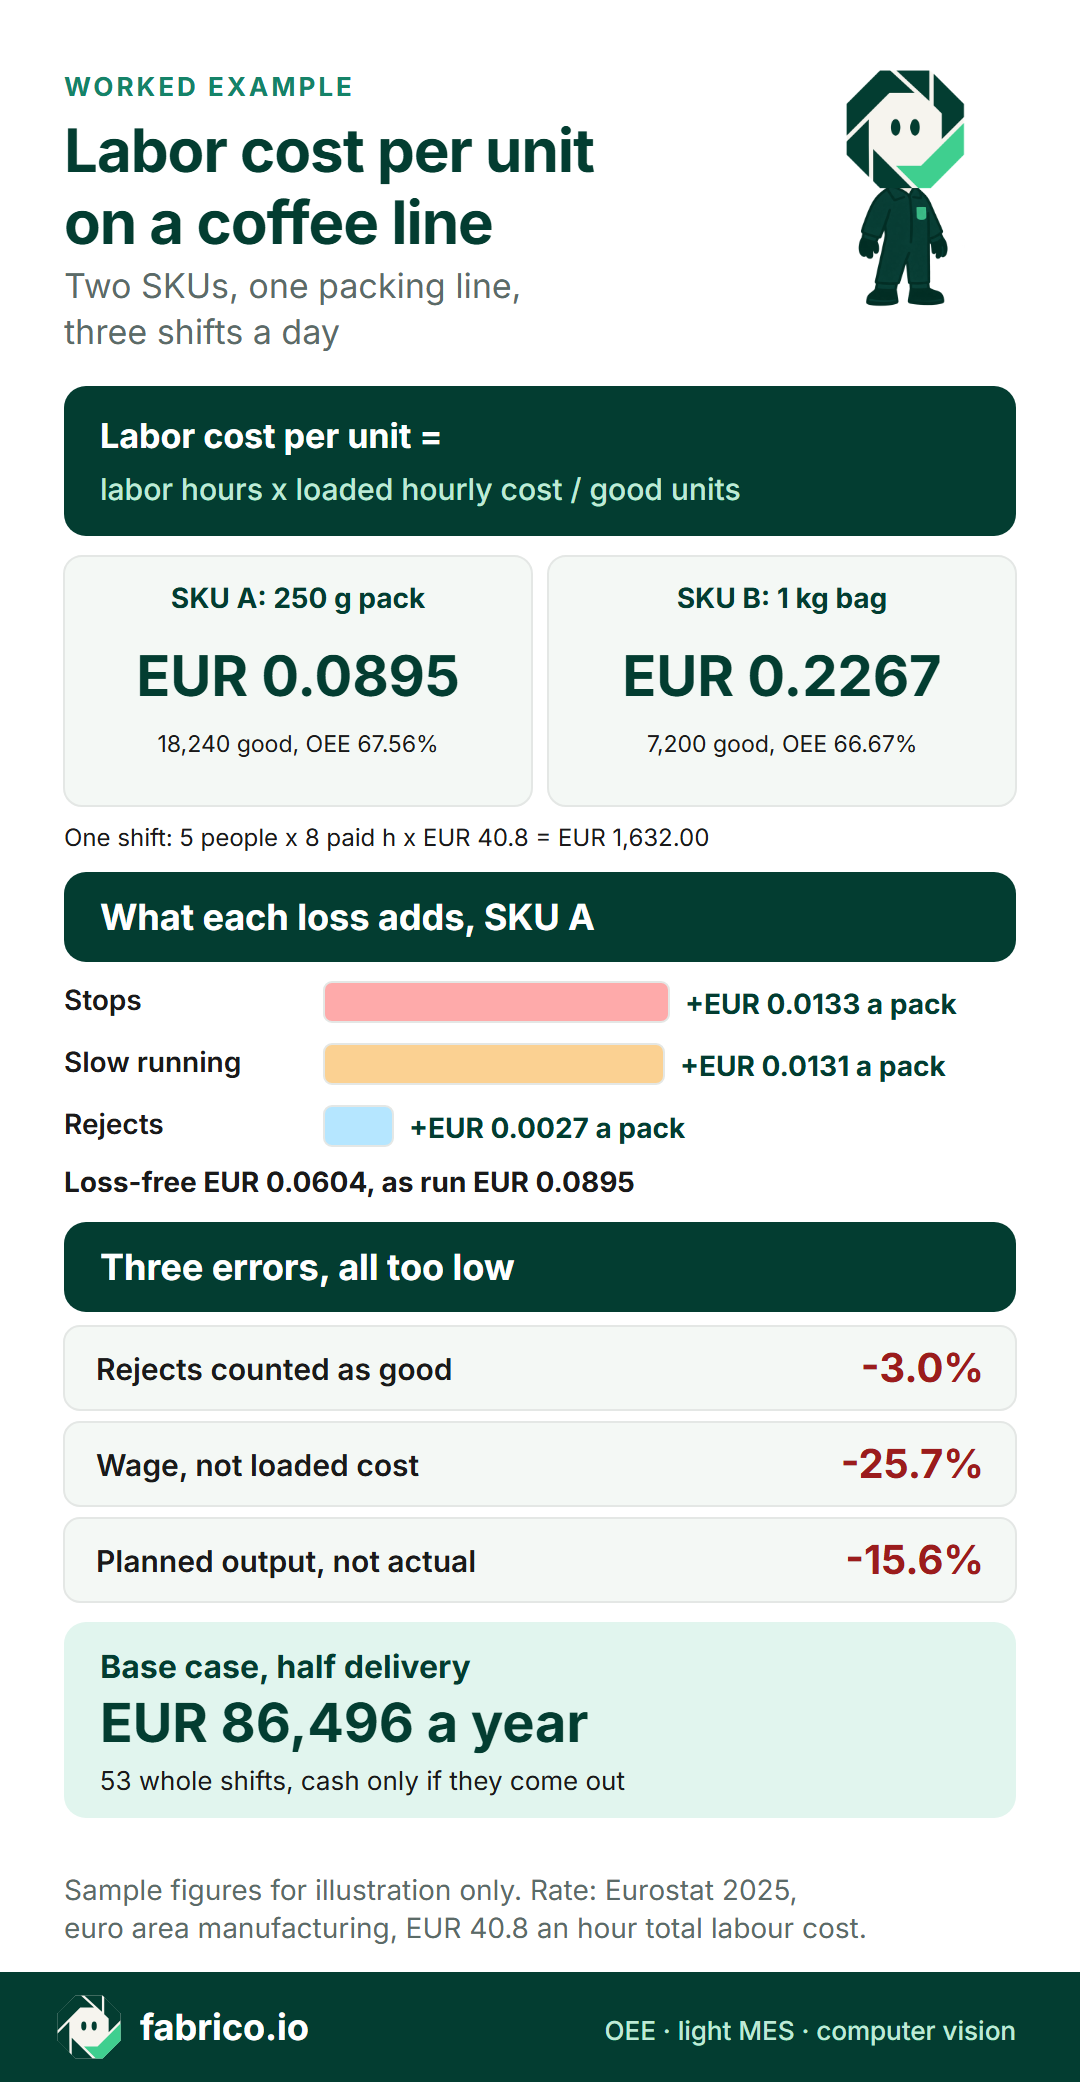
Text version of this infographic
- Labor cost per unit = (direct labor hours x fully loaded hourly cost) / good units.
- One shift: 5 people x 8 paid hours x EUR 40.8 = EUR 1,632.00. SKU A, 250 g pack: 18,240 good, EUR 0.0895 a pack, OEE 67.56%. SKU B, 1 kg bag: 7,200 good, EUR 0.2267 a bag, OEE 66.67%.
- On SKU A, stops add EUR 0.0133, slow running EUR 0.0131 and rejects EUR 0.0027 a pack.
- Errors: rejects as good 3.0% too low, wage instead of loaded cost 25.7%, planned output 15.6%.
- Base case at half delivery: 53 shifts a year no longer needed, EUR 86,496 a year in cash if the shifts come out.
- Sample figures. Rate: Eurostat 2025, euro area manufacturing, EUR 40.8 an hour total labour cost, EUR 30.3 wages.
What data a plant needs each shift
For each line and shift:
- Good and total counts, with rejects taken at the last check before the pallet.
- The SKU that ran and the changeover times, to split a two-product shift.
- Planned time, run time and stops with reasons, to trace a rise to a loss.
- Crew list and paid hours per person from time and attendance, borrowed people and overtime marked.
- The loaded hourly rate for the crew's cost centre, from finance.
The first three come from the line. OEE software connected to the bagger and the checkweigher counts good and total units and run time per line and shift from the machine signal, with the stop reason given by the operator. Measured counts make the denominator one number for production and finance. The walkthrough below shows a line screen, stops and waste.
What you see: a shift timeline, unclassified time waiting for a reason, and the operator's line-down screen, on sample lines. Book a demo.
Plays from YouTube. Google may set cookies when you press play. Privacy policy.
Hours stay in time and attendance, the rate with finance, the standard cost in the ERP.
When a spreadsheet stops being enough
A spreadsheet fed from shift sheets and a payroll export fails when shifts run two SKUs and the changeover minute was never written down, when the hand count and the checkweigher disagree, when short stops and slow running are invisible on the sheet, or when the month-end variance cannot be traced to a shift.
The routes below are priced in people's time only, at EUR 40.8 an hour, with sample hours. Fees are not published: ask each vendor for a price per line per month or a fixed quote.
| Route | Plant time | Cost of that time | What it misses | Enough when |
|---|---|---|---|---|
| Stopwatch or paper audit | 6 shifts x 8 h + 4 h = 52 h, once | EUR 2,121.60 | Shifts not observed, the weeks after | Checking a standard before pricing a SKU |
| Spreadsheet from shift sheets and payroll | 0.25 h x 63 shifts + 4 h = 19.75 h a month | EUR 805.80 a month | Short stops, slow running, late rejects | One SKU a shift, stable mix |
| Line software (OEE or light MES) plus payroll hours | About 1 h a month to reconcile | EUR 40.80 a month plus the vendor's price | Hours and rate still come from payroll | Several SKUs a day, variance traced by shift |
| Consultant or integrator study | About 16 h of interviews and data pulls | EUR 652.80 plus the fee | It ages as the mix changes | A one-off pricing review |
| The machine maker's counters | Reading the bagger HMI each shift | Plant time plus any licence | Rejects downstream of that machine | One machine is the whole line |
Who should pick which. One SKU a shift and a fast month-end close: stay on the spreadsheet and audit the standard yearly. Several SKUs a day, or a variance that must be explained by shift: line software. A new product family before a tender: a study or an in-house stopwatch audit.
Five questions for any vendor of line software:
- Where is the good count taken, and are checkweigher rejects subtracted before the shift closes?
- How are counts and run time split at a mid-shift changeover, and who can correct a split?
- Are short stops and slow running shown apart from stops, per line and shift?
- How do the counts reach payroll hours and the ERP standard cost, and in what export format?
- Can a loss be priced from the SKU's selling price and margin, so a variance and a stop sit in one report?
First steps this week and this quarter
- This week: get payroll's loaded rate for the crew and compare it with the standard cost file.
- This week: lay one shift of bagger counts beside the checkweigher rejects.
- This quarter: split each SKU's figure into stops, slow running and rejects, and rank fixes by EUR a year.
- This quarter: price the top fix at half delivery, in whole shifts.
Where Fabrico fits
Fabrico is light MES and OEE software for the plant floor. In a labor cost per unit report it supplies the line side:
- Good and total counts and run time per line and shift, from the machine's PLC or an IoT device with sensors on the machines you connect; where a station has no usable signal, the camera add-on counts output.
- Real-time OEE (availability x performance x quality) per line and shift, with the operator's stop reason.
- With the selling price and margin of each SKU entered, losses are priced in money.
- Fabrico has a REST API, webhooks and Excel export.
Where the camera add-on covers a station, the video for the minute of a stop can be opened from the shift timeline, streamed on request and not stored in Fabrico. See MES and OEE with computer vision.
Questions about labor cost per unit
How do you calculate labor cost per unit?
Multiply direct labor hours by the fully loaded hourly cost and divide by the good units made in the same period. Five people paid 8 hours at EUR 40.8 cost EUR 1,632.00; over 18,240 good packs that is EUR 0.0895 a pack.
Should labor cost per unit use the wage or the fully loaded cost?
The fully loaded cost: wages plus employer social contributions, payroll taxes and benefits. In euro area manufacturing wages were EUR 30.3 of EUR 40.8 an hour in 2025, so a wage-based figure is 25.7% too low.
Should rejects count in labor cost per unit?
Divide by good units only. The hours that made the rejects stay in the cost, which is correct: the plant paid for that time and cannot sell what it produced.
What is standard labor cost per unit?
On a machine-paced line, yes, because the crew and its paid hours are fixed for the shift. The lower figure becomes cash only when paid hours fall or the extra output sells.
Want good counts, stops and priced losses on a line screen? Book a demo.
Sources, accessed 18.11.2026: Eurostat lc_lci_lev, euro area manufacturing 2025; Eurostat lc_lci_lev, four countries; BLS ECEC, June 2026, table 4; BLS, what is unit labor cost; OpenStax, Principles of Accounting Vol. 2, 4.2; OpenStax, Principles of Accounting Vol. 2, 8.1; ILO, Measurement of working time, ICLS 2008.
Related articles



Latest from our blog







Real Fabrico tiles, sample data.