


 Login
 Blog

Computer Vision for Rolling Stock Manufacturing: Find the Bay Where Cars Wait

In short: Computer vision in rolling stock manufacturing counts carbodies and bogies as they cross bay doors and station exits, so queue counts show where cars wait.
- A buffer whose count grows sits in front of the constraint; a buffer that runs empty sits after it.
- On a pulse line every car moves at once, so the late position shows in the pulse delay log, not at the exit.
- In the example week, fitted cars waited for bogies: bogie station B3, not fit-out, held output at 7 of 8 cars.
- Price the weekly shortfall at the bogie drop (one car, EUR 450,000 as an example), not every lost minute at B3.
- The camera add-on counts units; weld records, test files and inspection stay with the welding coordinator, test engineers and quality team.
Computer vision for rolling stock manufacturing means a camera add-on counting carbodies and bogies where no machine signal exists, then reading the queues between bays.
It is a counting job. Judging welds, paint film and wiring stays with the welding coordinator, the paint inspectors and the test engineers.
Rail plants build in small series. Each series is usually assigned to one line, and each series has several variants, because a train is made of different car types. Output is counted in cars a week. A bad shift at the constraint is a car that misses its test slot; a bad shift elsewhere may cost nothing.
The money behind those slots is large. The UNIFE World Rail Market Study abstract puts rolling stock at EUR 63.3 bn a year on average over 2021 to 2023, one of the two largest segments of a EUR 201.8 bn rail supply market. For unit scale: in 2022 the MBTA board approved a USD 811 million contract "to purchase 102 new Green Line vehicles", as CommonWealth Beacon reported. That is about USD 8.0 million a vehicle on the contract value.
The queue test: computer vision counts carbodies in and out of each buffer
Between each pair of bays sits a buffer. Welded shells wait for paint, painted shells wait for fit-out, fitted cars wait for bogies, tested bogies wait for the bogie drop. The queue test needs three numbers per buffer over one week: how many went in, how many came out, and the level at the start and end.
- Grows: more in than out. The buffer sits in front of the constraint.
- Starved: empty for long stretches. The buffer sits after the constraint.
- Flows: in equals out, level steady. On its own it says nothing; look further down the line.
The constraint is the station between the last buffer that grows and the first buffer that starves: the bottleneck versus constraint logic, read over a week instead of a minute. A car in a buffer is also capital standing still (the cost of buffers).
A walk at 10:00 shows where cars stand at 10:00; a week of counts, the data a WIP tracking tool keeps, shows which queue keeps coming back. Rail buffers fill and empty by crane lift, traverser and rail dolly, and few of those moves leave a record in any machine. A camera add-on on a bay door line fills that gap. A carbody is the unit until the bogie drop, then it becomes a car; the car type comes from the build sequence, not the camera.
Explainer presented by Iris, Fabrico's AI-generated presenter: how an add-on camera counts output where a machine has no signal. Book a demo.
Plays from YouTube. Google may set cookies when you press play. Privacy policy.
One week of buffer counts in an EMU plant
The example plant builds regional EMUs in four-car units and plans eight cars a week on one early shift of 465 planned minutes, Monday to Friday: about 39 planned hours. The order mix needs one motor bogie and one trailer bogie per car on average, so the bogie drop needs 16 bogies a week. These are example figures, not a real plant.
| Buffer | In / out | Level, Monday to Friday | Reading |
|---|---|---|---|
| Welded shells waiting for paint | 8 / 8 | 2 to 2 | Flows |
| Painted shells waiting for fit-out | 8 / 8 | 1 to 1 | Flows |
| Fitted cars waiting for the bogie drop | 8 / 7 | 1 to 2 | Grows: cars wait |
| Tested bogies ready for the drop | 14 / 14 | 0 to 0, empty 24 of 39 h | Starved |
| Frames waiting for station B1 | 16 / 16 | 2 to 2 | Flows |
| Bogies waiting for station B3 | 16 / 15 | 1 to 2 | Grows |
| Bogies waiting for the test stand | 15 / 15 | 0 to 0, mostly empty | Starved |
Read from the top. Paint and fit-out pass all eight cars on. Then fitted cars pile up at the bogie drop, eight in and seven out, while tested bogies sat empty for 24 of 39 planned hours. The drop waited for bogies.
Follow the bogies back. Frames reach B1 as fast as B1 takes them. Bogies pile up in front of B3, the wheelset and suspension station, and the queue after B3 is empty most of the week. The test stand tested 15 bogies, passed 13 first time and sent 2 to shimming; one came back by Friday. That is 14 bogies, 7 cars, one short of plan. This week, B3 holds output.
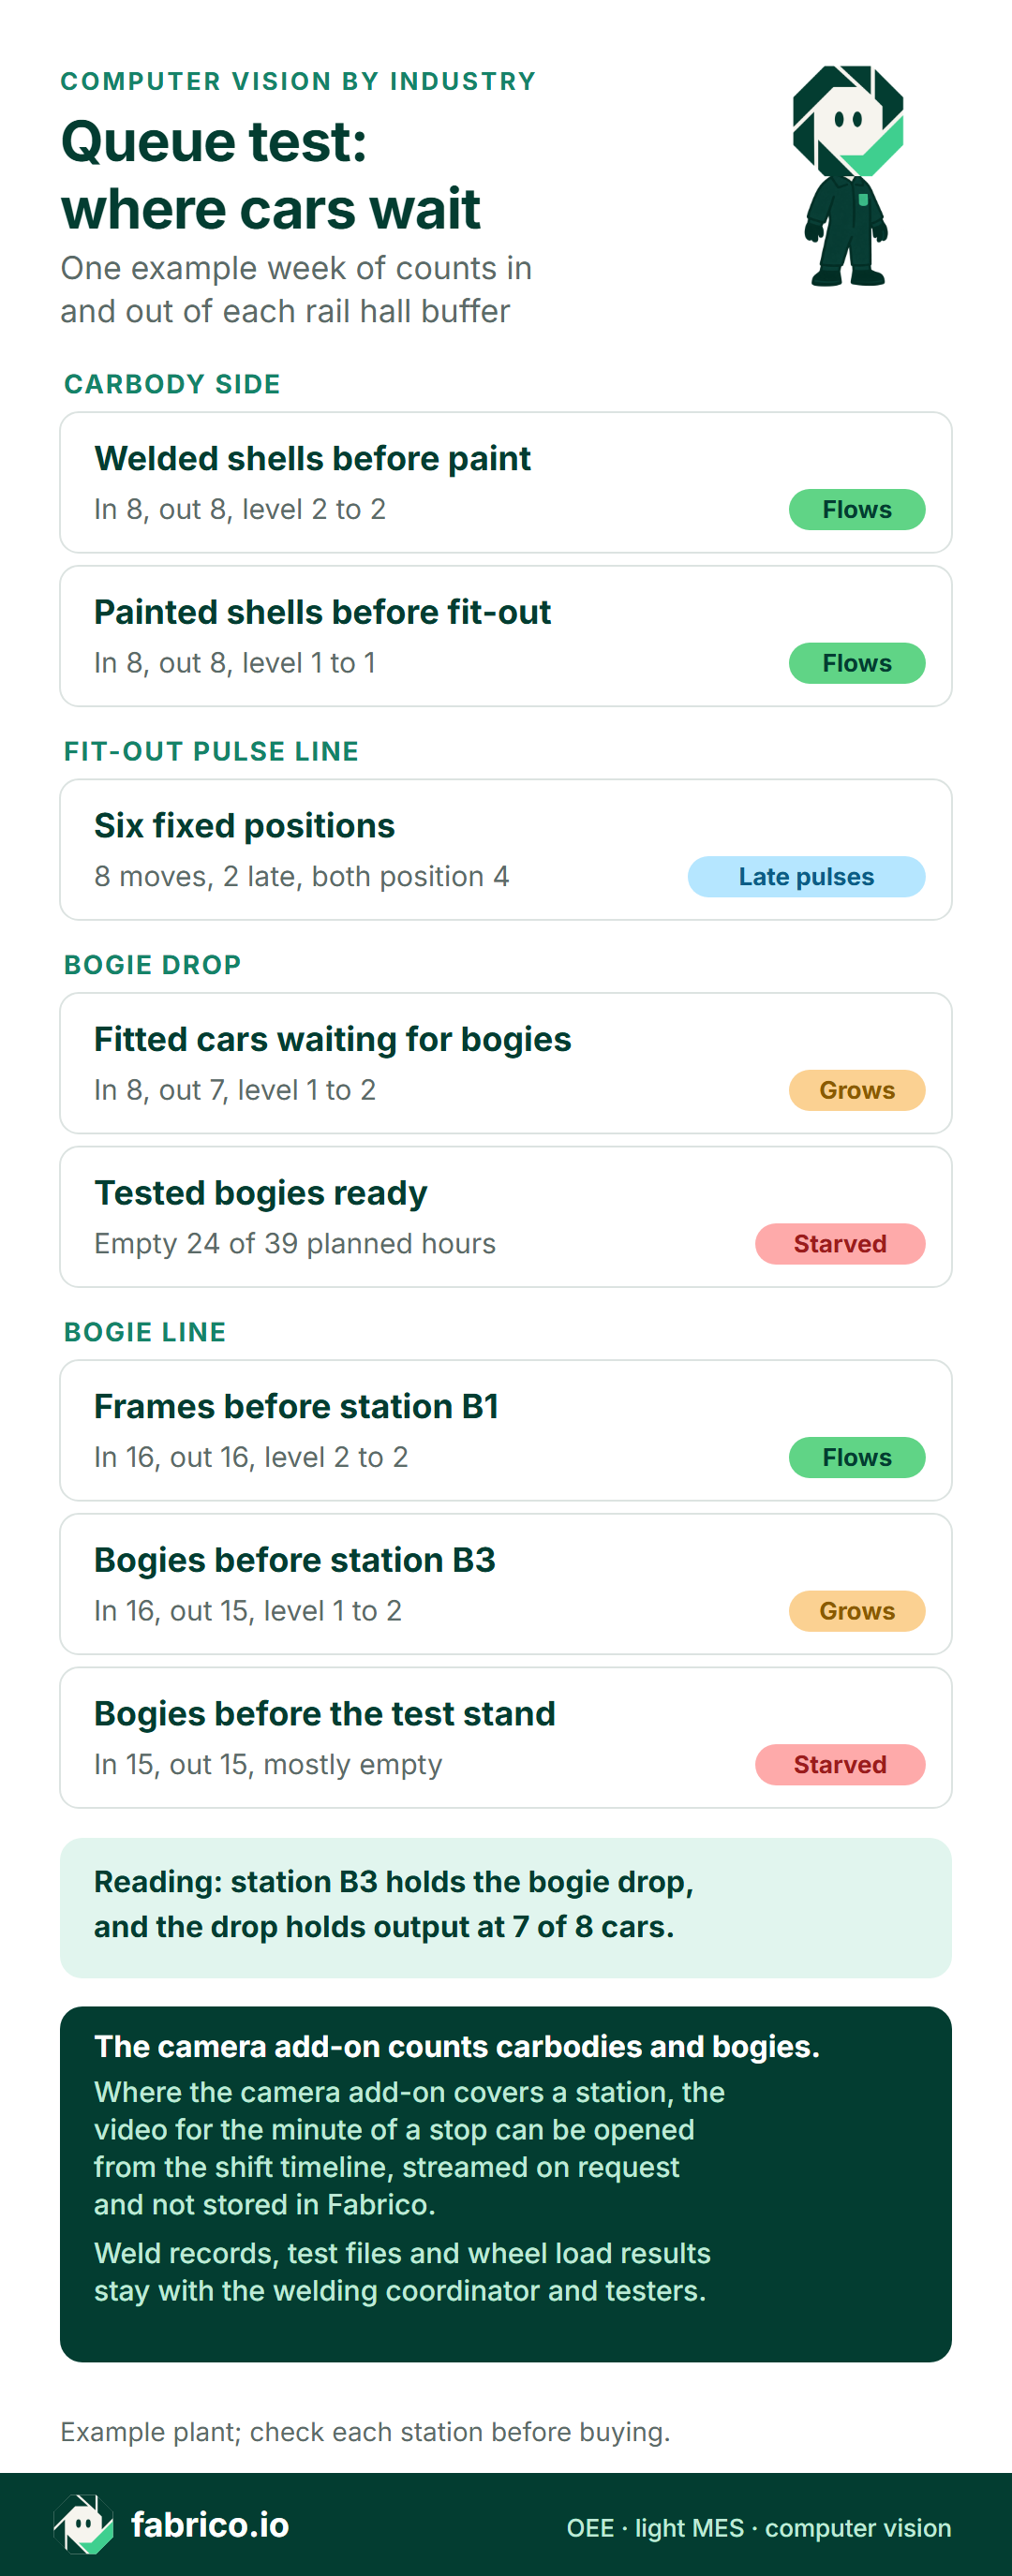
Text version of this infographic
- Carbody side. Welded shells before paint: in 8, out 8, level 2 to 2. Flows.
- Painted shells before fit-out: in 8, out 8, level 1 to 1. Flows.
- Fit-out pulse line. Six fixed positions: 8 moves, 2 late, both position 4. Late pulses.
- Bogie drop. Fitted cars waiting for bogies: in 8, out 7, level 1 to 2. Grows.
- Tested bogies ready: empty 24 of 39 planned hours. Starved.
- Bogie line. Frames before station B1: in 16, out 16, level 2 to 2. Flows.
- Bogies before station B3: in 16, out 15, level 1 to 2. Grows.
- Bogies before the test stand: in 15, out 15, mostly empty. Starved.
- Reading: station B3 holds the bogie drop, and the drop holds output at 7 of 8 cars.
- The camera add-on counts carbodies and bogies. Where the camera add-on covers a station, the video for the minute of a stop can be opened from the shift timeline, streamed on request and not stored in Fabrico.
- Weld records, test files and wheel load results stay with the welding coordinator and testers.
- Example plant; check each station before buying.
Why a pulse line hides the position that finished last
Fit-out here runs in six fixed positions: insulation and floor, cabling, roof equipment and HVAC, interior panels and seats, doors and windows, pre-test checks. At each pulse every car moves one position at once. A camera add-on at the exit of position 6 counts eight moves in the week, and one at position 1 counts the same eight. Neither can show which position finished last, because all of them leave when the pulse goes.
The plant sees the late position in three other records:
- The pulse delay. When the pulse goes late, the line stands, and the line lead books the wait with a reason naming the position that was not ready.
- The ready calls. Each position lead reports done before the pulse; the last call set it.
- Travelled work. Jobs a position could not finish move on with the car as open items, counted per position.
In the example week, two pulses went late for 70 minutes in total, both booked as "position 4 cabling not ready", and 11 open items travelled from position 4. That is a job for line balancing of the cabling content, but it cost no cars: every car that left fit-out then waited at the bogie drop. In drum buffer rope terms the drum is B3. The camera add-on still stamps when each car actually moved, so the pulse delay is measured, not remembered.
Machine signal or camera add-on, station by station in a rail hall
Weld robots, friction stir welding gantries, frame machining centres, paint booth controllers and the bogie test stand already report a cycle. The camera add-on goes where cars and bogies move by crane, traverser or hand.
| Station | Count comes from | What it records | Records kept by |
|---|---|---|---|
| Underframe, side wall and roof lines | Weld robot or gantry signal | Sub-assemblies off each jig | Welding coordinator |
| Shell welding jig | Jig signal; camera add-on at the bay door | Shells into the paint queue | Welding coordinator |
| Paint shop | Booth controller; camera add-on at the doors | Shells in and out | Paint inspectors |
| Fit-out positions 1 to 6 | Camera add-on at the exit; line lead | Pulses, late pulses, position named | Test engineers |
| Bogie frame weld cell and machining | Robot and CNC signal | Frames welded and machined | Quality team |
| Bogie stations B1 to B3 | Camera add-on at each exit | Bogies out; type from the build sequence | Quality team |
| Bogie test stand | Test stand signal | Tested, passed, sent to shimming | Test engineers |
| Bogie drop and static tests | Camera add-on at the drop; test rig | Cars on bogies, tests started | Test engineers |
Welding sits under its own rule. In Europe, EN 15085-2 governs the welding manufacturer; the Estonian standards body listing of EN 15085-2 says the document "defines the classification levels for welded components, the types of activity typically undertaken and the requirements to be fulfilled to demonstrate conformance." Carbodies and bogie frames are welded under that certification, and the weld records belong to the welding coordinator. Counting shells off the jig changes none of that.
Testing decides when a car is finished. IEC 61133 "specifies general criteria to demonstrate by testing that newly constructed complete railway vehicles conform with standards or other normative documents", and "The extent of application of the standard for particular vehicles will be specifically mentioned in the contract". A car becomes output when the contract's completion tests are signed, which is why inspection and testing are kept apart.
In the US the test duty runs to the railroad. Under 49 CFR 238.111 it must "Submit a copy of the plan to FRA at least 30 days before testing the equipment", and for Tier II and Tier III equipment "report the results of the tests to the Associate Administrator at least 90 days prior to its intended operation of the equipment in revenue service." The queue in front of the test track earns a count of its own.
Low volumes and a new design per order make rail close to engineer-to-order work, counted more like OEE in aerospace assembly than a packing line.
Inside the bogie line: motor and trailer variants at station B3
In the example plant, machined frames pass three manual stations. B1 prepares the frame: brackets, cable cleats, pipe runs. B2 fits brake equipment and pipework. B3 fits wheelsets, axleboxes and suspension. The test stand then loads the bogie and checks wheel loads; a bogie outside tolerance goes back for shimming.
A motor bogie adds traction motors and gearboxes, so the time study gives B3 an ideal of 135 minutes for a motor bogie and 105 for a trailer bogie, both example inputs. B3 also shares two resources: wheelsets from the wheelset press area, and the overhead crane that serves the frame weld cell.
On paper B3 has room. Five shifts of 465 minutes are 2,325 minutes; at the order's average of 120 minutes a bogie, that is 19.4 bogies a week at ideal, above the 16 the drop needs. B3 sent out 15. The gap is losses in shared supply, not design, and a wheelset pull loop by bogie type is the fix to test (kanban versus CONWIP).
Tuesday early shift at bogie station B3, minute by minute
Tuesday runs 06:00 to 14:15, 495 minutes, less two 15-minute breaks at 09:30 and 12:00: 465 planned minutes. The camera add-on at the B3 exit counts each bogie; waits show as gaps between counts on the shift timeline, and the B3 lead adds the reason.
- 06:00 to 08:15: motor bogie M1, 135 minutes, on its ideal. Counted at 08:15.
- 08:15 to 09:00: waiting for the wheelset pair for trailer bogie T1. Stop, 45 minutes.
- 09:00 to 11:00: T1, 105 minutes of work around the 09:30 break. Counted at 11:00.
- 11:00 to 11:30: crane busy turning frames in the weld cell. Stop, 30 minutes.
- 11:30 to 14:15: motor bogie M2, 150 minutes of work around the 12:00 break, 15 over its ideal because of a new damper bracket on this order. Counted at 14:15.
- T1 fails the wheel load test and goes to shimming. It passes on the next shift.
The arithmetic:
- Stops 45 + 30 = 75 minutes, so run time is 465 minus 75, 390 minutes. Availability 390 / 465 = 83.9%.
- Earned time 135 + 105 + 135 = 375 minutes. Performance 375 / 390 = 96.2%. Slow time 15 minutes.
- First-pass good: M1 and M2, 270 minutes. Quality 270 / 375 = 72.0%. T1 ships after shimming, but a reworked unit is not good count for the shift.
- OEE 0.839 x 0.962 x 0.720 = 58.1%, the same as 270 good minutes of 465. The bars sum: 270 + 105 + 15 + 75 = 465.
With one blended 120 minutes a bogie, the same shift reads 51.6%, 240 good minutes of 465, and blames the wrong causes.
Price the shortfall, not every lost B3 minute
No vetted public margin for rail car builders exists, so the example uses a contribution of EUR 450,000 a car, an example input the plant replaces with its own (the MBTA order above is about USD 8.0 million a vehicle). A car in this order needs one motor and one trailer bogie on average, 240 ideal minutes at B3, so one B3 minute carries EUR 1,875 while cars are short. Rework goes at crew time: Eurostat hourly labour costs give EUR 40.3 an hour for industry in the euro area in 2025.
| Way of pricing | Minutes | EUR | Holds up? |
|---|---|---|---|
| Every lost B3 minute on Tuesday | 195 | 365,625 | No: T1 ships next shift, and B3 has spare ideal capacity |
| Tuesday stops and slow time | 90 | 168,750 | Only if each minute would have made a bogie the drop needed |
| Weekly shortfall at the drop: 2 bogies | 240 | 450,000 | Yes: one car, while the order waits |
| Re-shimming T1: 2 fitters x 75 min | 150 crew | 100.75 | Yes: rework at crew time |
| Schedule with slack: B3 crew 4 x 90 min | 360 crew | 241.80 | Yes: crew time only |
The first row prices a bogie that ships and minutes B3 could spare. The honest number is the third row: two bogies the drop needed and did not get, one car, EUR 450,000 of contribution while the order book waits. The late pulses at fit-out cost zero cars, because those cars would have waited at the drop anyway. Once the wheelset loop is in, real-time OEE for bottleneck analysis shows whether the fix moved the constraint.
Want the queue test running on counts instead of a Friday walk through the hall? Book a demo.
Questions for any vendor before a camera goes up in a rail hall
| Question | Why it matters here |
|---|---|
| How is a carbody counted crossing a bay door on a traverser, or with two shells side by side? | Buffers fill by traverser and crane |
| How is a late pulse booked against the position that was not ready? | The exit count cannot show it |
| Can motor and trailer bogies carry their own ideal times from the build sequence? | A blended time misreads B3 by 6.5 points |
| When does a car count as output: last fit-out position, bogie drop or signed completion tests? | IEC 61133 and the contract decide |
| How does a bogie that fails the wheel load test and returns after shimming show? | Once as output, once as quality loss |
| Can lost minutes be priced per car, only for the shortfall at the drop? | Full pricing of every minute overstates |
| What happens to the count when a crane load or a bright shell blocks the view? | Tall loads and glare are known limits |
| What do the counts need from the EN 15085 weld records and the test files? | Nothing: they stay with their owners |
Camera placement in a rail hall: cranes, glare and tall loads
Much of the published guidance on cameras that count large moving objects comes from road traffic, and its limits carry over. The FHWA Traffic Detector Handbook warns that "tall vehicles such as trucks may block the line of sight, and headlights may cause blooming of the imagery at night." In a rail hall that is a carbody on the traverser or a crane load in front of the bogie lane. The handbook adds that "An automatic iris adjusts the light level entering the camera not only when roadway background lighting changes, but also when headlights, reflections from windshields and bumpers, or white or bright objects are in the field of view." Bare aluminium and stainless shells, white primer and welding arc light are exactly those bright objects.
The handbook measures road detectors, so read it as a test list. Mount high and look along the door line, keep the count line clear of crane paths, check the view under night lighting with a bright shell in frame, and run a hand tally next to the camera add-on for a week. Fabrico states no accuracy figure for the camera add-on.
Counting order, and the works council before the first camera
The plant sets its own order and pace; the example week points to this one.
- Count the two buffers at the bogie drop: fitted cars waiting and tested bogies ready.
- If the bogie side starves, count the exit of each bogie station, with ideal times per bogie type.
- At fit-out, book each late pulse with the position named and count travelled work per position.
- Count shells through the paint shop doors only if the painted shell buffer runs empty.
- Keep weld robots, machining centres, booth controllers and the test stand on their own signals.
Before the first camera add-on goes up, agree its view with the works council where there is one: aim it at the bay door line or station exit, not the benches, and write down who may open the video and why. GDPR and production line cameras covers the points to settle.
Where Fabrico fits in a rolling stock plant
Fabrico is MES and OEE software that reads run, stop and count from machine signals where they exist: weld robots, machining centres, booth controllers, the test stand. The camera add-on counts carbodies at bay doors and bogies at station exits where nothing else does; computer vision OEE software explains the add-on and OEE from computer vision the method. The line lead adds the stop reason on a tablet or phone. Losses can be priced from the plant's own contribution per car.
Where the camera add-on covers a station, the video for the minute of a stop can be opened from the shift timeline, streamed on request and not stored in Fabrico. On Fabrico's roadmap, not live today: the camera add-on suggesting the stop reason from the video. Inspection stays with the quality team, the paint inspectors and the test engineers; weld records stay with the welding coordinator. The delivery schedule and build sequence stay in the ERP or the planners' spreadsheet; Fabrico supplies the counts and rates they read. Reports export to Excel, and Fabrico also has a REST API and webhooks.
See also light MES, OEE software categories and bay counting in truck body and trailer plants.
Rolling stock camera questions
Can a camera count carbodies on a traverser or transfer table?
Yes, if it watches the bay door line from above, clear of crane paths. The usual limits are a crane load or another shell blocking the view, and glare from bare metal or white primer.
How is the constraint found on a pulse line if every car moves at once?
Not from the exit count, which is the same for every position. The plant reads the pulse delay booked with the position that was not ready, the ready calls and the open items that travel with the car. The queue test then shows whether that position costs cars.
Does the camera add-on tell motor and trailer bogies apart?
No. The camera add-on counts bogies leaving a station. The bogie type comes from the build sequence running at the station, and each type carries its own ideal time from the time study.
When does a rail car count as built?
When the completion tests in the contract are signed, not when it leaves fit-out. IEC 61133 sets the general test criteria and the contract sets the extent; in the US, 49 CFR 238.111 puts the pre-revenue test plan on the railroad.
Which count should go up first in a rolling stock plant?
The two buffers at the bogie drop: fitted cars waiting and tested bogies ready. A week of those counts shows whether output waits for cars or for bogies.
Want to see carbody and bogie counts between bays on one shift timeline? Book a demo.
Related articles





Latest from our blog







Real Fabrico tiles, sample data.