


 Login
 Blog

Computer Vision for Solar Inverter Manufacturing: Find the Burn-in Bottleneck

In short: computer vision for solar inverter manufacturing finds the bottleneck by counting units joining and leaving the burn-in slot queue with a camera add-on.
The camera add-on counts units and inspects nothing: solder, torque, insulation and grid results stay with AOI, screwdriver controllers and testers.
- Empty queue and free slots: the power-stage cells hold output back. Long queue and full slots: the burn-in racks do.
- A long queue beside free slots points at loading, the power-on check or a rack fault, not at the cells or the racks.
- Count each serial once at the closing bench exit; burn-in rejects come back through the queue without adding output.
- Price a lost minute at margin only while orders wait and the station that lost it was the constraint.
- Fabrico's camera add-on counts closed units, queued units and cartons at the stations it covers.
An inverter plant has one slow step nobody can hurry: burn-in. Whether the racks or the benches in front of them set the day's output decides which lost minute costs money. The rack software answers half of that question. The other half waits on a trolley in front of the racks, uncounted.
The scope is string, hybrid and central PV inverters and microinverters built in series. EV traction inverters are left out.
Computer vision for solar inverter manufacturing begins at the burn-in queue
Burn-in is a fixed block of hours, not a quick check. In a 2002 Sandia National Laboratories report on PV inverter power electronics, during burn-in "the inverter is operated continuously for a period of time so that any premature failures due to workmanship or materials will occur prior to field use". It should push the electronics to their maximum normal operating temperature, and the report notes it "may be performed with cooling fans retarded or disabled" to get there. No assembler can shorten that, so slot hours are the hardest capacity in the building.
Field data shows what a missed failure costs. In an NREL-led analysis of 100,000 US PV systems, inverters were still the components that reportedly fail most often (4% to 6%), ahead of any other hardware. A failure caught in the rack costs a rework hour; the same failure on site costs a service visit and lost production.
That leaves two candidates for the constraint: the hand-built power stage and the racks. They trade places during a shift as the model mix changes, a kit runs short or a rack section trips. A camera add-on over the queue between them shows which one is in charge, hour by hour.
The test side is already strong. IEC 62109-1 sets the minimum design and manufacturing requirements for PV power conversion equipment against electric shock, energy, fire, mechanical and other hazards. IEC TS 63157 gives quality assurance guidelines for manufacturing that equipment, and IEC says these guidelines "also form the basis for factory audit criteria of such sites by various certifying and auditory bodies". Those requirements are proven at the test stations, in the type test lab and in the audit, never by a counting camera.
Explainer presented by Iris, Fabrico's AI-generated presenter: how an add-on camera counts output where a machine has no signal. Book a demo.
Plays from YouTube. Google may set cookies when you press play. Privacy policy.
The queue test: four readings between the closing bench and the racks
Count units arriving at the queue and units leaving it for a slot; the difference is the queue length. Read it beside the rack occupancy, hour by hour.
| Queue | Burn-in slots | What holds output back |
|---|---|---|
| Empty | Free | The power-stage cells. A lost bench minute is lost output. |
| Long | All occupied | The racks. The money sits in slot hours, not bench minutes. |
| Long | Free | Neither: loading, the power-on check or a rack fault. |
| Empty | All occupied | Nothing yet. Watch which side breaks first when the mix changes. |
The third reading is the one plants miss. The cause sits between bench and rack: one person loading slots for several racks, a power-on check station that is down, or a load bus fault that takes a rack section out. Without the queue count, nobody sees the hour it happened.
Two rules keep the test honest. A unit joins the queue only after it passes hi-pot. And burn-in rejects come back as re-entries, not new units. The Sandia report spells out the loop: "In the case of a failure during burn-in, the unit is repaired, re-tested, and submitted to burn-in again." The same serial can join the queue twice in one shift, and it must not count twice as output.
A slow station is not always the constraint (see bottleneck vs constraint), and near full load the queue grows far faster than occupancy, as the Kingman formula shows.
Upstream of the queue: board kits, heatsinks and two cells
When the queue runs empty, tell a starved cell from a slow one. The control board, power board and, in hybrid models, battery interface come off an SMT line whose machines count boards and report their states; see OEE in electronics manufacturing and MES for electronics manufacturing. For the queue test, boards matter as kits: a cell waiting for a 50 kW control board kit is starved, not slow.
Module and heatsink
Power semiconductors, as modules or discrete packages, go onto an aluminium heatsink over a thermal interface material: paste through a stencil or from a dispenser, or a pre-cut pad. Screws run in a set sequence on a DC electric screwdriver whose controller records torque and angle per joint. That record proves each screw, not a finished heatsink, since the same controller also drives bracket, fan and cover screws; see torque monitoring vs cycle monitoring.
Busbars, chokes and closing the enclosure
Next come the power board, the busbars, the boost and output chokes and the EMC filter. In many string designs the DC link capacitors arrive already soldered to the power board; larger units and central inverters take a separate capacitor bank on laminated busbars. Chokes for the larger power classes can be heavy enough to need a lift assist, and a missing choke or a late capacitor delivery stops the bench outright, with no record unless someone writes it down.
The assemblers then route the cables, mount the fans and connector panel, plug in the control board and close the housing over its gasket. Many plants run a leak test on the sealed housing before hi-pot. The closing bench exit is the output point for the power stage: one unit, one count, one time stamp, with cell minutes per power class (see ideal cycle time).
What the burn-in racks already report, in slot hours
Each slot connects to a load or an energy recovery bus, and the rack software logs which unit sits in it, when it started and how long it has run. Most run a short power-on check before a unit takes a slot. Measure the racks in slot hours: planned time is slots times hours, a slot with a unit under load is running, and an empty slot while units wait outside is a loss. When the racks are the constraint, the losses worth chasing are:
- Slots empty during unloading, while the next unit waits on the trolley.
- Units held past their cycle until the next round of unloading.
- A rack section down with a load fault: the rack log shows it, the queue count shows what it cost.
A starved rack shows the opposite: free slots and an empty trolley, the upstream side of starvation and blocking. For a rack-bound plant the theory of constraints says never let the racks wait: keep a small, capped buffer of tested units in front of them, like the CONWIP loop in kanban vs CONWIP.
After the racks: final test, grid profiles and packing
Final test runs the unit on a grid simulator and, for hybrid models, a battery emulator, measures efficiency and loads the destination country's grid profile and firmware. Read tested, passed and failed from its database and leave the measured values there (see inspection vs testing).
The constraint can move here too. With fewer grid simulators than rack sections, units leave burn-in only to wait again in front of final test. The same in and out count works at that second queue.
Packing adds the rating plate, bracket, quick guide and carton. A camera add-on over the packing table counts closed cartons, which separates units tested from units ready for the truck.
Neighbouring plants have their own pages: computer vision for solar panel manufacturing, computer vision for battery manufacturing for the packs hybrid inverters connect to, and computer vision for electrical equipment manufacturing.
The flow of one inverter plant, with its branches and loops
This example plant has two feeders, two cells, one shared queue and a rework loop back into it.
Two things in this flow change what gets counted. The cells merge before the queue, so each count at the closing exit needs its cell, or a starved cell hides behind a busy one. And the rework loop feeds the queue from the side, so re-entries must carry their original serial.
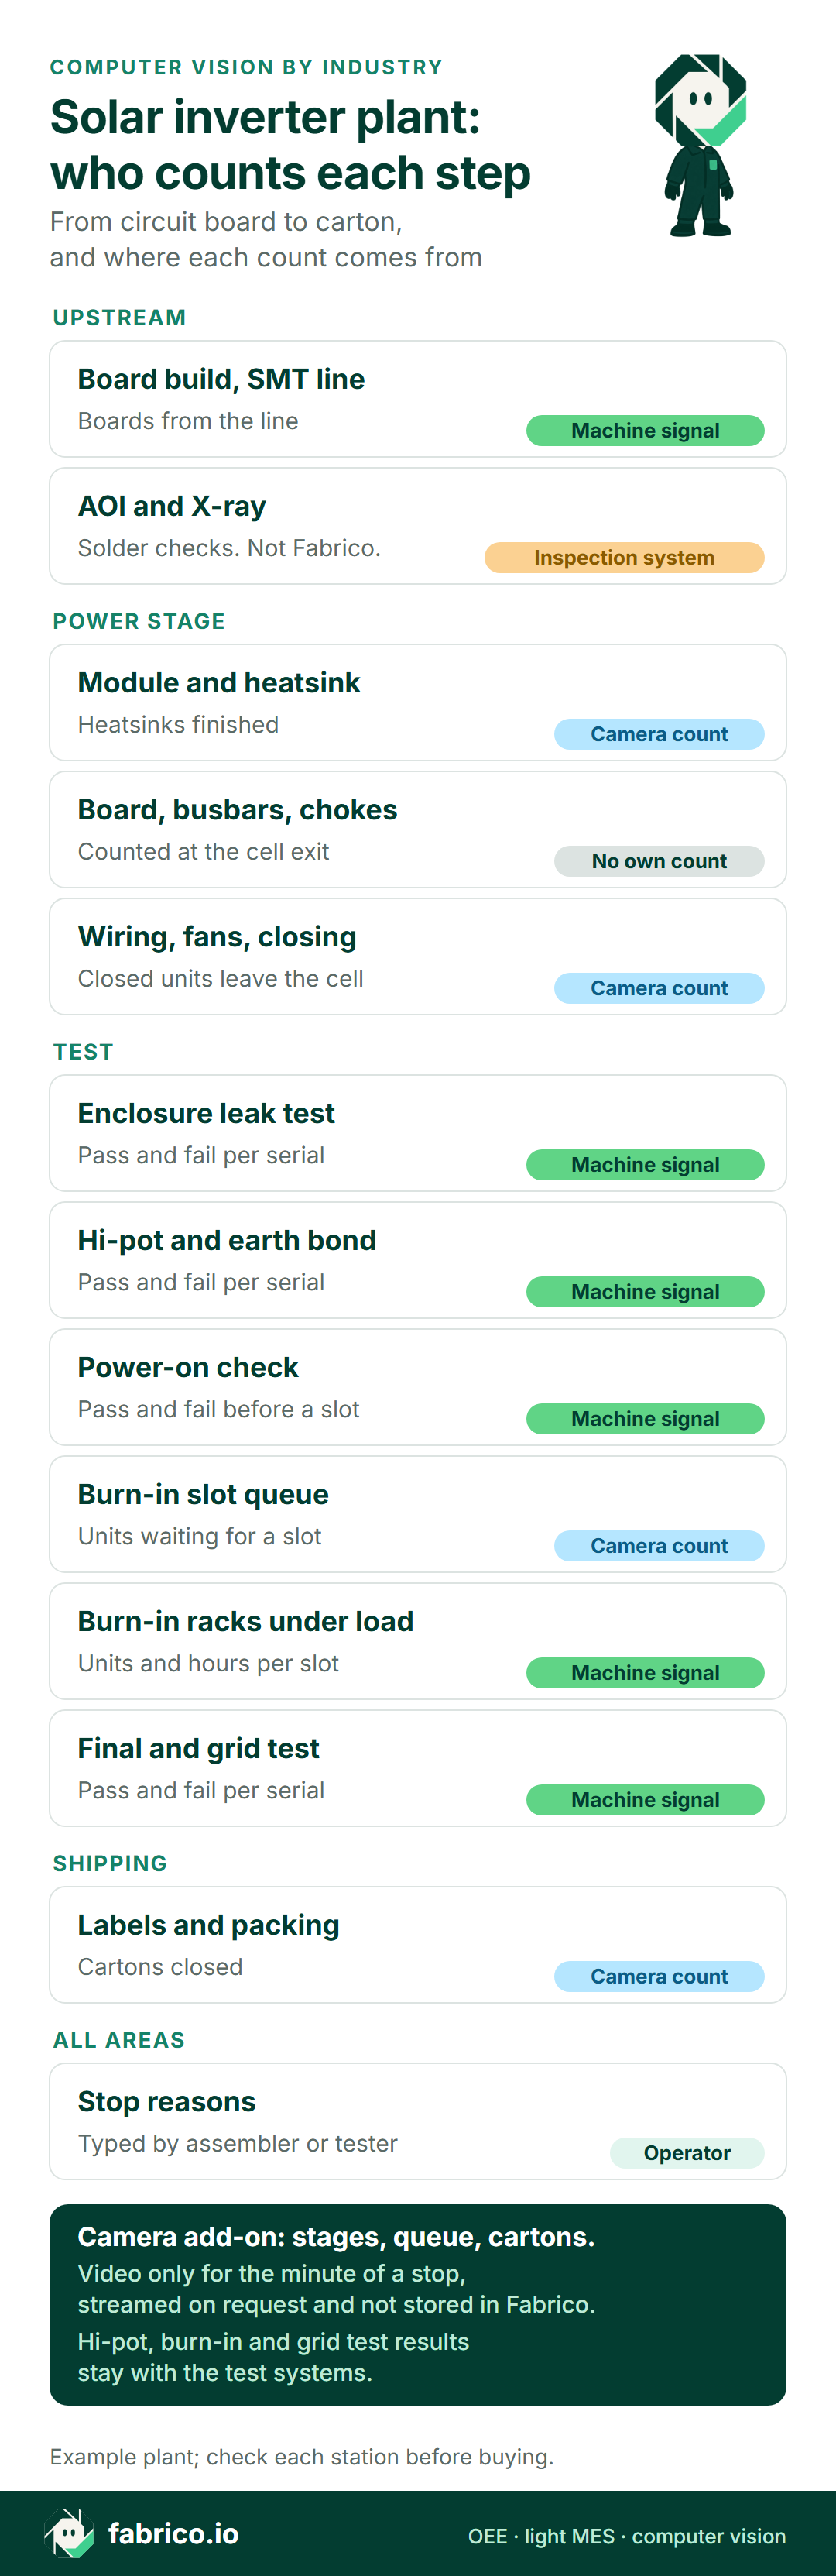
Text version of this infographic
- Headline: Solar inverter plant: who counts each step. From circuit board to carton, and where each count comes from
- Upstream: board build, SMT line: machine signal, boards from the line
- Upstream: AOI and X-ray: inspection system, solder checks, not Fabrico
- Power stage: module and heatsink: camera count, heatsinks finished
- Power stage: board, busbars, chokes: no own count, counted at the cell exit
- Power stage: wiring, fans, closing: camera count, closed units leave the cell
- Test: enclosure leak test: machine signal, pass and fail per serial
- Test: hi-pot and earth bond: machine signal, pass and fail per serial
- Test: power-on check: machine signal, pass and fail before a slot
- Test: burn-in slot queue: camera count, units waiting for a slot
- Test: burn-in racks under load: machine signal, units and hours per slot
- Test: final and grid test: machine signal, pass and fail per serial
- Shipping: labels and packing: camera count, cartons closed
- All areas: stop reasons: operator, typed by assembler or tester
- Footer: camera add-on: stages, queue, cartons. Video only for the minute of a stop, streamed on request and not stored in Fabrico. Hi-pot, burn-in and grid test results stay with the test systems
- Example plant; check each station before buying.
Book a demo to see the closing bench, the burn-in slot queue and packing counted on one shift timeline.
One late shift: which lost minutes were worth money
Example numbers, no real plant. One cell with two assemblers builds three-phase string inverters of 20 kW and 50 kW, from heatsink to closed enclosure. Planned time: 14:00 to 22:30 with a 30-minute break, so 480 minutes. Standards: 30 cell minutes per 20 kW unit and 45 per 50 kW unit. Counts come from a camera add-on at the cell exit and at the slot queue, hi-pot results from the tester, and stop reasons from the assemblers' tablet.
Availability. The cell stood for 85 minutes: 45 waiting for control board kits for the 50 kW model, 25 changing over from 20 kW to 50 kW (heatsink fixture, screwdriver program and choke trolley), and 15 after the screwdriver controller faulted on a 50 kW unit and needed a restart and a test joint. Running time: 395 of 480 minutes, 82.3%.
Performance. Six 20 kW units earned 180 cell minutes and four 50 kW units another 180: 360 earned minutes in 395 running, 91.1%, with 35 minutes of slow build.
Quality. One 50 kW unit failed hi-pot at 20:40 with a DC cable pinched under the cover. Its 45 minutes drop out of the good figure: 315 of 360, 87.5%.
OEE. 82.3% x 91.1% x 87.5% = 65.6%. Check: 315 / 480 = 65.625%, the same result. Method: how to calculate OEE.
Before pricing anything, run the queue test. The rack software showed free slots from 17:20 to 18:40, right after the board kit wait, and again after the model change and the screwdriver fault, while the camera add-on count showed an empty queue. That is the first reading: the racks were waiting on the cell, so its 85 stop minutes were lost output. The 35 slow-build minutes fell between 19:00 and 22:00, when three to five units queued and every slot was full. That is the second reading: the racks were the constraint then, and those minutes cost no output.
What the lost minutes cost
In the sun.store marketplace's August 2025 index, larger string systems above 15 kW "edged up by 2%" to EUR 24.35 per kW: about EUR 490 for a 20 kW unit and EUR 1,220 for a 50 kW unit. No public margin figure for inverter cells was found, so assume a contribution margin of 20% of that price, rounded to EUR 100 and EUR 240 per unit. A marketplace price sits above a plant's ex-works price, so this example errs high. The 20% is an example input, not a sourced figure. With orders waiting, a 50 kW cell minute is then worth EUR 240 / 45 = EUR 5.33. Rework crew time is EUR 40 per hour, close to Eurostat's 2025 estimate of EUR 40.3 per hour for industry in the euro area. Fabrico prices lost time from the plant's own SKU margin or price.
| Loss | Minutes | Example value |
|---|---|---|
| Board kit wait | 45 | EUR 240 (one 50 kW unit) |
| Model change | 25 | EUR 133 (25 x EUR 5.33) |
| Screwdriver fault | 15 | EUR 80 |
| Slow build | 35 | EUR 0 (slots full) |
| Hi-pot fail | 45 cell, 45 rework | EUR 30 (0.75 h x EUR 40) |
| Total | 165 | EUR 483 |
All 85 stop minutes fell on 50 kW work and left burn-in slots empty, so they are priced at margin: 85 x EUR 5.33 = EUR 453. The slow-build minutes are not priced, since full racks held output back while they happened. The hi-pot fail is priced at crew time: the test technician reworked the unit in 45 minutes, it passed its retest by 21:40 and joined the slot queue before the shift ended, so no margin was lost, only EUR 30. One shift: EUR 483. Five late shifts like it: EUR 2,415 a week. Pricing only the constraint's minutes at margin is the logic of throughput accounting.
The board kit wait tops the list at EUR 240, and it points at kitting and the SMT schedule, not the assemblers.
Margin is the right price only while orders are waiting. SolarPower Europe counted 82.1 GW of solar inverter manufacturing capacity in the EU in 2023, against around 60 GW of solar installed the same year, with around 35,000 jobs and at least 14 inverter companies in the EU. With capacity ahead of installations, many cells have no backlog. There, a lost bench unit is made up later, and the lost minutes are worth the crew time or overtime it takes, not EUR 5.33 a minute.
What a camera at the queue can and cannot see
An inspection camera checks parts. The queue test needs the other kind: one that logs a unit and the clock time it passed.
| Inverter plant job | Belongs to | Counting camera? |
|---|---|---|
| Check solder joints on the power board | AOI and X-ray | No |
| Prove insulation and earth continuity | Hi-pot and earth bond tester | No, read pass and fail |
| Log hours under load per unit | Burn-in rack software | No, read its log |
| Count closed units leaving the power-stage bench | A serial scan: exit time, no start time or standard | Yes |
| Count units waiting for a free burn-in slot | Nobody | Yes |
| See the closing bench exit during a 15:20 stop | The shift leader's notes | Yes, video for the minute of that stop |
Counting has limits of its own, and hands are the main one. In a peer-reviewed Advanced Robotics study, a fixed factory camera tracked manual assembly progress with a model built for workers covering the product. "In experiments, an 82.9% success rate is achieved for the progress estimation method using Anomaly Triplet-Net." That is a different task from counting a closed unit rolling onto a trolley, and it is one study, so the figure is not a counting accuracy. It shows where cameras struggle: when people and product overlap in the frame, even a purpose-built model misses.
So place the lens where units are apart from people: above the queue lane and the cell exit, looking down. Watch for glare from bright housings under hall lights and for units parked two deep. Check the camera count against the serial scans for several shifts before pricing a minute from it (method: how accurate a camera part count is).
Assemblers in view. Settle the purpose with the assemblers and any works council first, record who may open footage, and report by station and shift: Fabrico's camera add-on counts inverters and cartons, not assemblers. Checklist: production line cameras that do not surveil people.
First steps: count these, in this order
- The slot queue, in and out, beside last week's rack log, with the free-slot hours marked.
- The closing bench exit, per cell: one count per serial, cell minutes per power class.
- Stop codes for the cells: board kits, chokes or capacitors, model change, screwdriver fault, rework after hi-pot.
- Test results from the databases: leak, hi-pot, power-on and final test, never retyped.
- Cartons at packing, which closes the shift count.
Why output trails the rack nameplate is covered in capacity vs throughput. Five miscounts break the queue test if nobody fixes them first:
| Miscount | What OEE shows | Remedy |
|---|---|---|
| A burn-in reject counted again after repair | Inflated output, flattering quality | One count per serial at the closing bench; repair has its own code |
| Units counted at hi-pot and again at final test | Twice the real output | One output point; test stations supply good units |
| Heatsink assemblies added to closed units | Cell credited for half-built units | Subassemblies counted at their own station |
| 20 kW and 50 kW units treated as equal | Slow cell on big-unit days | Cell minutes per power class |
| Queue time booked as burn-in time | Racks look fuller than they are | Queue counted apart from occupied slots |
Before a pilot, put three questions to any OEE or camera vendor:
| Question | What to hear |
|---|---|
| How are the burn-in racks measured? | Slot hours from the rack software, queue counted separately. |
| How are burn-in rejects counted when they return? | As re-entries on the original serial, never as new output. |
| Where does the camera go at the queue and the closing bench? | Above the lane and the cell exit, looking down at the units, away from hands. |
Where Fabrico fits around the constraint
Fabrico runs OEE in the cloud and handles light MES work. In an inverter plant it covers two areas today:
- SMT line, testers, burn-in racks and final test: states, counts and pass or fail results come from the machines and test databases, so a grid simulator self test or a rack load fault lands on the timeline under its own code.
- Power-stage benches, slot queue and packing: the camera add-on counts heatsink assemblies, closed units, queued units and cartons. Clicking a 15:20 stop of the closing bench on the shift timeline opens the video for the minute of the stop, streamed on request by the camera add-on and not stored in Fabrico.
Stop reasons come from the assemblers and testers, keyed in on a phone or tablet beside the station. Lost minutes per station and shift appear in euros, from the plant's margin per model.
Roadmap: an alert from the camera add-on when units pile up at the slot queue while burn-in slots stand free, the third reading of the queue test, and a suggested stop reason the assembler accepts or edits.
Not in Fabrico: AOI, X-ray, torque records, hi-pot values, burn-in and grid test results, certificates. Fabrico inspects nothing; the rejects of those systems reach OEE as counts.
Further reading: camera-based OEE software, computer vision for OEE and OEE and MES software for manufacturing.
Questions about the inverter bottleneck
Which inverter station should get the first camera?
The burn-in slot queue, counted in and out. Read beside the rack log, it shows whether the cells or the racks set output that hour. The second camera goes over the closing bench exit.
Can a counting camera check thermal paste, screw torque or creepage distances?
No. Paste coverage is a process and assembler check, torque is the screwdriver controller's record, and insulation is the hi-pot tester's verdict. Their rejects reach OEE as counts; the camera add-on only tallies units leaving a station.
How is an inverter counted when it fails burn-in?
Once. It drops out of the good figure at the station that rejected it, the repair is booked at the rework bench under its own code, and it rejoins the slot queue without adding output at the closing bench.
Do microinverter lines need the same setup?
Partly. Microinverters run in far larger numbers with more automatic steps, and where they move through test in trays, the count unit becomes trays and units per tray. The slot queue logic still applies wherever trays wait for a free burn-in position.
Want the burn-in slot queue, the closing bench and packing on one shift timeline? Book a demo.
Related articles











Real Fabrico tiles, sample data.