


 Login
 Blog
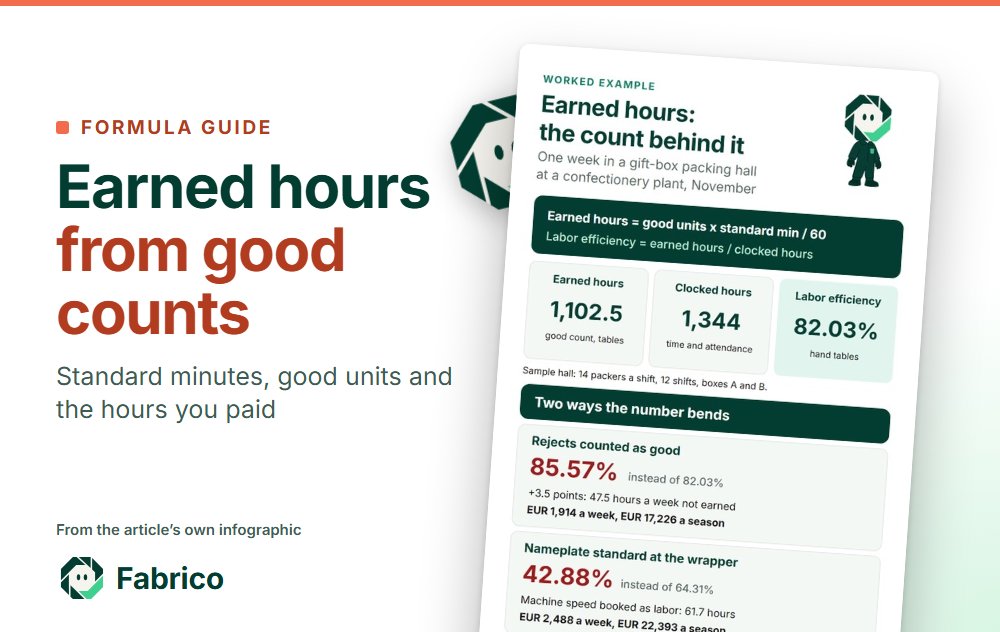
Earned Hours in Manufacturing: Formula and Labor Efficiency

In short: earned hours in manufacturing are the standard hours that a period's good output was worth. The earned hours formula is good units x standard hours per unit, added up over SKUs, and that is the whole earned hours calculation. The labor efficiency formula divides earned hours by clocked direct hours. Earned standard hours are only as good as the count and the standard behind them: count rejects as good, or take a standard from nameplate speed, and the comparison of standard hours vs actual hours stops describing the crew.
- Multiply the good count, never the total count, by the standard.
- Name the time study, the allowance formula and the date behind each standard.
- On a machine-paced station, labor efficiency is OEE in disguise: report OEE there.
- Use earned hours on manual stations with several SKUs, units per labor hour for staffing on a stable mix, OLE for why people's hours are lost.
Earned hours turn a week of mixed output into one number of hours, so a hall that packs a 16-praline box and a 24-truffle box can compare what it made with the hours it paid for. The arithmetic is short. The trouble sits upstream of it: which count goes in, which standard multiplies it, and which hours sit underneath.
This guide works one week in a seasonal gift-box packing hall at a confectionery plant in November: hand-packing tables, one flow-wrapper, three SKUs and a time study behind each standard. It shows what the formula gives, how a count that includes rejects and a standard taken from nameplate speed bend the result in opposite directions, what each is worth in EUR a week and over the season, and when earned hours are the wrong measure for a station.
The earned hours formula and the labor efficiency formula
Earned hours, also called earned standard hours or standard hours earned, are the hours the output should have taken at standard. For one SKU, earned hours = good units x standard minutes per unit / 60. For a mix, run the same line per SKU and add the results. Labor efficiency then compares that figure with the hours the work took: labor efficiency = earned hours / clocked direct hours x 100.
| Term | Formula | Where the input comes from | Who holds it |
|---|---|---|---|
| Good units | Total units minus rejects, per SKU | Line counts from the machine, sensors or a camera at a manual station; rejects from the checkweigher or quality check | Production |
| Standard minutes per unit | Normal time plus allowances, per SKU | Time study or a predetermined motion time system | Industrial engineering |
| Earned hours | Sum of good units x standard minutes / 60 | Calculated | Production report |
| Clocked direct hours | Hours booked to the hall's direct cost centre | Time-and-attendance system | HR or payroll |
| Labor efficiency | Earned hours / clocked direct hours x 100 | Calculated | Production manager |
Standard hours vs actual hours is the same comparison seen from the finance side. The open textbook Principles of Accounting, Volume 2 (OpenStax, Rice University), section 8.3 on labor variances defines the direct labor time variance as the comparison of the actual labor hours used with the standard labor hours expected for the actual units produced. If the actual hours are greater, the variance is unfavorable. Earned hours are those standard hours at actual output, so the labor efficiency on the floor and the time variance in the accounts should be built from the same numbers. Tying labor, material and overhead variances back to line losses is covered in manufacturing variance analysis.
The hours underneath need a rule too. The BLS Handbook of Methods page on productivity calculation computes labor productivity as an index of real output divided by an index of hours worked. Because its establishment survey collects weekly hours on an hours-paid basis, including time when employees are not at work, BLS applies ratios of hours worked to hours paid before it divides. The ILO report on the measurement of working time for the 18th International Conference of Labour Statisticians (2008) draws the same line: hours paid for may include paid leave and other paid absences, while short breaks for rest and refreshment count inside hours actually worked. A plant does not need national accounts, but it does need to decide which clocked hours count, write that down, and keep it. Which people and hours to include is set out in units per labor hour; the same rule serves earned hours.
Where earned standard hours come from: the time study behind each standard
A standard is the result of a study, not a target typed into a spreadsheet. The NPTEL industrial engineering lecture on work measurement (IIT) sets out the steps: time and rate the operator over the required number of cycles, multiply the representative watch time by the rating factor to get normal time, determine the allowances for fatigue and delays, and then standard time = normal time + allowances.
Lecture notes from the Eastern Mediterranean University industrial engineering course IENG 301 (chapter 22, 2019 to 2020) add the detail that moves earned hours. The usual equation, normal time x (100 + allowance %) / 100, is described there as not absolutely correct, and normal time x 100 / (100 minus allowance %) as the better one. For light work done 8 hours a day without organized rest periods, the same notes put personal time alone at 2 to 5 percent, 10 to 24 minutes a day.
Sample figures for illustration only. The hall's industrial engineering file holds three standards. The two hand-packed boxes carry a total allowance of 15% for personal time, fatigue and delays, a sample assumption for light seated work.
| SKU | Station | Normal time a box | Standard at x 1.15 | Standard at / 0.85 |
|---|---|---|---|---|
| A: praline box of 16 | Hand-packing table | 0.60 min | 0.690 min | 0.706 min |
| B: truffle box of 24 with ribbon | Hand-packing table | 0.90 min | 1.035 min | 1.059 min |
| C: foiled figures, pack of 3 | Flow-wrapper, crew of 3 | Machine-paced | 0.075 crew minutes a pack (3 people at 40 packs a minute) | |
The convention alone is worth 1.9 points of labor efficiency in the week below. On the divide-by-0.85 standards the tables show 83.92% instead of 82.03%, with the same boxes and the same hours. Either formula can be defended; mixing them across SKUs or across re-studies cannot. The file should name the formula, the rating scale and the allowance for each SKU. How to store those fields so a standard can be audited is covered in the time study data model, and standards built from tables of motion times instead of a stopwatch are covered in predetermined motion time systems.
SKU C is a different kind of standard. At the flow-wrapper the machine sets the pace, so the time study confirms the crew size and the rate the crew can sustain at the infeed, here 3 people at 40 packs a minute, and the standard is crew minutes per pack: 3 / 40 = 0.075. The wrapper's nameplate says 60 packs a minute. Which of those two rates goes into the standard decides what the wrapper's labor efficiency means.
Worked example: the earned hours calculation for a gift-box packing hall
Sample figures for illustration only. The hall runs a 9-week gift season, and the sample week falls in November. It works two 8-hour shifts, six days a week, so 12 shifts. Each shift has a 30-minute paid break, which leaves 450 planned minutes. 14 packers a shift work at hand-packing tables on boxes A and B; a crew of 3 runs the flow-wrapper on pack C.
The inputs come from three places. Boxes are counted as they leave each table, by a camera over the outfeed; the wrapper's controller counts its packs. A checkweigher after each stream rejects boxes with a missing piece and packs with a bad seal. The time-and-attendance system books 14 x 8 x 12 = 1,344 clocked hours to the tables and 3 x 8 x 12 = 288 to the wrapper.
| SKU | Standard | Counted | Rejected | Good | Earned hours |
|---|---|---|---|---|---|
| A: praline box of 16 | 0.690 min | 58,000 | 2,030 | 55,970 | 643.66 |
| B: truffle box of 24 | 1.035 min | 28,000 | 1,400 | 26,600 | 458.85 |
| Hand tables | 86,000 | 3,430 | 82,570 | 1,102.51 of 1,344 clocked: 82.03% | |
| C: foiled figures, pack of 3 | 0.075 crew min | 151,200 | 3,024 | 148,176 | 185.22 of 288 clocked: 64.31% |
The arithmetic, line by line: 55,970 x 0.690 / 60 = 643.66 hours, and 26,600 x 1.035 / 60 = 458.85 hours, so the tables earned 1,102.51 hours against 1,344 clocked, a labor efficiency of 82.03%. At the wrapper, 148,176 x 0.075 / 60 = 185.22 earned hours against 288 clocked: 64.31%. Rejects ran at 3.5% for A, 5.0% for B and 2.0% for C.
Blending the two areas into one hall figure gives 1,287.73 / 1,632 = 78.90%. That number moves with the product mix more than with anyone's work: a week with more wrapper packs looks worse even if every station repeats this week. Report the tables and the wrapper apart, for reasons the next two sections put in numbers.
Counting rejects as good: how the count inflates labor efficiency
The tables' boxes are counted as they leave the table, and the checkweigher rejects 2,030 A boxes and 1,400 B boxes further down. If the weekly report multiplies the table count by the standard instead of the good count, earned hours become 58,000 x 0.690 / 60 + 28,000 x 1.035 / 60 = 667.00 + 483.00 = 1,150.00, and labor efficiency 85.57% instead of 82.03%, 3.5 points better than the hall worked. The 47.50 hours of difference are the standard time of 3,430 boxes that failed: the hall spent those hours, and the report credits them as earned.
A rejected box is not output. The rule that keeps rejects out of OEE's quality factor keeps them out of earned hours; where each count belongs is covered in good count vs total count. Rework is a separate case: a box reopened and repacked earns its standard once, when it passes, and the repacking time stays in the clocked hours.
The error travels into the staffing plan. A planner who staffs the last weeks of the season from the reported 85.57% books 1,102.51 x 1,344 / 1,150.00 = 1,288.5 clocked hours to pack the same good boxes the tables packed this week. The hall needs 1,344. The gap of 55.5 hours a week is close to 7 packer shifts of 8 hours, and it shows up in December as late orders. The staffing plan lives in the planning spreadsheet or the workforce tool; what it needs from the floor is an efficiency built on good counts.
What the reject gap is worth. Labor is priced at the Eurostat 2025 hourly labour cost figures, which put industry in the euro area at EUR 40.3 an hour (page last edited 31 March 2026). The whole-economy figure across EU countries runs from EUR 12.0 in Bulgaria to EUR 56.8 in Luxembourg, so use your own rate when you have it. Margin comes from the NYU Stern margins by industry dataset (Aswath Damodaran, data as of January 2026), where 78 U.S. food processing firms show a gross margin of 23.23%. The box prices are sample ex-works prices: EUR 6.80 for A and EUR 10.90 for B. Use your own SKU margin when you have it.
| View | Calculation | A week | A season of 9 weeks |
|---|---|---|---|
| Labor spent on boxes that failed (the hall has hours to spare) | 47.50 h x EUR 40.3 | EUR 1,914.05 | EUR 17,226.44 |
| Margin on boxes not shipped (season sold out, rejects scrapped) | 2,030 x EUR 6.80 + 1,400 x EUR 10.90 = EUR 29,064 of sales x 23.23% | EUR 6,751.57 | EUR 60,764.10 |
| Labor time variance in the accounts, good count | (1,344 minus 1,102.51) h x EUR 40.3 | EUR 9,732.25 | EUR 87,590.24 |
| The same variance on the total count | (1,344 minus 1,150.00) h x EUR 40.3 | EUR 7,818.20 | EUR 70,363.80 |
The first two rows are two views of one loss, not a sum: the labor view applies while the hall has hours to spare, the margin view when every box sells and a rejected box is scrapped. The last two rows show where the error lands in the accounts. Priced on the total count, the tables' unfavorable time variance shrinks by EUR 1,914.05 a week, the same EUR 1,914.05 as the first row. Gross margin still carries the plant's fixed costs, so it understates what one more box adds, which keeps the margin row on the safe side.
Nameplate standards: when labor efficiency is really OEE
At the flow-wrapper the crew does not set the pace. Earned hours there are good packs x crew / rate, and clocked hours are crew x clocked time, so the crew size cancels out: labor efficiency = good packs / (rate x clocked minutes). With the time-study rate, that is 148,176 / (40 x 480 x 12) = 64.31%, the figure in the table above.
Now the OEE of the same wrapper. Its controller shows 5,040 minutes of run time out of 5,400 planned, 151,200 packs counted and 3,024 rejected. Measured against the time-study rate of 40 packs a minute, OEE is 93.33% x 75.00% x 98.00% = 68.60%. And 68.60% x 450 / 480 = 64.31%: on a machine-paced station, labor efficiency is the machine's OEE scaled by planned time over clocked time. The labor figure is measuring the machine.
Swap the standard for the nameplate rate, 60 packs a minute, and it falls to 3 / 60 = 0.05 crew minutes a pack. Earned hours drop to 148,176 x 0.05 / 60 = 123.48, and labor efficiency to 42.88%, down 21.4 points. The crew loaded the same packs in the same hours. What changed is that the standard now books the gap between the 40 packs a minute the crew can feed and the 60 the machine is rated for as a labor shortfall of 61.74 hours a week.
In money, at the same EUR 40.3 an hour, the wrapper's labor time variance grows from (288 minus 185.22) x 40.3 = EUR 4,142.03 to (288 minus 123.48) x 40.3 = EUR 6,630.16 a week. The difference, EUR 2,488.12 a week and EUR 22,393.10 over the season, is machine speed reported as people's time. A nameplate standard pulls labor efficiency down, the opposite of the reject error; a standard set from a slow week or a derated speed does the reverse and inflates it, hiding the same speed loss from both reports.
The fix is a split of jobs. OEE can keep the nameplate as its ideal rate, which on this wrapper gives an OEE of 45.73% and a performance factor of 50.00%; showing the 40 to 60 gap as a speed loss is the job of OEE, and the method is set out in OEE calculation. The labor standard takes the rate the time study found for the crew. Engineering owns the speed gap; the crew owns the pace at the hand tables.
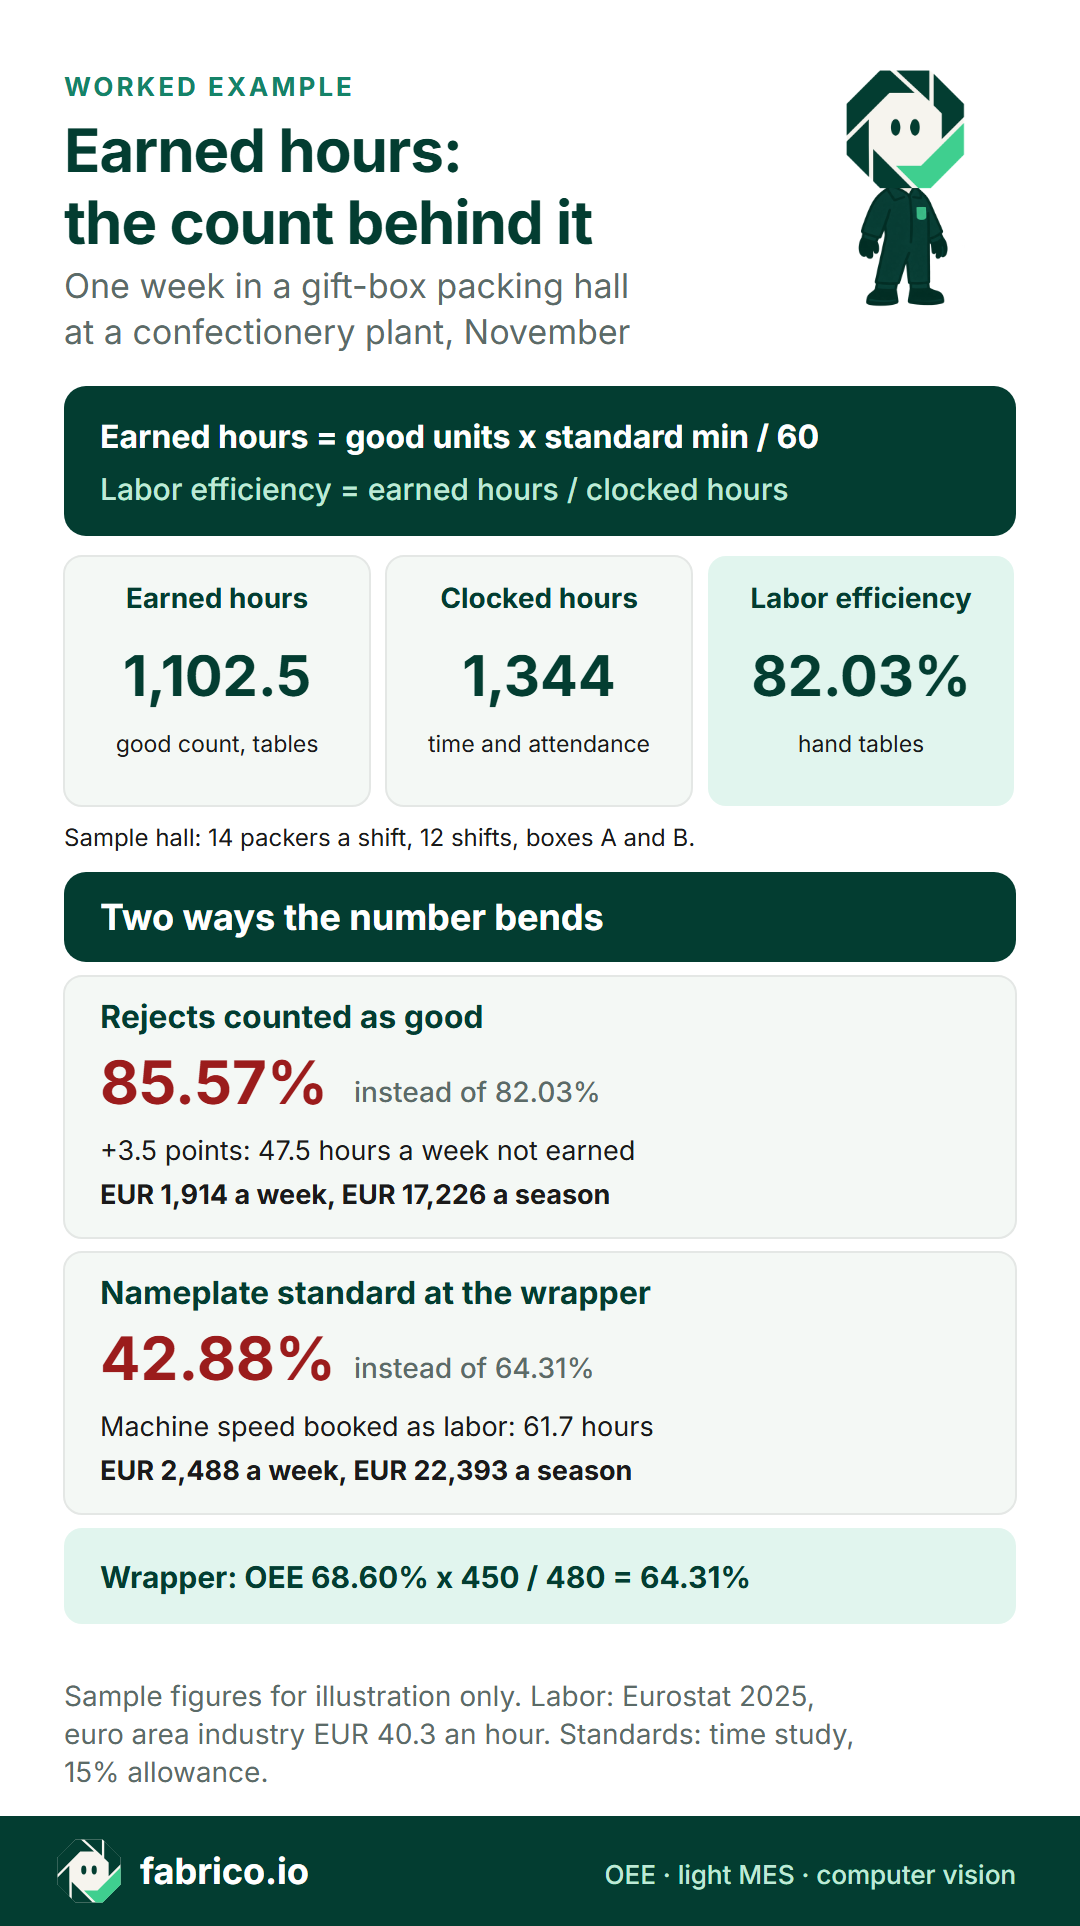
Text version of this infographic
- Earned hours = good units x standard minutes / 60. Labor efficiency = earned hours / clocked direct hours.
- Hand tables, one week: 1,102.5 earned hours on the good count, 1,344 clocked hours, labor efficiency 82.03%.
- Rejects counted as good: 85.57%, 3.5 points too high, 47.5 hours a week not earned, EUR 1,914 a week and EUR 17,226 a season.
- Nameplate standard at the wrapper: 42.88% instead of 64.31%, machine speed booked as labor, EUR 2,488 a week.
- At the wrapper, labor efficiency = OEE 68.60% x 450 / 480 = 64.31%.
- Sample figures. Labor: Eurostat 2025, euro area industry EUR 40.3 an hour.
How earned hours connect to OEE and to OLE
At the hand tables the labor figure does measure people, and it splits into three parts. The hall's stop log shows 84 table-hours in the week with no product at the tables, waiting for pralines from the moulding line. That leaves 1,260 packing hours out of 1,344.
- Time: 1,260 / 1,344 = 93.75% of clocked hours spent packing.
- Pace: 1,150.00 earned hours on the total count / 1,260 packing hours = 91.27%.
- Good count: 1,102.51 earned hours on good boxes / 1,150.00 on all boxes = 95.87%.
- Product: 93.75% x 91.27% x 95.87% = 82.03%, the labor efficiency from the earned hours calculation.
Those three factors are the shape of overall labor effectiveness (OLE): availability, performance and quality applied to labor. This page does not re-teach OLE. The point here is that earned hours are the bridge into it. The pace factor is earned hours on the total count over the hours people spent working, and the good-count factor is earned hours on good units over earned hours on all units. A plant that already runs earned hours has the labor standard OLE needs; what it adds is people's lost time by reason. Because OLE's performance factor also compares output with the labor standard, a nameplate standard drags OLE down the same way it drags labor efficiency. The two families of measures side by side are compared in OEE vs OLE.
The 84 waiting hours also show why one efficiency figure can mislead: 6.25% of the clocked time went to supply from upstream, not to pace at the table. At EUR 40.3 an hour that is EUR 3,385.20 a week, and its owner is whoever schedules the moulding line, not the packing supervisor.
Earned hours vs units per labor hour vs OLE: which measure for which line
The four measures answer different questions, and each needs a different set of inputs. The effort figures below are people's time only, priced at the Eurostat 2025 range of EUR 12.0 to EUR 56.8 an hour; the hours are labelled sample assumptions.
| Measure | Use it on | What it needs | Effort (sample) | Owner |
|---|---|---|---|---|
| Earned hours and labor efficiency | Manual stations with several SKUs: hand-packing tables, kitting, manual assembly | Good count per SKU, a standard per SKU, clocked direct hours | A time study of 4 to 12 analyst hours per SKU: EUR 48.00 to EUR 681.60; the hall's 3 SKUs at EUR 40.3: EUR 483.60 to EUR 1,450.80 | Industrial engineering sets standards; the production manager owns the weekly figure |
| Units per labor hour | One SKU or a stable mix; staffing and cost-per-unit trends | Good count and clocked hours | No study; 1 to 2 hours a week to compile by hand: EUR 12.00 to EUR 113.60 a week | Plant manager and finance |
| OLE | Stations where people's time is lost to waiting, absence or training, and the cause matters | The same labor standard, plus people's lost time by reason | The earned hours effort, plus recording lost time by reason at the station | Production manager with HR |
| OEE | Machine-paced stations: flow-wrappers, fillers, cartoners | Good and total counts, run time and stop reasons from the machine | No labor standard; counts and run time from the machine's controller or sensors | Production and engineering |
Choose earned hours where people set the pace and the SKUs differ in work content, like the hand tables. Choose units per labor hour where one staffing number is enough and the mix holds still. It is blind to mix: this week the tables packed 82,570 good boxes in 1,344 hours, 61.44 boxes per labor hour. A week of 50,000 A and 32,000 B boxes in the same hours earns 575.00 + 552.00 = 1,127.00 hours, a labor efficiency of 83.85%, while units per labor hour fall to 61.01. The better week looks worse. Choose OEE where a machine sets the pace, like the wrapper, and report the crew there as hours, not as an efficiency. Choose OLE when the question is why people's hours are lost, not only the total.
Who decides. Industrial engineering owns the standards, their re-study and the allowance formula. The production manager owns the weekly efficiency report and the split by station. Finance owns the labor variance and agrees which standards feed costing. HR or payroll owns the hours rule inside the time-and-attendance system. A change to any one of the four inputs is a change to the others' numbers, so the four agree it together.
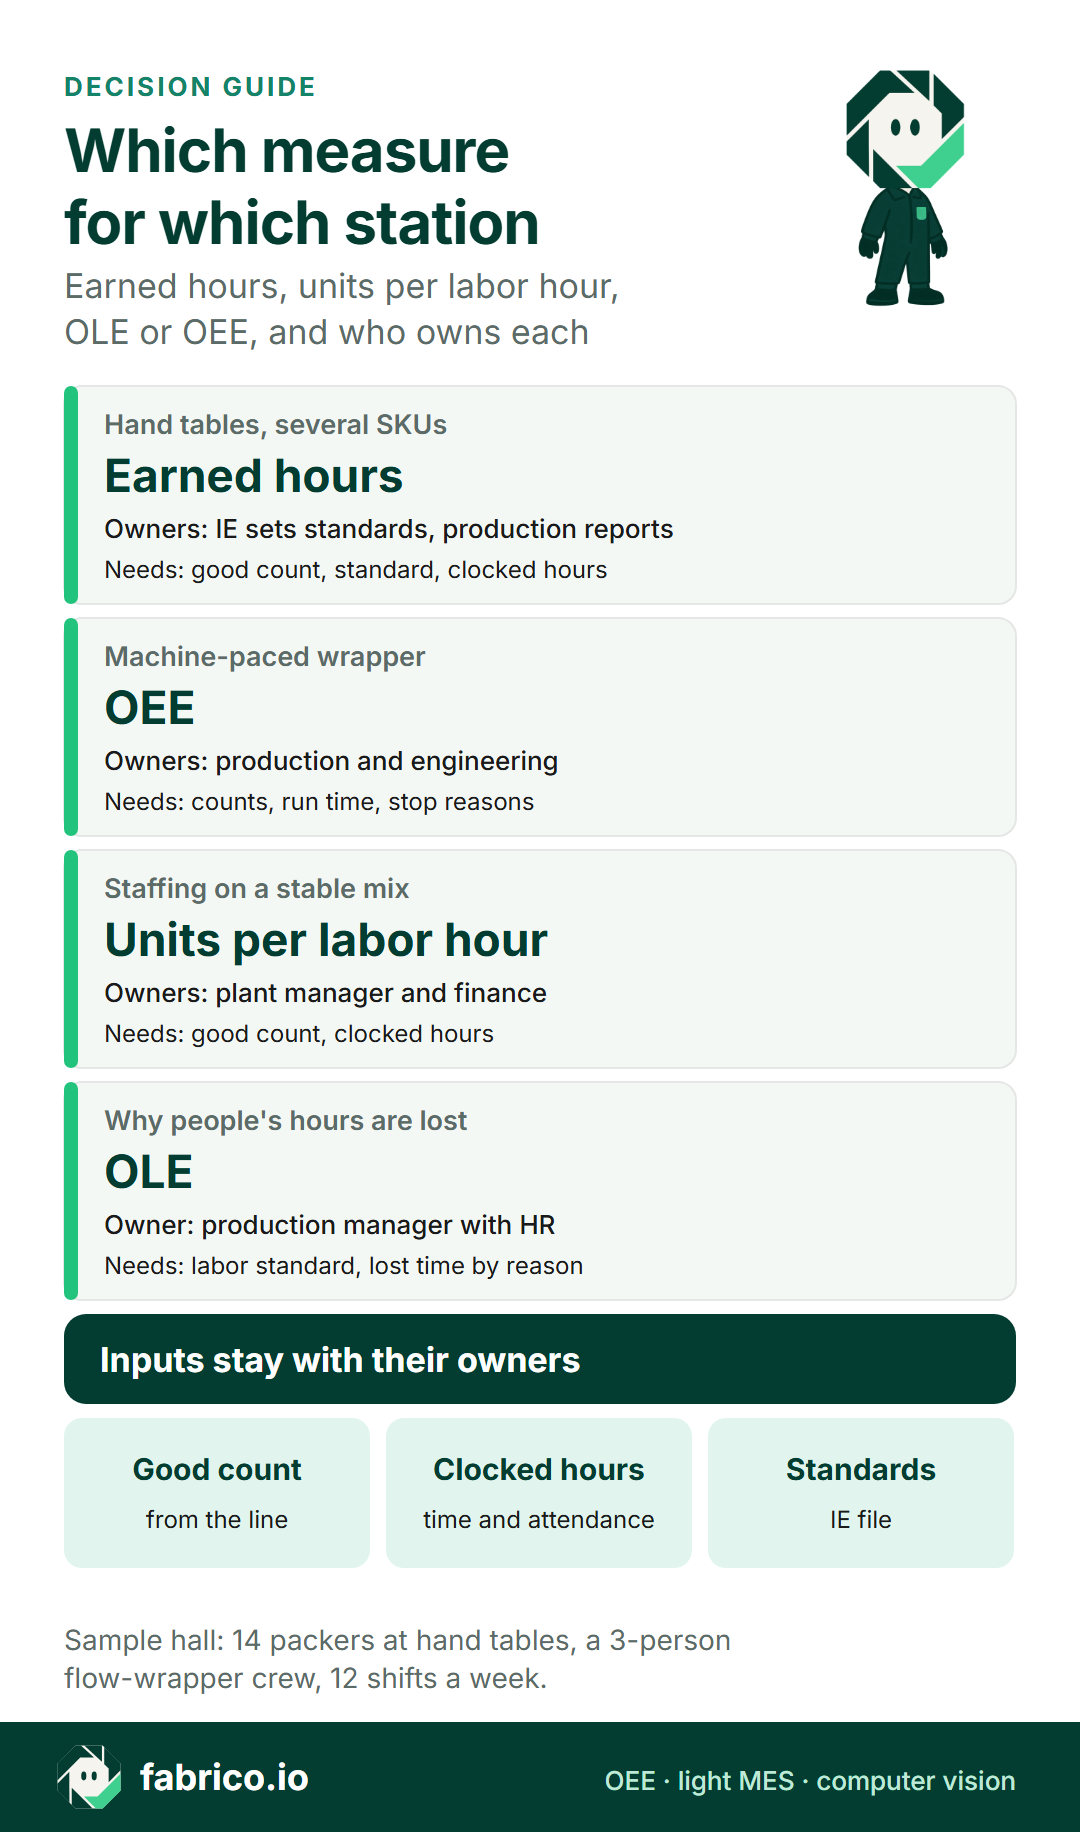
Text version of this infographic
- Hand tables with several SKUs: earned hours and labor efficiency. Industrial engineering sets the standards, production reports the figure.
- Machine-paced wrapper: OEE. Production and engineering.
- Staffing on a stable mix: units per labor hour. Plant manager and finance.
- Why people's hours are lost: OLE. Production with HR.
- Inputs: good count from the line, clocked hours from time and attendance, standards from the industrial engineering file.
Questions to put to the industrial engineering team, or to any vendor of line software:
- Does the efficiency report multiply the good count or the total count, and where on the line are rejects counted?
- Which allowance formula, rating scale and study date sit behind each standard?
- At machine-paced stations, is the labor standard set from a time study of the crew or from nameplate speed?
- Which clocked hours are in the denominator, and are borrowed people and overtime included?
- Can good and total counts be split by line, shift and SKU and exported to the industrial engineering and finance files?
- Do the floor report and finance's labor time variance use the same standard hours?
A checklist for earned hours you can trust, this week and this quarter
None of these steps needs new software. Each one closes a gap the worked example put a number on:
- This week: Reconcile one shift of table counts with the checkweigher's rejects, box by box.
- This week: Switch the earned hours report from the table count to the good count.
- This week: Write down which allowance formula, rating scale and study date sit behind each standard.
- This quarter: Re-study each machine-paced standard at the rate the crew sustains, and report those stations in OEE.
- This quarter: Agree the hours rule with HR or payroll: which cost centres, borrowed people and overtime count.
- This quarter: Tie the floor's earned hours to finance's labor time variance once a month.
- This quarter: Re-study a standard when the box, the method or the crew changes, and keep the old version.
The first step is the cheapest and finds the largest error in this hall: one shift of table counts laid beside the checkweigher's rejects shows whether the report counts 3,430 failed boxes a week as earned. The fourth step moves the wrapper out of the labor report and into OEE, where its speed gap belongs. The last step keeps the standards honest across seasons: the box, the insert and the crew change from one Christmas to the next, and a standard studied on last year's box earns the wrong hours on this year's.
Where Fabrico fits
Fabrico is light MES and OEE software for the plant floor. In an earned hours report it supplies the counts and the run time; the other two inputs stay with the teams that hold them today:
- Good and total counts and run time per line and shift come from the machine's PLC or an IoT device with sensors on the machines you connect. At manual stations such as packing tables, the camera add-on counts output.
- Clocked hours come from the time-and-attendance system, and standards from the industrial engineering file. Counts export to Excel for wherever the earned hours report is built, and Fabrico also has a REST API and webhooks.
- Real-time OEE (availability x performance x quality) per line and shift reports a machine-paced station like the wrapper, with the stop reason given by the operator at the machine.
- With the selling price and margin of each SKU entered, losses are priced in money.
With OEE software on the wrapper and a camera add-on over the tables, the good count per shift is a figure someone reads, not a tally someone adds up, and a reject gap like the one in this hall shows on the shift it happens. The walkthrough below shows a line screen, stops and waste.
Demo data is synthetic. Book a demo.
Plays from YouTube. Google may set cookies when you press play. Privacy policy.
For the camera side at hand-packing tables, see OEE for a manual packing station and MES and OEE with computer vision for the camera add-on; where the camera add-on covers a station, the video for the minute of a stop can be opened from the shift timeline, streamed on request and not stored in Fabrico. For the lines upstream of the hall, see OEE for confectionery and chocolate lines. The MES and OEE solution overview shows the screens.
Sources, accessed 18.11.2026: OpenStax, Principles of Accounting Vol. 2, 8.3; BLS Handbook of Methods, productivity calculation; ILO, Measurement of working time, ICLS 2008; NPTEL, work measurement lecture; Eastern Mediterranean University, IENG 301 chapter 22; Eurostat hourly labour costs; NYU Stern margins by sector.
Questions about earned hours
What are earned hours in manufacturing?
Earned hours, also called earned standard hours or standard hours earned, are the standard hours a period's good output was worth: good units times the standard time per unit, added up over SKUs. They let a plant compare a mixed output with the hours it paid for, in one unit.
How do you calculate earned hours?
Multiply the good count of each SKU by its standard time per unit in hours, or by its standard minutes and divide by 60, then add the SKUs. For example, 1,200 good boxes at a standard of 0.05 hours a box earn 60 hours.
What is the difference between standard hours and actual hours?
Standard hours are what the actual output should have taken at standard. Actual hours are what it took, from the time-and-attendance system. Finance prices the gap at the standard rate as the direct labor time variance; on the floor, the ratio of the two is labor efficiency.
What is the labor efficiency formula in manufacturing?
Labor efficiency = earned hours / actual direct hours x 100. A figure above 100% means the work took fewer hours than the standard allows, so check the count and the standard before reading it as a faster crew.
Should earned hours use the good count or the total count?
The good count. A rejected unit earns nothing, and counting it as good credits the hours spent on it as productive, which overstates labor efficiency. A reworked unit earns its standard once, when it passes.
Can labor efficiency be above 100%?
Yes, when the work takes fewer hours than the standard allows. A figure that stays above 100% is a reason to check three things: rejects in the count, a standard set from a slow rate or with allowances added twice, and hours missing from the denominator.
Are earned hours useful on a machine-paced line?
Less so. When a machine sets the pace, labor efficiency equals the machine's OEE scaled by planned time over clocked time, so it measures the machine rather than the crew. Use OEE there and report the crew hours beside it.
Want to see good and total counts by line and shift on a live line screen? Book a demo.
Related articles











Real Fabrico tiles, sample data.