


 Login
 Blog
Equipment Downtime Tracking Software: How It Works and 5 Tools Compared (2026)
TL;DR
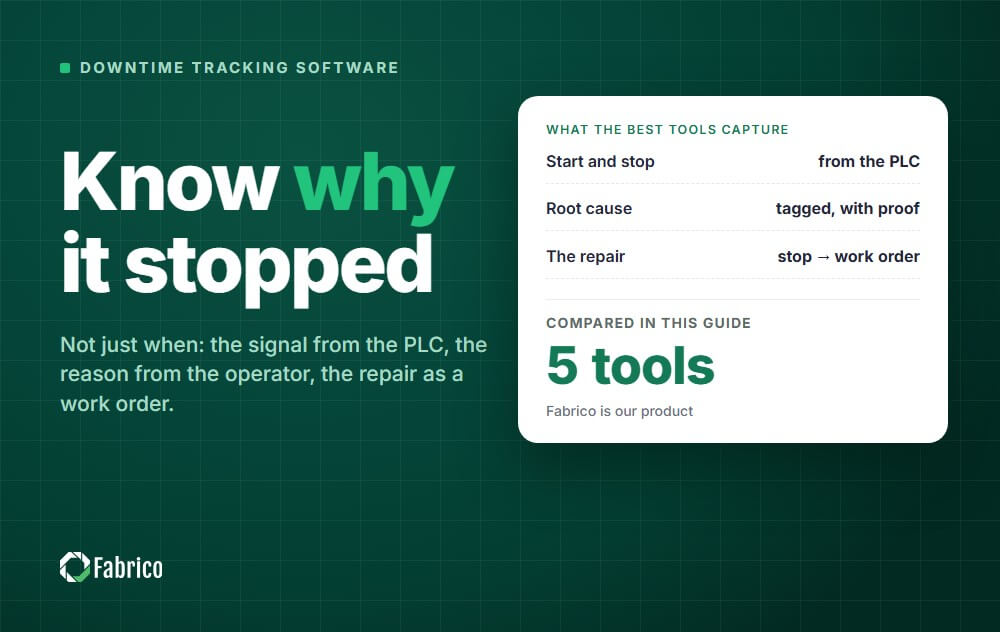
Equipment downtime tracking software records when a machine or line stops, how long it stood still and why, then ranks the causes by the time they cost. The tools worth a shortlist in 2026 take the stop and the restart from the machine signal on connected machines, short stops included, and ask the operator for the reason at the line in a few taps.
The result is downtime by cause, machine and shift, the input every OEE and continuous improvement effort needs. Below: how it works on the shop floor, what to record, the tracking methods compared, 5 tools, the questions to ask each vendor and a FAQ. For the definition and the formula, see equipment downtime.
- Why it matters: Knowing that a line was down for 10 minutes is easy. Knowing why, with the reason recorded while people still remember it, is what lets the team fix it.
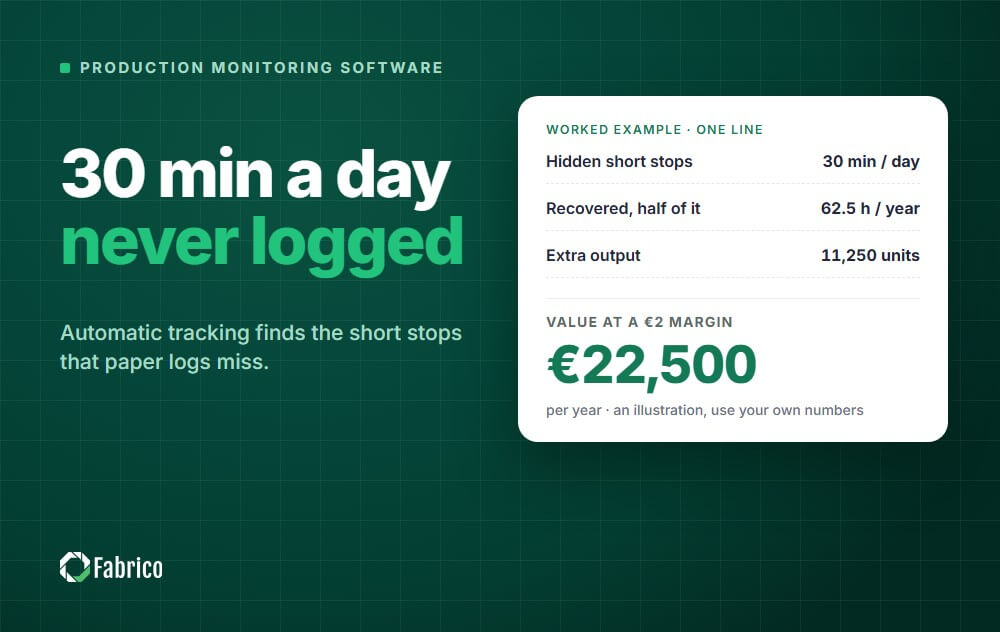
- Automated vs. manual: Taking start and stop from the PLC or a sensor removes the guesswork about durations. Manual logsheets tend to underreport downtime, since short and frequent stops often go unlogged.
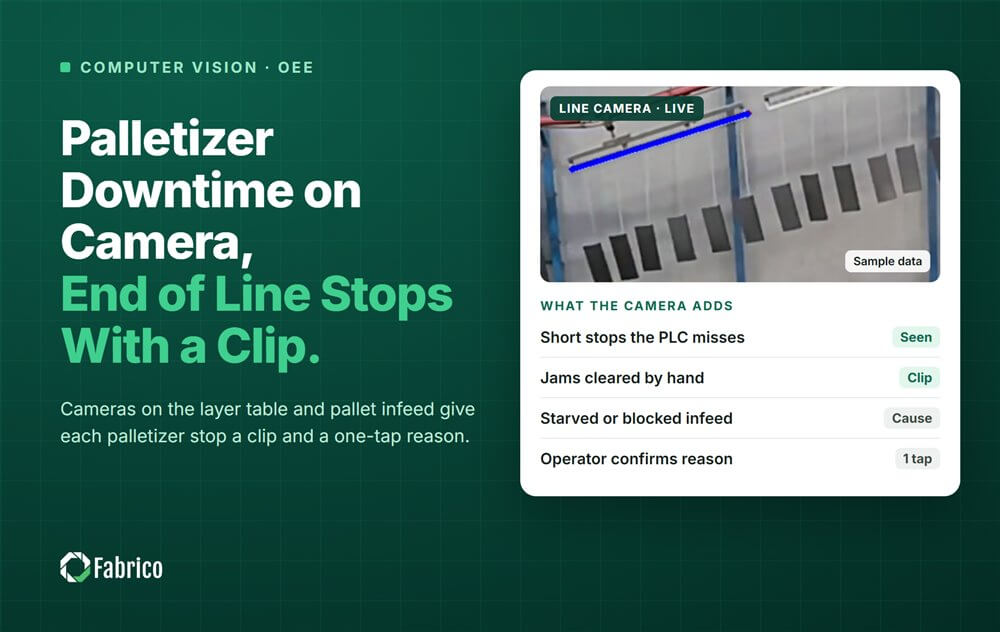
- Video on camera lines: Where an AI camera (an add-on) is set up, you can open its video for any moment on the timeline; in the standard setup, the video is streamed, not stored in Fabrico.
- Follow-up: Tracking pays off when the biggest cause gets fixed. In Fabrico, a work order is opened from the stop in one step, linked to the line.

What downtime tracking software does on the shop floor
- Catches stops on connected machines as they happen, with start time and duration from the machine, including the short ones nobody writes down.
- Gets the reason while people still remember it: the operator tags the cause at the line, not at the end of the shift.
- Separates planned from unplanned stops, so breaks, cleaning and changeovers do not hide the breakdowns.
- Ranks the causes by total time, frequency and average duration, per line and shift, so the team knows which loss to attack first.
- Feeds OEE: stop time becomes availability loss, slow running and micro-stops become performance loss.
How downtime is captured in Fabrico
- The signal. Fabrico reads stop and run from the PLC or from a Fabrico IoT device with sensors on older machines. AI cameras (an add-on) count parts where there is no signal. Where no sensor counts them, operators add stop reasons, good parts and scrap on a tablet or phone.
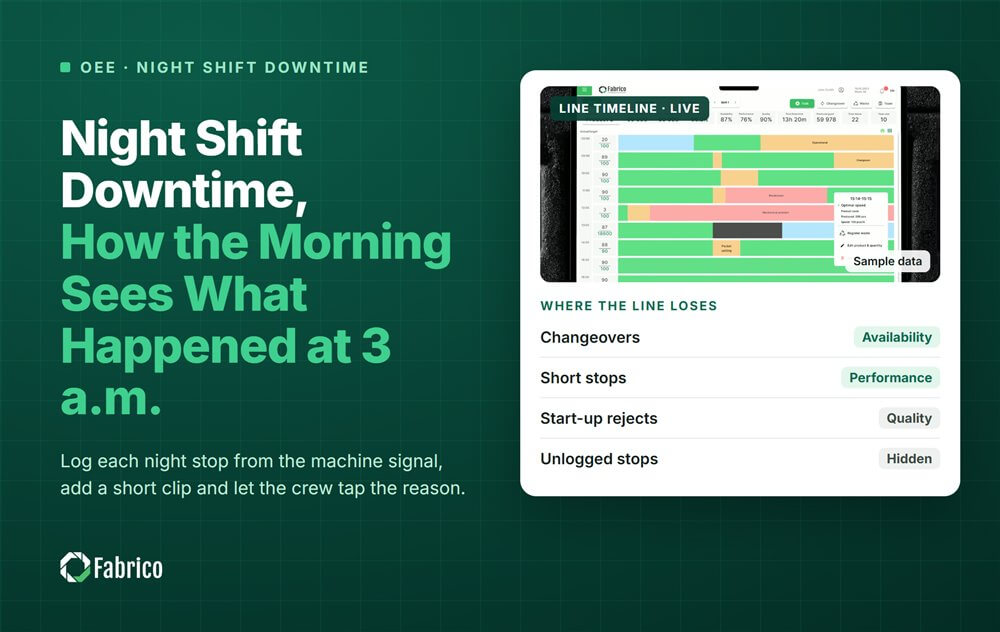
- The reason. When the line stops, the operator sees the downtime counter and picks the machine, then the reason, red for unplanned and amber for planned, with an optional comment. Stops excluded from OEE, such as a regulatory inspection, still show in total downtime.
- The clean-up. Unclassified time is easy to fix later: select a stretch, merge or split it and give it a reason. Stops shorter than the micro-stop threshold you set are not logged one by one but still count as lost speed.
- The video. Where an AI camera (an add-on) is set up, you can open its video for any moment on the timeline; in the standard setup, the video is streamed, not stored in Fabrico. Stop reasons come from operators; suggested stop reasons are planned, on the roadmap.
- The follow-up. OEE analytics show the top 10 unplanned and planned reasons and a stoppage table with downtime, frequency and average duration by line. Maintenance is built in: a work order is opened from the stop in one step, linked to the line, so breakdowns reach the technicians in the same system.
Want to see stops ranked by cause on lines like yours? Book a demo or contact us.
What to record for each stop
| Field | Why it matters |
|---|---|
| Start time and duration | Comes from the machine, so the total is exact and nobody rounds it |
| Machine | Shows which machine in the line actually stopped the flow |
| Reason and reason group | Turns minutes into causes you can act on |
| Planned or unplanned | Keeps breaks and cleaning out of the breakdown count |
| Product and shift | Reveals stops that only happen on one product or one crew |
| Comment | Gives engineers the context for finding the cause |
Who uses downtime tracking
- Operators tag the reason in seconds and see the line status on the shop-floor TV.
- Shift leads react to a long stop while it is still running.
- Plant managers open the morning meeting with the top downtime reasons of the last 24 hours.
- Continuous improvement and maintenance engineers pick the next project from a Pareto of causes and check whether the fix held.
Downtime tracking methods compared
| Method | What it catches | What it misses |
|---|---|---|
| Paper log at the line | Long, memorable breakdowns | Short stops, exact durations, most reasons |
| Spreadsheet after the shift | Totals someone remembers | Timing, small stops, consistency between shifts |
| Machine signal only | Stops and their exact duration | Why the machine stopped |
| Signal plus operator reason (light MES) | Stops, their duration and their cause | Causes the operator did not see |
| Signal, reason and camera video (AI cameras, an add-on) | Stops, their cause and the video of that moment | Needs AI cameras (an add-on) on the line |
How we compared manufacturing downtime tracking software
In 2026, many factories still track downtime on whiteboards or Excel sheets. The operator writes: "10:00 - 10:15: Machine Stopped."
This data is usually a guess, and it provides zero insight into how to prevent it from happening again.
Manufacturing downtime tracking software connects directly to your machinery (via PLC/IoT) to capture the exact second the line stops. But capturing the time is just the first step.
You need to capture the reason.
We picked 5 tools that often appear on downtime tracking shortlists. Fabrico is our product; for MachineMetrics, Vorne XL and Worximity we describe what each vendor says on its own website, with links and the date we checked. It is not a ranking, so use the questions further down to test each one on a pilot line.
Each tool below is compared on how it captures the stop and the reason behind it. Fabrico's downtime tracking software, part of its MES and OEE platform, records stops and their duration straight from the machine, and operators tag the cause.
1. Fabrico: OEE and light MES with stop causes and follow-up
What it is: Fabrico, our product, is a cloud-based OEE and light MES platform. Machine data comes from the PLC, from a Fabrico IoT device with external sensors on older machines, or from AI cameras (an add-on) where there is no machine signal.
How it tracks downtime:
- Stops from the machine: Connected machines report their own stops, including short stops too brief to log by hand. Operators add the stop reason on a tablet or phone.
- Micro-stops in OEE: Micro-stop detection and real-time OEE per line and shift, so short stops count as lost performance instead of vanishing from the report.
- Cost per loss: Revenue at risk and profit impact per loss, in real time, so the team starts with the downtime that costs the most.
- Video of a moment: Where an AI camera (an add-on) is set up, you can open its video for any moment on the timeline, so the team can see what happened before deciding what to fix. In the standard setup, the video is streamed, not stored in Fabrico.
- Follow-up: Maintenance (CMMS) is built in, on the same machine and production data, so the maintenance software and the stop data are one system. A work order is opened from the stop in one step, linked to the line.
Fits: Plants that want downtime by cause, OEE and the repair follow-up in one system. Ask us: which machines connect through the PLC, which need an IoT device and where AI cameras (an add-on) make sense.
2. MachineMetrics
How it describes itself: "The AI-powered operating system for discrete manufacturing."
- Stops: "Events are detected the moment they happen, straight from machine data, with no operator input and no minimum duration."
- Reasons: "A configurable rules engine assigns reasons from alarms, alarm messages, and machine state".
- Connection: "Connect directly to 1,000+ machine controllers and sync with your ERP in real time." "Older equipment connects through sensors and IO adapters."
- Maintenance: "Feed your CMMS with critical machine information to automatically create work orders."
Ask MachineMetrics: how operators add context to a stop, and how a work order reaches your CMMS.
Sources: MachineMetrics pages on its platform, downtime tracking, connect, maintenance, checked 5 November 2026.
3. Vorne XL
How it describes itself: "XL is a standalone device that includes I/O to communicate with your process".
- Connection: "Wire one or two sensor inputs from an existing machine photo-eye, relay, proximity switch, or encoder to XL."
- Stops: "XL automatically detects downtime using a single input from your equipment".
- Reasons: "Your operators scan barcodes to indicate reasons for each downtime event".
- Reports and display: "Immediately leverage the data XL collects with built-in reports like OEE, Downtime, TEEP, Changeover, Top Losses". "The XL scoreboard answers these questions in real-time."
Ask Vorne: how XL data reaches your maintenance system or ERP, and how several lines or plants are compared side by side.
Sources: Vorne's home page, reduce downtime page, checked 5 November 2026.
4. Evocon (Best for Simplicity)
The Verdict: A lightweight, cloud-based OEE tracker that is easy to deploy on legacy lines.
Evocon focuses on "OEE made simple." It uses simple IoT sensors to count products and detect stops. Its dashboard is clean and intuitive, making it a favorite for factories replacing paper logs for the first time.
It tracks downtime reasons well via an operator tablet interface.
Pros:
-
Very intuitive user interface.
-
Works on any device (Cloud-based).
-
Good "Shift View" visualization.
Considerations:
-
Limited Depth: Puts less emphasis on the deep maintenance planning and inventory features of a full MOM platform like Fabrico.
-
Manual inputs: Heavy reliance on operators manually selecting downtime reasons.
Best For: SME manufacturers needing a quick, standalone OEE solution.
5. Worximity
How it describes itself: "OEE and real-time production monitoring that boosts efficiency, improves profitability".
- Connection: "Connect any machine or production process".
- Stops: "Pinpoint and reduce unplanned downtime and slow changeovers by tracking real-time machine status."
- Reasons: "Justify unplanned downtime in just three clicks or schedule planned stops directly in your shifts."
- Alerts and speed: "Avoid excessive downtime by setting alerts when lines are down." "Compare actual vs. ideal run speeds to identify where your production is underperforming".
Ask Worximity: how a stop becomes a repair job for your maintenance team.
Sources: Worximity's home page, OEE monitoring, Measure pages, checked 5 November 2026.
Comparison matrix
It is not a ranking, so ask each vendor directly.
| Feature | Fabrico | MachineMetrics | Vorne XL | Evocon | Worximity |
| Primary Approach | OEE and light MES | Data (CNC IoT) | Visual (Hardware) | Simple Cloud | Financial Cost |
| Video | AI cameras (an add-on): open the video for a moment on the timeline | Varies | Varies | Varies | Varies |
| Work Order from the Stop | Opened from the stop in one step | Varies Integration | Varies | Varies | Varies Integration |
| Deployment | Software / IoT | Hardware Adapter | Hardware Box | IoT Sensors | Wireless IoT |
| Best Asset Type | All (Line/Process) | CNC / Discrete | Conveyor / Line | Packaging / Line | Food / Bev |
Questions to ask every downtime tracking vendor
- Where does the stop come from? The PLC, a sensor you add, a camera or the operator, and what happens on machines with no signal.
- What is the shortest stop it records? And how stops below that threshold still count as lost speed in OEE.
- Who sets the reason, and when? The operator at the line, a rule from machine alarms, or someone after the shift.
- How are planned stops kept apart? Breaks and cleaning should not land in the breakdown count, and changeovers should be booked as their own availability loss, not as breakdowns.
- What happens after the stop? How a breakdown becomes a repair job, and in which system.
- How does it compare lines and plants? The same stop definitions on every line, shift and site.
- What will the pilot prove? Agree before you start which line, which losses and which numbers you will compare afterwards.
Once the data is in, see how to diagnose line stops by machine. To act on early signs before a long stop, see how to prevent unplanned downtime.
Start with one line
Pick the line where lost output hurts most, connect its machines and let the top causes repeat for a few weeks. Fix the biggest one, check in the data that it stayed fixed, then add the next line.
For Fabrico, the plan is agreed per plant. Installing the devices and connecting the machines takes about one month. Full rollout across the lines you choose takes 3 to 4 months.
Conclusion: choose by how the stop and its reason get captured
The tools here differ in how the reason gets added, how short stops are counted and what happens after the stop. Read each vendor's own pages, then test the questions above on a pilot line.
If you want downtime by cause, OEE and the repair follow-up in one system, Fabrico, our OEE and light MES platform, brings them together with maintenance built in.
Book a demo to see how stops are ranked by cause on lines like yours, or contact us.
Frequently asked questions
What should downtime tracking software capture?
When the line stopped, for how long, and why, with the reason attached at the time rather than reconstructed later. Duration without a reason tells you that you have a problem but not which one.
Should operators enter downtime reasons manually?
Ideally the stop is detected automatically and the operator only confirms or picks a reason. Manual start and stop entry is where data quality dies, because it competes with the actual job of restarting the line.
How many reason codes should you have?
Few enough to pick from a single screen without scrolling, typically well under twenty at the top level. Long lists get resolved to whatever is nearest the thumb, which quietly corrupts the analysis.
What threshold counts as downtime?
Whatever you choose, applied consistently. The common mistake is setting it high enough to exclude short stops, which hides the losses that often matter most.
See micro stops.
How do you know the data is trustworthy?
Compare total recorded downtime against the gap between planned and actual output for the same period. If they do not roughly reconcile, something is not being captured, and that gap is usually where the real loss is hiding.
What is the difference between downtime tracking software, a CMMS and an MES?
Downtime tracking software records when machines stop and why. A CMMS plans and records maintenance work. An MES runs and records production on the shop floor, and a light MES covers machine data collection, production monitoring, OEE and downtime analytics. Fabrico is an OEE and light MES platform with maintenance built in, so the stop and the repair sit on the same data. More in OEE vs MES.
Does downtime tracking work on older machines?
Yes, as long as the machine gives a signal or you add one. In Fabrico, machine data comes from the PLC, from a Fabrico IoT device with external sensors on older machines, or from AI cameras (an add-on) where there is no machine signal.
Can one system track downtime across several plants?
Yes, if every plant uses the same stop definitions. In Fabrico, a group account lets head office see all plants, cross-plant reports compare machines and lines, and each site keeps its own control.
How much does downtime tracking software cost?
It depends on how many machines you connect, how they connect and how many sites you run. Ask each vendor for a quote that covers the hardware, the software and the rollout work, so the offers compare like for like.
Turn downtime into a number your team can actually act on.
Book a demoContact usRelated articles




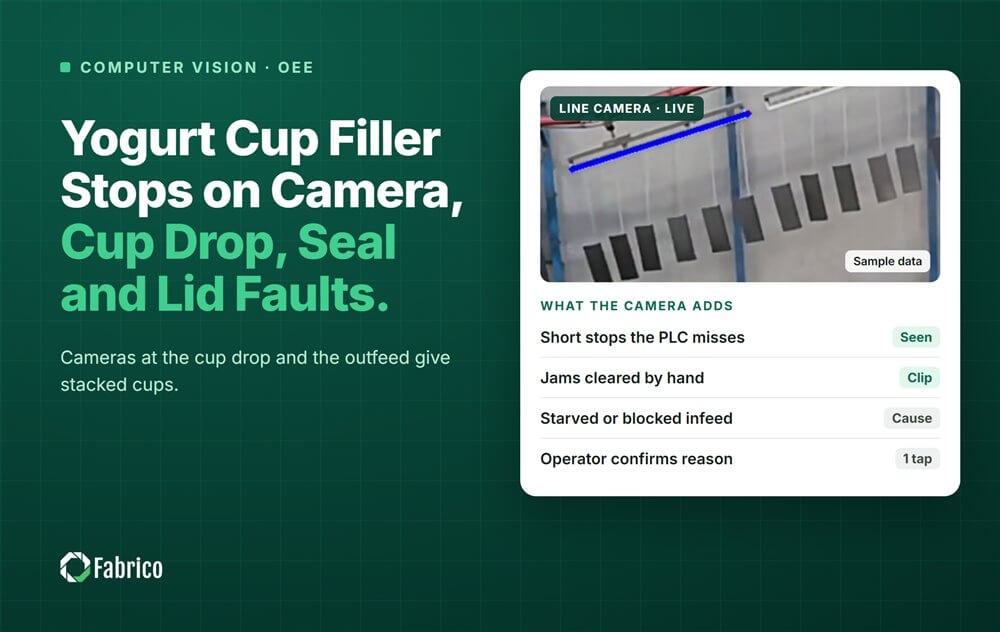
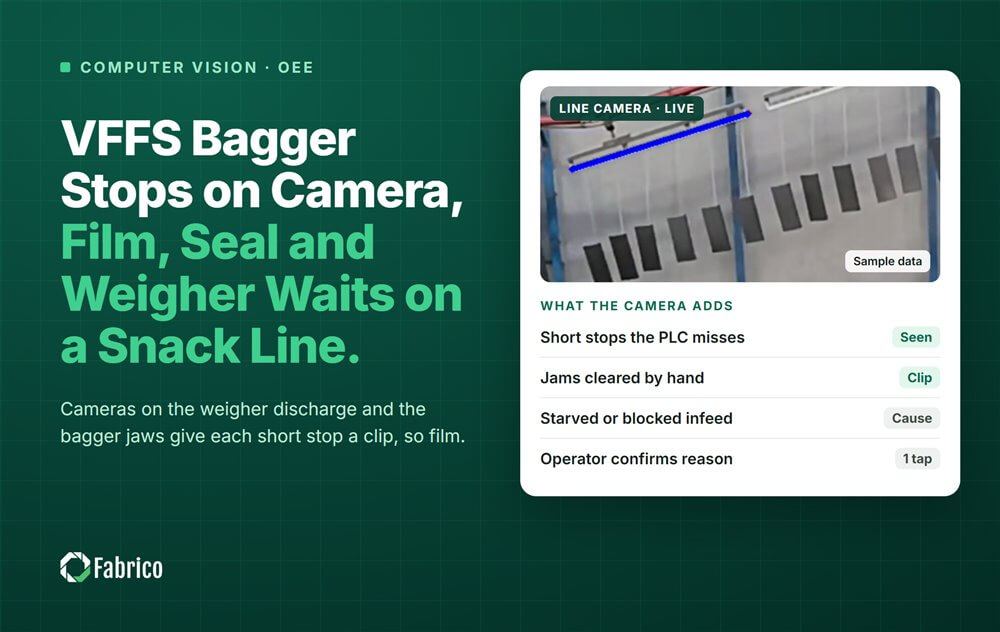
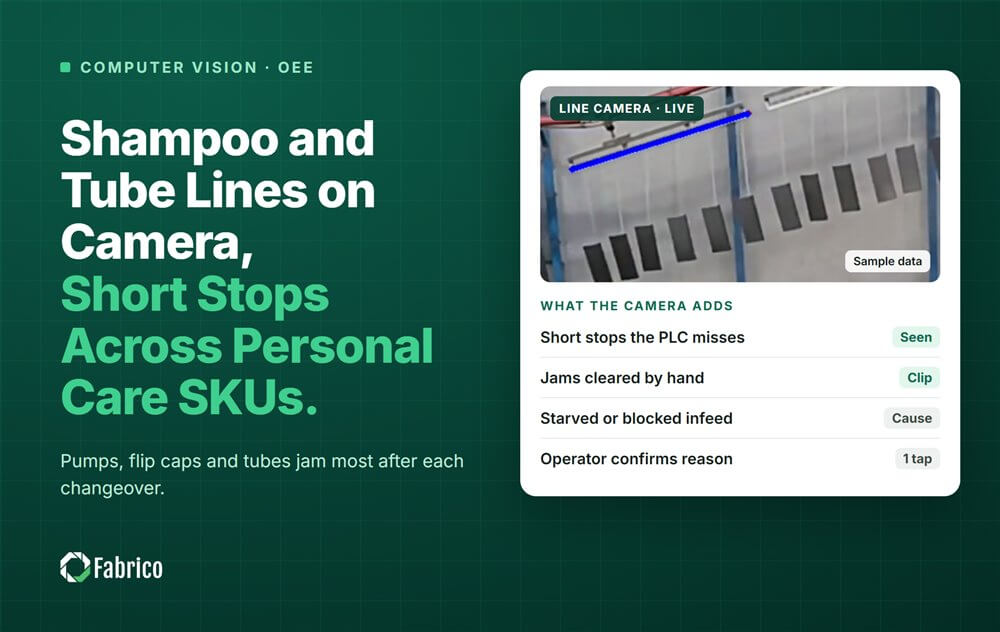
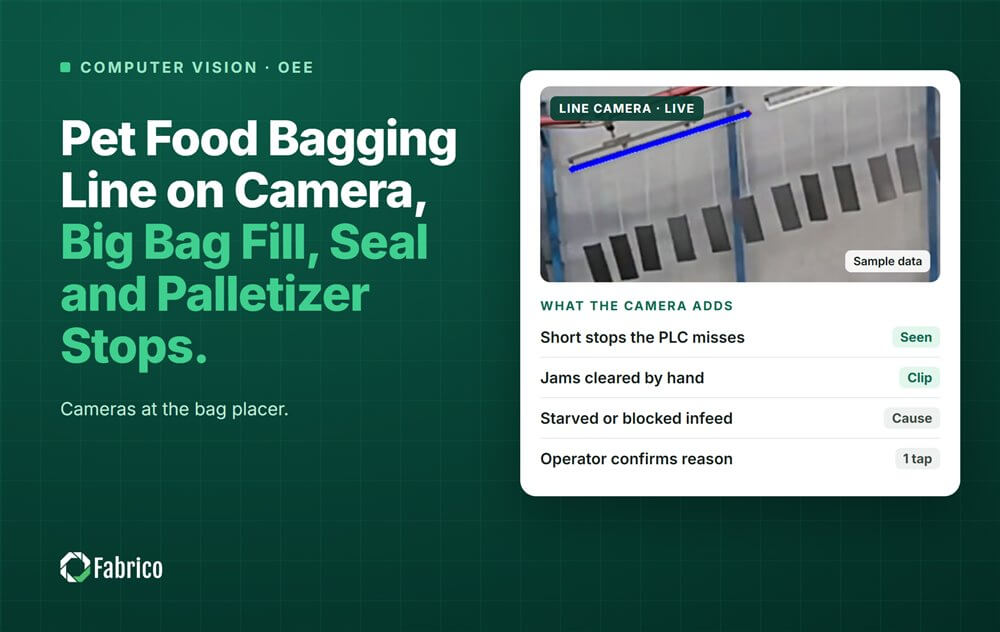


Real Fabrico tiles, sample data.