


 Login
 Blog
Equipment Downtime Tracking Software: How to Track and Diagnose Machine Stops

Key Takeaways
-
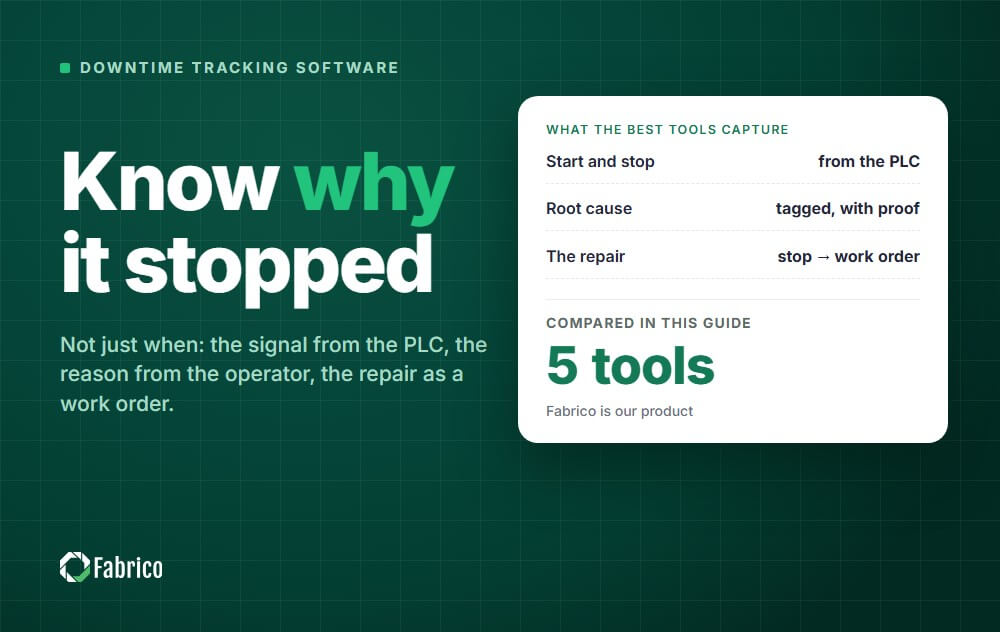
Equipment downtime tracking software records stops on each machine: when each one started, how long it lasted and why. That record is how you diagnose a production line: which machine started the stop, which cause costs the most time and whether a fix held. If you are comparing tools, our 5-tool downtime tracking software comparison is the place to start.
-
A tracker that only logs stop times leaves the cause and the repair to phone calls and radios. Where an AI camera (an add-on) is set up, you can open its video for any moment on the timeline; see computer vision for OEE (an add-on).
-
The answer is an OEE and light MES platform with maintenance (CMMS) built in: stops and causes come from the line, and the repair follows from the stop in the same system.
The Problem with a Simple "Downtime Tracker"
Mike, a Plant Manager, invested in a simple downtime tracking tool. He now has a more accurate log of his major stops, but he's more frustrated than ever.
The data is always a day late, telling him about problems he can no longer fix. He's completely blind to the "hidden factory" of slow cycles and micro-stops that are killing his efficiency.
And worst of all, when a machine does go down, the alert is a dead end. His team is still stuck in a chaotic scramble of phone calls and radios to get the right technician to the right machine.
He's tracking the problem better, but he's not solving it any faster.
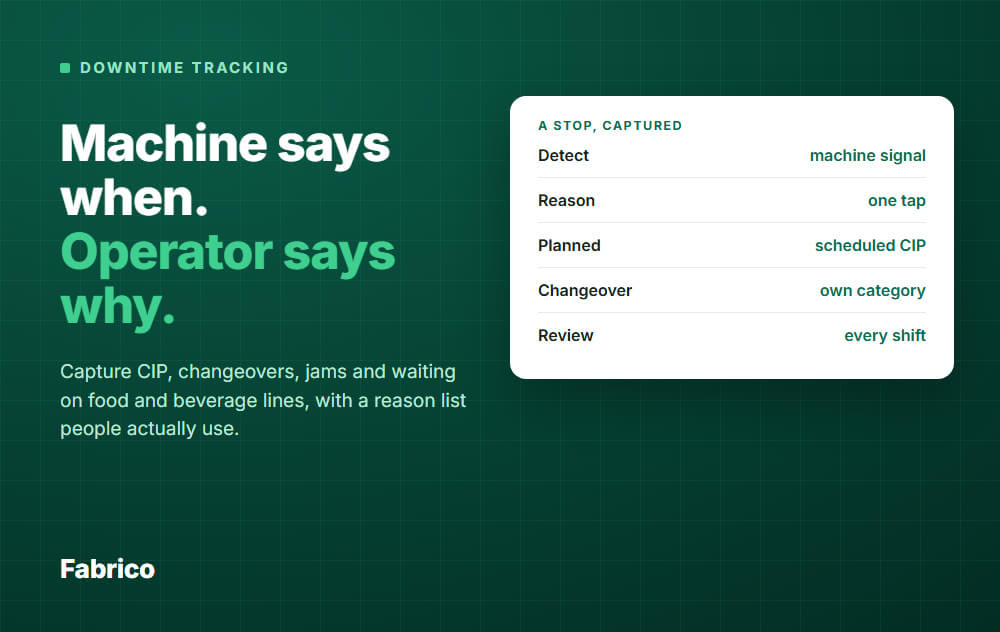
Solving it faster starts with better data. Fabrico's downtime tracking software logs stops straight from connected machines, short stops included, and operators tag the cause on a tablet or phone, so the reason does not arrive a day late.
How to diagnose production line downtime, machine by machine
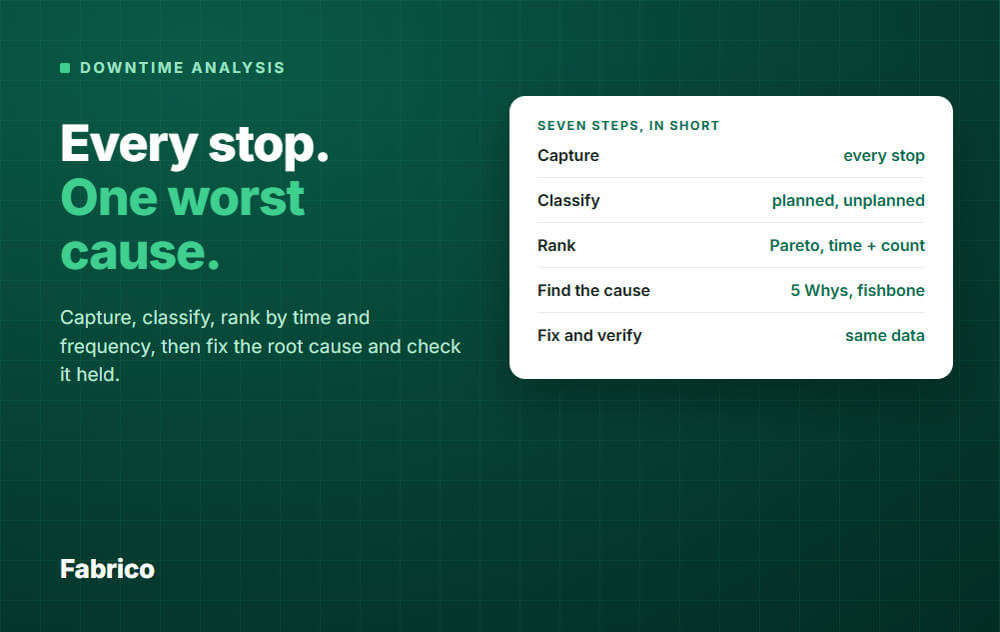
Line downtime is the symptom. The diagnosis is finding which machine started it and why. Five steps that work with any tracking tool:
- Record the stop where it starts. Track each machine on the line, not just the line output, so each stop has a machine attached.
- Separate the cause from the knock-on. A machine that stands still because the one before it starved it, or the one after it blocked it, is waiting, not broken. Tag those stops as starved or blocked, so the time lands on the machine that started it.
- Split long stops into their parts. Waiting for a technician, the repair itself, waiting for parts and the restart need different fixes, and MTTR improves when you know which part is long.
- Rank causes by time and by count. Long breakdowns lead the time ranking, short stops lead the count. Both lists matter, and short stops show up in OEE as lost speed.
- Check that the fix held. Watch the same machine and cause for a few weeks after a fix. If the cause comes back, the fix treated a symptom.
Reason codes that keep the data usable
Keep the top level short enough to fit one screen, typically well under twenty reasons, with a second level for detail. Mark each reason as planned or unplanned. Keep an unknown reason and review it every week: a growing unknown bucket means the list no longer matches the line.
Planning and tracking planned downtime
Planned downtime, such as preventive maintenance, changeovers and cleaning, belongs in the same record as breakdowns, marked as planned, so you can see whether the plan held and how much time it took. In Fabrico, maintenance is built in, with an annual preventive maintenance plan and a drag-and-drop calendar on the same machine data as the stops.
The 3 Pillars of a True Downtime Solution
A complete solution doesn't just track downtime; it gives you the tools to eliminate it. It must be built on three integrated pillars.
Pillar 1: An Automated OEE Diagnosis (To Find the Lost Minutes)
Good downtime tracking is not just about logging major stops; it is about finding the short stops and slow cycles too. A true solution must start with a powerful OEE (Overall Equipment Effectiveness) module.
This allows you to automatically track:
-
Real-Time Downtime: Instantly see when a machine stops, with live alerts that are accurate to the second.
-
Performance Loss: Uncover the "hidden factory" of lost capacity from slow cycles and thousands of unlogged micro-stops.
-
Stop Reason Logging: Use simple, operator-friendly tablets to tag the cause of a stop in a few taps, providing clean, consistent data for analysis.
Pillar 2: Maintenance Built In (To Shorten the Response)
Maintenance is built in, so the stop leads to the repair in the same system.
A complete solution must have an integrated CMMS (Computerized Maintenance Management System) to turn the diagnosis into action.
This is the Fabrico workflow. The live OEE view shows an unplanned stop (the diagnosis). A work order is opened from the stop in one step, linked to the line (the cure).
Push, in-app and email notifications with smart rules tell the technician about the job.
Pillar 3: A Data-Driven Improvement Engine (To Prevent Future Downtime)
The ultimate goal is not just to fix downtime faster, but to prevent it from happening in the first place.
A true solution uses the rich historical data from both your OEE diagnostics and your CMMS responses to provide a powerful improvement engine. This allows you to:
-
Instantly Analyze Your "Bad Actors": Use powerful Pareto analysis to see your top 5 worst-performing assets and most common failure modes.
-
Build a Data-Driven PM Program: Use this failure data to optimize your preventive maintenance schedule, fixing problems before they ever stop your line.
-
Prove Your ROI: Track crucial "Response KPIs" like Mean Time to Repair (MTTR) and Mean Time Between Failures (MTBF) to prove the financial impact of your efforts to leadership.
A Quick Comparison: Tracker vs. Integrated Solution
The difference is not just in features; it's a completely different philosophy.
| Feature | Simple downtime tracker | OEE and light MES platform (Fabrico) |
|---|---|---|
| Data source | Manual entry or a simple sensor | The machine signal from the PLC or an IoT device, plus the operator's reason; AI cameras (an add-on) count output where there is no signal |
| Short stops and slow cycles | Usually missed | Micro-stop detection and speed loss in live OEE |
| Response | Phone calls and radios | A work order opened from the stop in one step, linked to the line |
| Improvement | A log of stop times | Downtime by cause, MTTR and MTBF per machine, cost per loss |
| Primary goal | Log stop times | Find and remove the biggest losses |
How to Measure Equipment Downtime: The Metrics That Matter
You cannot reduce machine downtime you do not measure. Before choosing equipment downtime tracking software, know the numbers it should calculate for you, because these are what turn a raw log of stops into a plan for eliminating them.
Downtime rate and availability. Availability is the share of planned production time a machine actually runs; the downtime rate is its mirror image, the percentage of that time lost to stops. Availability is one of the three factors in an OEE score, so tracking it is the entry point to measuring machine downtime honestly.
Mean time between failures (MTBF). MTBF is the average running time between one breakdown and the next. A rising MTBF means your assets are getting more reliable; a falling one is an early warning that a machine is drifting toward a bigger failure.
Mean time to repair (MTTR). MTTR is the average time to get a stopped machine running again, from the moment it goes down to the moment it is back in production. It measures how fast your response is, which is exactly what an integrated work-order workflow is built to shorten.
Cost of downtime. Every minute of unplanned machine downtime has a price: lost output, idle labor, scrapped work in progress, and sometimes missed shipments. Multiplying downtime minutes by a per-minute cost turns an operational problem into a financial case leadership can act on.
Downtime by cause (Pareto). The most useful downtime report is not the total; it is the ranked list of causes. A Pareto view of your worst assets and most frequent failure modes shows where a small number of fixes will recover the most lost time. See what to test in real-time downtime Pareto software.
Frequently Asked Questions (FAQ)
What is equipment downtime tracking software?
Software that records stops on each machine, with when each one started, how long it lasted and why, and ranks the causes by lost time. Good tools take the stop from the machine signal and ask the operator for the reason at the line.
How does the software connect to our machines?
Usually through the PLC on newer machines and an added sensor or IoT device on older ones. In Fabrico, machine data comes from the PLC, from a Fabrico IoT device with external sensors on older machines, or from AI cameras (an add-on) that count output where there is no machine signal.
How do you diagnose production line downtime?
Track each machine on the line, separate stops caused by a starved or blocked machine from real faults, split long stops into waiting, repair and restart, then rank causes by time and by count.
What software supports downtime planning and tracking?
Software that records planned stops, such as preventive maintenance and changeovers, next to unplanned ones, and plans the maintenance work in the same place. Fabrico tracks stops from connected machines and has maintenance built in, with an annual preventive maintenance plan, so planned and unplanned downtime sit in one record.
What if we already have a standalone CMMS?
Downtime data can feed it through an integration: Fabrico offers a REST API and webhooks, plus Excel or CSV export. Fabrico also has maintenance built in, on the same machine and production data, so the stop and the repair can sit in one system if you prefer.
How long does it take to get started?
Start with a pilot on one critical bottleneck machine. Installing the devices and connecting the machines takes about one month. Full rollout across the lines you choose takes 3 to 4 months.
What is equipment downtime?
Equipment downtime is any period when a machine or line is not running when it should be. It includes both planned downtime, such as scheduled maintenance and changeovers, and unplanned downtime from breakdowns and faults. Downtime directly lowers OEE and production output. For the full definition, see equipment downtime.
What is the difference between planned and unplanned downtime?
Planned downtime is scheduled and expected, such as maintenance, changeovers, or breaks, so it can be managed. Unplanned downtime is unexpected, caused by breakdowns or faults, and is usually far more costly because it disrupts schedules and is harder to recover from.
How do you reduce equipment downtime?
Reduce downtime by tracking its causes to fix recurring problems, shifting to preventive and condition-based maintenance, keeping critical spare parts on hand, and improving real-time visibility into machine status. Accurate measurement comes first, since you cannot reduce downtime you do not track. More in how to reduce machine downtime.
Stop Just Tracking Downtime. Start Eliminating It.
A better view of downtime is the first step. The gain comes when the biggest cause on the worst machine gets an owner and a fix, and the data shows whether it held.
Comparing tools? See our downtime tracking software comparison. To act on early signs before a long stop, see how to prevent unplanned downtime.
Want to see how stops are tracked machine by machine on lines like yours?
Book a demoContact usRelated articles



Latest from our blog




Real Fabrico tiles, sample data.