


 Login
 Blog
Lean Assessment Checklist: Score Each Area From Line Evidence

In short: A lean assessment checklist holds up when each area is scored from line evidence rather than opinion. That evidence is boards and 5S sheets that are posted and current, the spread of changeover minutes, starved and blocked time, changeover minutes against target, the minor stop and breakdown trend, and the share of downtime with no reason.
- Eight areas, levels 1 to 5, one measured value behind each level.
- A template to copy, with the evidence each score needs.
- A table of what each score tells you to do next.
- A worked example: one juice line scored, OEE recomputed, two areas picked.
A lean assessment that rates each area from 1 to 5 is only as good as what sits behind a 3. At enterprise level, tools such as the LESAT 2.0 tool from MIT's Lean Advancement Initiative give the assessment a structured reference. This page takes the idea onto the shop floor of a food or FMCG plant and ties each level to a number from the line. It scores lean practice on one line; digital maturity is the manufacturing digital maturity model.
Why a lean audit scored by opinion drifts
Three things move an opinion score while the line stays the same: a new assessor with a different idea of a 4, a visit on a good day, and a team that learns what the assessor looks for. A measured score avoids all three. If the changeover spread fell from 40% to 22%, standard work moved from 2 to 3 for a reason anyone can check. Most measures below are losses in minutes, the view of waste that OEE in lean manufacturing takes.
Statistics offices also score management practice on a fixed scale. The US Census Bureau's 2021 Management and Organizational Practices Survey scores each manufacturing establishment on 16 questions, each from 0 for least structured to 1 for most, and found that more than 80% of establishments tracked three or more key performance indicators. The evidence mostly exists; the gap is tying the score to it. In Great Britain, the ONS pilot survey of 1,026 manufacturers (2015, experimental statistics) found that a 0.10 increase in management practice score is associated with a 6.7% rise in productivity, with continuous improvement among the practices most linked to it. That is an association, not proof of cause, but it is a reason to score carefully.
Eight lean areas, each tied to a line measure
Use measures the line already produces. For trend areas, compare the last 13 weeks with the 13 before.
- 5S: what is posted and current: zones with an audit sheet dated in the last seven days. The US EPA notes that 5S is typically the first lean method which organizations implement, which is why it opens the list.
- Visual management: line boards updated this shift with output, top loss and open actions. A board last touched on Monday counts as none; see visual management in manufacturing.
- Standard work: whether changeover minutes vary. For one changeover type, divide the standard deviation of measured minutes by the mean. A wide spread means crews work differently; standard work and OEE shows the shift gap.
- Flow: starved minutes (waiting on upstream) plus blocked minutes (downstream full) at the constraint, as a share of planned time.
- Quick changeover: median measured minutes, last good unit to first good unit at rate, against the plant's own target. SMED results in OEE shows where they land.
- TPM and autonomous maintenance: breakdown minutes and minor stops per running hour, quarter on quarter. The EPA's TPM page calls minor stoppages downtime from zero to 10 minutes in length and that are difficult to record manually, so take them from the machine signal. They count under performance (reduced speed loss vs minor stops); OEE vs TPM covers how the two fit.
- Quality at the source: rejects counted at the line with a cause, and the quality rate trend, start-up rejects kept apart.
- Problem solving: downtime minutes with no reason, plus actions closed by their due date. High unclassified downtime means the line cannot say what it is solving.
The lean assessment template: levels 1 to 5
Copy it into a sheet with columns for the measured value and the date. The thresholds are starting points for a filling or packing line: set your own once, then keep them fixed so quarters compare.
| Area | Evidence to pull | Score 1 to 5 |
|---|---|---|
| 1. 5S | Zones with an audit sheet dated in 7 days | 1: none 2: under 50% 3: 50 to 79.9% 4: 80 to 94.9% 5: 95%+, red tags cleared |
| 2. Visual management | Line boards updated this shift | 1: no boards 2: under 50% 3: 50 to 79.9% 4: 80 to 94.9% 5: all, top loss owned |
| 3. Standard work | Spread of one changeover type (SD over mean) | 1: over 50% 2: 35 to 50% 3: 20 to 34.9% 4: 10 to 19.9% 5: under 10% |
| 4. Flow | Starved plus blocked at the constraint, share of planned time | 1: over 15% 2: 10 to 15% 3: 5 to 9.9% 4: 2 to 4.9% 5: under 2% |
| 5. Quick changeover | Median changeover against target | 1: over 2 times 2: 1.5 to 2 times 3: 1.2 to 1.49 4: under 1.2 5: at or under target 3 months |
| 6. TPM and autonomous maintenance | Breakdown minutes and minor stops per running hour, quarter on quarter | 1: both up over 10% 2: one up over 10%, other not down over 10% 3: both within 10%, or one up and one down over 10% 4: one down over 10%, other within 10% 5: both down over 10% |
| 7. Quality at the source | Rejects at the line with a cause; quality rate trend | 1: not counted 2: no cause 3: cause, rate flat 4: rate up, top cause owned 5: up two quarters |
| 8. Problem solving | Downtime with no reason; actions closed on time | 1: over 30% 2: 15 to 30% 3: 5 to 14.9% 4: 2 to 4.9% and half on time 5: under 2% and 80% on time |
Where an area has two conditions, a line that misses one scores the level below.
Two rules: score from the value, never for effort, and missing evidence scores 1, however good the area looks on the day.
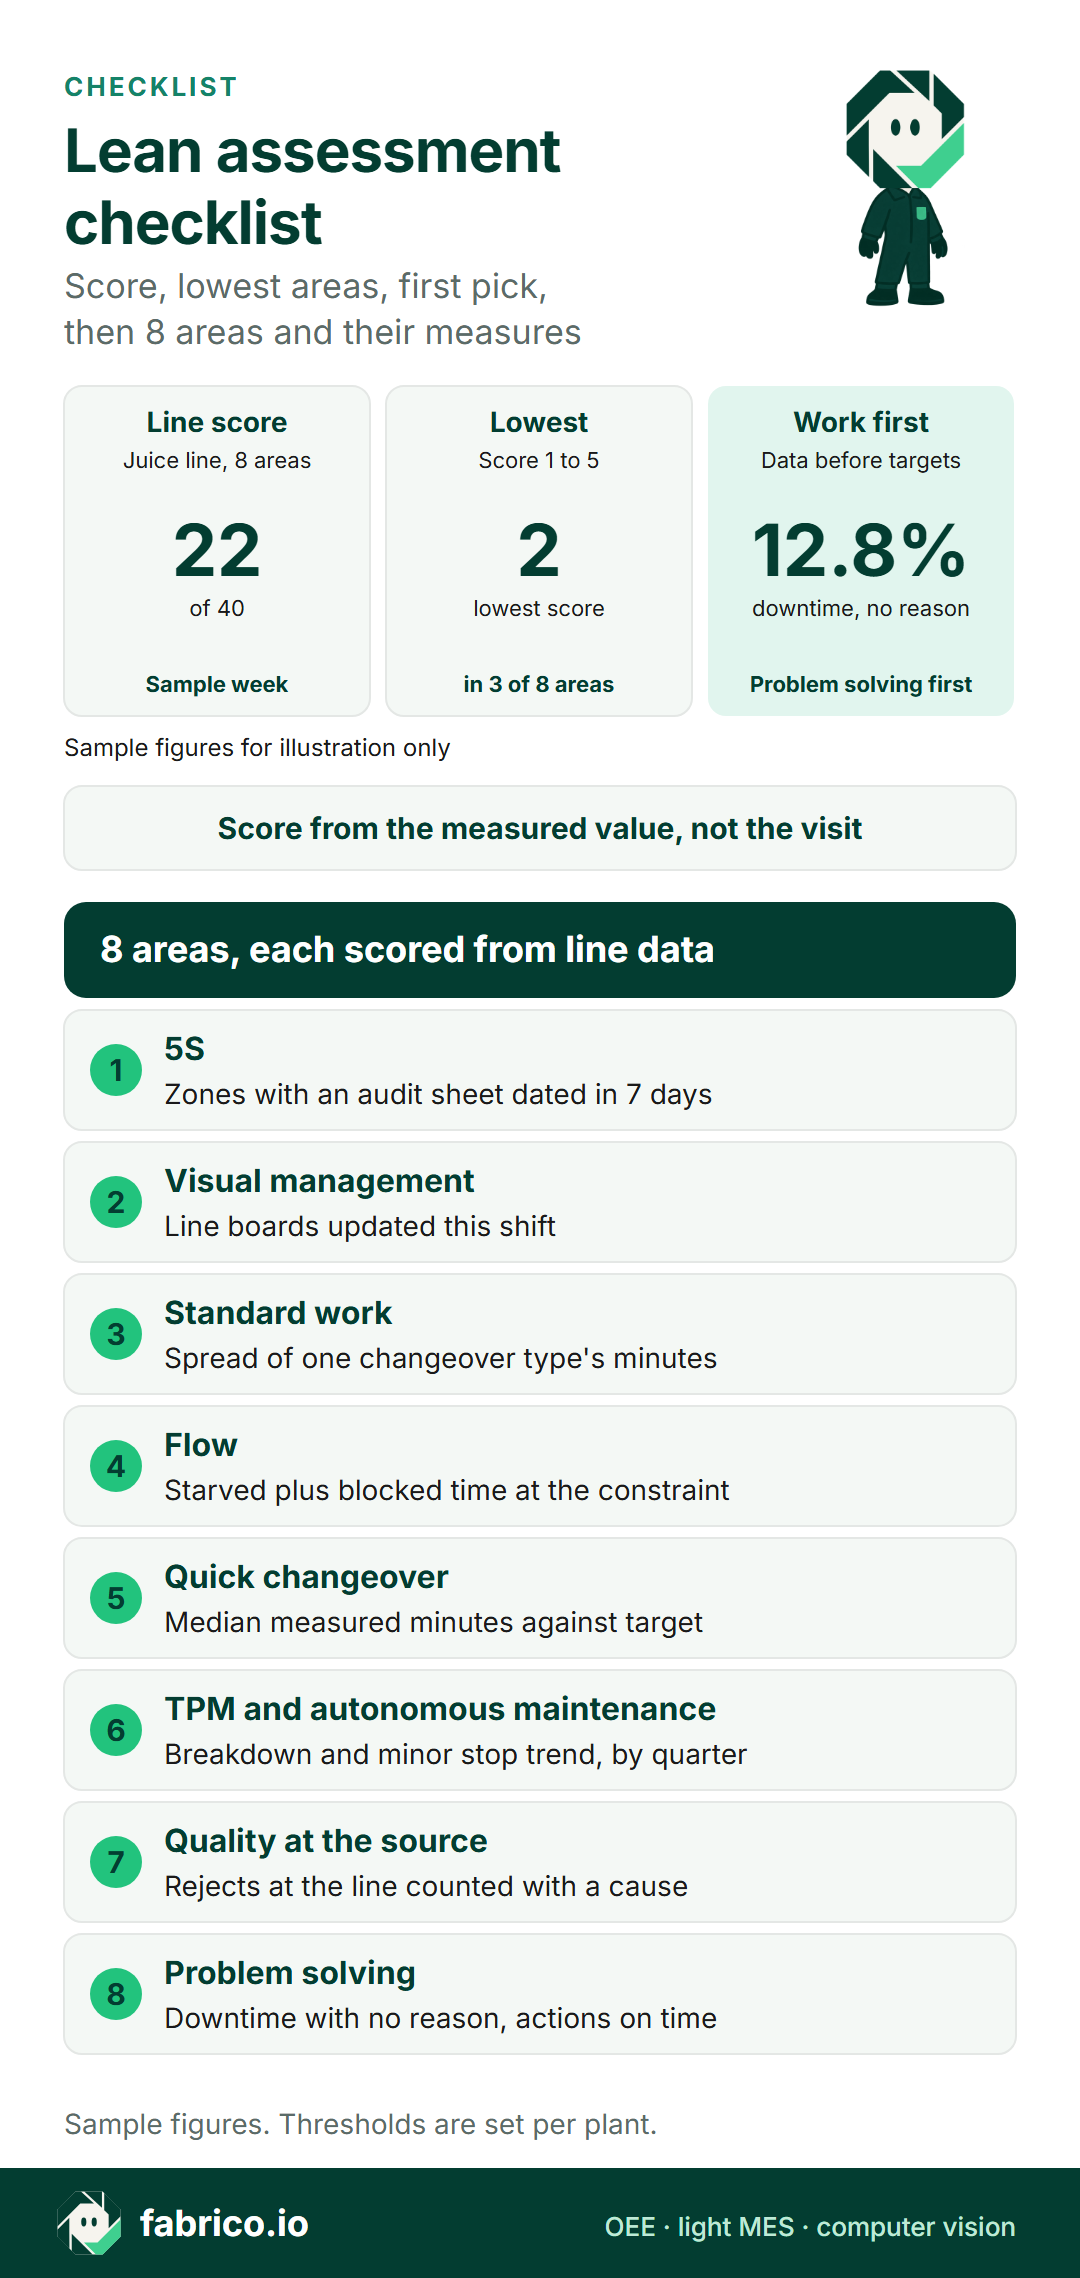
Text version of this infographic
- Title: lean assessment checklist, scored from line evidence.
- Sample figures for illustration only.
- Line score: 22 of 40 for one juice line, sample week.
- Lowest: score 2, in 3 of 8 areas.
- Work first: 12.8% of downtime has no reason, so problem solving comes first.
- Score from the measured value, not the visit.
- Eight areas: 5S, current audit sheets; visual management, boards updated this shift; standard work, changeover spread; flow, starved and blocked time; quick changeover, minutes against target; TPM and autonomous maintenance, breakdown and minor stop trend; quality at the source, rejects with a cause; problem solving, downtime with no reason.
Worked example: scoring a juice bottling line
Sample figures for illustration only. A juice bottling line runs three shifts, five days: 7,200 planned minutes a week. The filler is the constraint at 200 bottles a minute. This week is typical of the last 13.
Stops (1,880 minutes): 12 flavour changes took 600 minutes, median 48 against a target of 30. Breakdowns took 310. The filler was starved of bottles for 260 minutes and blocked by a full labeller for 330. 240 minutes carry no reason; 140 have other reasons. This plant counts stops of 5 minutes or more as availability and shorter ones as minor stops under performance.
The OEE (method in the OEE calculation guide):
- Availability: 7,200 minus 1,880 leaves 5,320 minutes of run time: 73.9%.
- Performance: 872,480 bottles against 5,320 x 200 = 1,064,000 possible: 82.0%. Of the 957.6 lost minutes, 610 are 550 minor stops, 6.2 per running hour, and 347.6 are slow running.
- Quality: 17,450 rejects leave 855,030 good bottles: 98.0%.
- OEE: 73.9% x 82.0% x 98.0% = 59.4%. Check: 855,030 / (7,200 x 200) = 59.4%.
The scores:
| Area | Evidence | Score |
|---|---|---|
| 5S | 5 of 8 zones audited in 7 days: 62.5% | 3 |
| Visual management | 2 of 6 boards updated this shift: 33% | 2 |
| Standard work | Flavour change spread: 40% | 2 |
| Flow | 590 starved and blocked min: 8.2% of planned | 3 |
| Quick changeover | Median 48 min against 30: 1.6 times | 2 |
| TPM and AM | Breakdowns down 11.9%, minor stops up 1.6% | 4 |
| Quality at the source | Rejects with cause, rate flat at 98.0% | 3 |
| Problem solving | 12.8% of downtime with no reason, 45% of actions on time | 3 |
Spread: the 12 flavour changes ran from 26 to 90 minutes, 40%. Starved and blocked: 590 / 7,200 = 8.2%. No reason: 240 / 1,880 = 12.8%. Total: 22 of 40.
What the changeover spread costs. The best crew's median is 32 minutes. At that, the 12 changes take 384 minutes, 216 fewer. With performance and quality held, OEE becomes 76.9% x 82.0% x 98.0% = 61.8%. The 30-minute target comes after, once crews share one method.
In money. The 216 minutes return 216 x 200 x 0.82 x 0.98 = 34,716 good bottles a week. At a sample contribution of EUR 0.05 a bottle, that is EUR 1,736 a week, about EUR 79,800 over a 46-week year, from crews copying a method the plant already has.
How fragile the scores are. They are only as good as the reason data. If the 240 unexplained minutes turn out to be starved and blocked time, flow becomes 830 / 7,200 = 11.5% and its score falls from 3 to 2. If they are breakdowns, breakdown minutes rise from 310 to 550 against last quarter's weekly 352 (310 was 11.9% down), up 56%, and TPM falls from 4 to 2. Either way, the first pick below holds: closing the reason gap decides which of those stories is true.
Want changeover and stop minutes by cause and shift from a connected line? Book a demo to see them recorded.
Which two areas to work on first
Check the record, shortlist the lowest scores, then weigh them by the minutes they hold at the constraint.
Problem solving first. With 12.8% of downtime unexplained, the flow and TPM scores rest on a gap: some of those 240 minutes may be starved time or breakdowns. Shorten the reason list, ask for a reason before restart and review the gaps at shift start. This changes no OEE figure; it changes what the team works on.
Standard work second. The 40% spread and the 1.6 times target sit on the same 600 minutes. Write down the best crew's method, train every crew and re-measure. Chase the target once the spread is under 20%. Removing the step that varies shrinks the spread as well as the mean: in a 2026 University of Porto dissertation on beverage packaging changeovers at one plant, a redesigned tool-less bracket cut its adjustment task time by 78.5% and its variance by 99.3%.
Visual management also scores 2 but holds no minutes of its own; updating boards each shift is cheap, so it runs alongside. Flow comes third, once the true starved and blocked figure is known.
What the score tells you to do next
| Score | What the evidence shows | Do next |
|---|---|---|
| 1 | The measure is not recorded yet | Start recording it for four weeks; hold improvement events on this area until then |
| 2 | Recorded, but wide spread or far from target | Fix the method or the record before chasing the target |
| 3 | Stable, not improving | Name its largest loss in minutes and give it an owner and a date |
| 4 | Improving on the record | Check it holds on all shifts, then leave the routine alone |
| 5 | At target and holding | Reassess next quarter and move effort to the lowest area |
Read the total last. A line at 22 of 40 whose minutes all carry a reason stands better than one at 28 whose minutes are a third unexplained. Compare totals only between lines with the same thresholds and counting point.
Your first measured lean assessment: this week and this quarter
This week, on one line:
- Name the constraint machine, the counting point and the stop cut-off (5 minutes in the sample). Keep all three fixed from now on.
- Pull 13 weeks of stop logs and counts. Mark which of the eight areas have a measured value; the rest score 1 until they do.
- Check the two current-state areas in one shift: 5S sheets dated within 7 days and boards updated this shift. Photograph both.
- Add "starved" and "blocked" to the constraint's stop reasons if they are missing, or the flow score has nothing to read.
This quarter:
- Score all eight areas from the template and pick two by the minutes they hold at the constraint.
- Time every changeover of one type for four weeks and compute the spread before anyone writes a standard.
- Re-score at week 13 with the same thresholds, window and counting point. Change a threshold only once a year, and re-score the old quarter with it.
Where the line record fills the template
Fabrico is OEE and light MES software. Its line record supplies the measured values for standard work, flow, quick changeover, TPM and problem solving, and its dashboards give each shift a current board.
- Changeover, flow and breakdown minutes: the operator picks why the line stopped on a tablet or phone, and downtime splits by cause, machine and shift. With starved and blocked on the reason list, the flow score reads straight off it.
- Minor stops for TPM: availability, performance and quality per line and shift from the PLC or an IoT device with sensors; micro-stops too short to write down are picked up from the machine signal.
- A board that is current: dashboards set up for the plant's lines, shifts and KPIs, with OEE updating while the line runs.
- The quarter's values: lists go out to Excel or CSV, or through the REST API and webhooks, straight into the template.
- Hand-packing steps: with no machine signal, the camera add-on counts output into the same OEE as the PLC data. Its video for a stop is streamed on request and not stored in Fabrico. On the roadmap: the camera add-on suggesting a stop reason for the operator to confirm.
Comparing systems? For software to run the audits themselves, see lean manufacturing software compared. For the line data, start with how to evaluate OEE software, the OEE and MES overview, what a light MES covers and the computer vision add-on. Plant-type guides: MES for food manufacturing, mid-size FMCG plants and computer vision in food plants.
Lean assessment questions from CI teams
What is a lean assessment checklist?
A list of lean areas, such as 5S, standard work, flow, quick changeover, TPM and problem solving, each scored on a fixed scale. Here each level from 1 to 5 is tied to a measured value, so two assessors reach the same score.
How is a lean assessment different from a gemba walk?
A gemba walk is a regular visit to see the work and ask questions; see the gemba walk checklist and gemba walk vs audit. A lean assessment scores the line against a fixed template at set intervals, so scores compare over time and between lines.
Can a lean assessment template live in a spreadsheet?
Yes: eight rows, a measured value, a score and a date.
How often should a line be reassessed?
Quarterly suits most areas, with 13 weeks of stop and count data behind the trends. Boards and 5S sheets can be checked on any day, since they score what is current.
Who should run the assessment?
A CI lead with the line's shift leads, working from the same data pull. The CI lead owns the template and scores the areas read from the line record; the shift leads check boards and 5S sheets on the floor and confirm the reasons logged against the stop minutes.
What if part of the line has no machine signal?
Score that area from shift sheets and mark it hand-recorded, so nobody compares it one to one with a measured line. Once the camera add-on or an IoT device with sensors counts output at that step, the trend scores become comparable.
Want the measured values for this template recorded shift by shift? Book a demo to see a connected line's quarter of stops and changeovers.
Related articles


Latest from our blog




Real Fabrico tiles, sample data.