


 Login
 Blog
MES vs APS: What the Schedule Assumes and What the Line Does

In short: an APS decides the order and timing of production on rates, changeover times and constraints; an MES records what the line really did. Unless measured run rates, changeover minutes and start-up losses reach the APS, every sequence it builds rests on routing figures.
- The APS owns the sequence: which order runs next, where, and when it should finish.
- The MES owns the record: runs, stops, changeovers, good output and rejects.
- A schedule drifts on nameplate rates and one changeover figure per line.
- Schedules miss on the line: measure first. Inputs trusted, sequencing is the pain: add the APS.
A snack plant can buy a scheduling engine that builds a clean sequence in seconds and still be behind it by lunchtime. The engine sequences on the numbers it was given. When those come from the routing or the machine plate, the sequence holds and the timing slips.
The choice in front of planners and plant managers at food and FMCG sites is which of the two to fix first. Fabrico, which publishes it, makes OEE and light MES software; read its section with that in mind.
MES vs APS: sequence on one side, minutes on the other
An APS (our guide to advanced planning and scheduling covers the basics) takes open orders and works out a finite sequence: which order runs on which line, when, within limits such as capacity, crew, materials and changeover cost. To do that it holds a model of each line: how fast it runs each SKU and how long each product change takes.
An MES works at the line. It records when the line ran, when and why it stopped, and how many good and rejected units it made. A light MES or OEE layer covers that record; a full MES also dispatches orders and enforces routings.
| Question | APS | MES or OEE layer |
|---|---|---|
| Main job | Sequences and times orders | Records what the line did |
| Looks | Forward: today to weeks | Back: minutes to shifts |
| Works on | Rates, changeover times, calendars, constraints | Runs, stops, counts, rejects |
| Used by | Planners, schedulers | Operators, shift leads, CI |
| Needs from the other | Measured rates and minutes | The order, SKU and planned start |
See also what an APS does, MRP vs APS and MES vs MRP.
The ISA-95 boundary between the APS and the line
ISA-95 gives the vocabulary for this boundary. ISA describes the ISA-95 levels this way: Level 3 covers manufacturing execution systems and other systems that manage manufacturing operations, and Level 4 covers all the activities related to running a business. On the same page, ISA calls the interface between levels 3 and 4 the main subject of the standard, and that is where an APS hands its sequence to the line. The international version, IEC 62264-3 (2016), models the operations activities that sit between business planning and logistics at Level 4 and process control at Level 2.
Where your APS sits is a choice to settle with IT. Either way, what it knows about the line comes from the operations level, where the minutes are recorded. Two flows cross that boundary:
- Down to the line: the sequence, order, SKU, quantity, planned start and finish.
- Back to the schedule: measured rate per SKU, changeover minutes per product pair, stop time, start-up rejects, and when each order really closed.
Check the second flow first: it is the one nobody owns by default.
Where the APS gets wrong inputs
Four inputs to check first on a food or FMCG line.
- Nameplate rates. A rate from the plate or the first trial run is a ceiling, not a plan. See scheduling at demonstrated rates.
- Changeover minutes from the routing. One figure per line, sometimes written when the line was new, while real changeovers depend on what changes: flavour, film, pack size, allergen. The changeover time guide covers cutting them; the APS first needs to know them.
- No minor stops. Check whether short jams at the packer appear anywhere in the line model. They sit inside performance; see reduced speed loss vs minor stops.
- No start-up losses. After a changeover the line runs slow and makes rejects until it settles. See startup loss vs reduced yield loss.
A 2025 open-access paper in Operations Research and Decisions makes the point from the planning side. Studying one chips plant in Poland, the authors found its single line needed a changeover almost every time it switched orders, and that changeover times were driven by changes in a small number of order features, far fewer than the number of orders. It is one plant and a model study, not a sector figure, but it shows the shape a changeover table should take: minutes per change of feature (flavour, film, pack size), measured, from which a product-pair table can be built, not one routing figure.
Worked example: one day on a snack bagging line
Sample figures for illustration only. A bagging line runs four flavours in 900 planned minutes. The bagger is the constraint, rated at 100 bags a minute. Each order is 21,000 good bags.
The APS schedule uses the routing: 100 bags a minute, 20 minutes per changeover. Four orders of 210 minutes plus three changeovers: 4 x 210 + 3 x 20 = 900. The day fits exactly.
What the MES records over the same 900 minutes:
- Availability: the three changeovers take 38 minutes each, 114 in all, and other stops take 36 minutes. Stop time is 150 minutes, so run time is 750. 750 / 900 = 83.3%.
- Performance: in 750 run minutes the line makes 66,000 bags, against 75,000 at the rated speed. 66,000 / 75,000 = 88.0%, lost to short stops and slow restarts.
- Quality: 1,320 bags are rejected, mostly just after changeovers, so 64,680 are good. 64,680 / 66,000 = 98.0%.
- OEE: 0.833 x 0.880 x 0.980 = 0.719, or 71.9%. Check: 64,680 / (900 x 100) = 71.9%.
How the schedule drifts. The line made 64,680 good bags in the 786 minutes outside changeovers, so one order really takes 21,000 / 64,680 x 786 = 255 minutes, not 210. Order 1 ends at minute 255, order 2 at 548 instead of 440, order 3 at 842 instead of 670. Order 4 starts at 880 instead of 690 and makes about 1,680 good bags. The day closes 84,000 minus 64,680 = 19,320 bags short.
Where the minutes went. At the rated speed, 64,680 good bags need 647 minutes, so the line lost 900 minus 647 = 253. The schedule allowed 60. Split: changeovers 114, other stops 36, slow running and short stops 750 minus 660 (66,000 bags at the rated speed) = 90, rejects 1,320 / 100 = 13. Changeovers ran 54 minutes over plan; the other 139 lost minutes were never in the model.
What has to flow back to the APS
- A changeover table by product pair: here 38 minutes measured on the day, not 20; in practice, the median of several weeks per pair.
- A demonstrated rate per SKU and line: here about 86 good bags per running minute (64,680 / 750), or the A, P and Q split if your APS can hold it.
- A start-up allowance: slow minutes and rejects after a changeover, planned as their own time.
- Order close actuals: when each order ended and how many good units it made, so the next APS run starts from where the line is.
With measured inputs, the honest plan for this day is three orders, or a sequence that groups similar flavours; see sequencing by changeover cost. Value lost minutes at the bagger, the constraint. The arithmetic follows our OEE calculation guide.
Sequence first or inputs first: how to choose
Pick an APS first if rates and changeover times are already measured and trusted, and the pain is the sequence itself: planners spend hours each morning re-ordering jobs, allergen and flavour rules are hard to hold in their heads, and due dates slip because of the order of work.
Pick the line record first if schedules look right on paper and miss on the line, nobody can say what a changeover takes, and order totals are typed in after the shift. A sequencing engine fed those numbers is precise and wrong in the same direction every day. See scheduling software vs OEE software.
Do both if the site carries many SKUs with changeovers every shift. The APS keeps the sequence, the MES keeps the minutes, and both use one set of IDs with a fixed date for each update. If a full APS is more than you need, finite-capacity scheduling without an APS may do.
| What you see | Start with | Why |
|---|---|---|
| Schedules fine on paper, behind by midday | MES or OEE layer | The inputs are guesses |
| One changeover figure per line, never updated | MES or OEE layer | Measure per product pair |
| Planners re-sequence by hand every morning | APS | Sequencing is the gap |
| Many SKUs, allergen changes, nameplate rates | Both, in steps | Measure, then sequence |
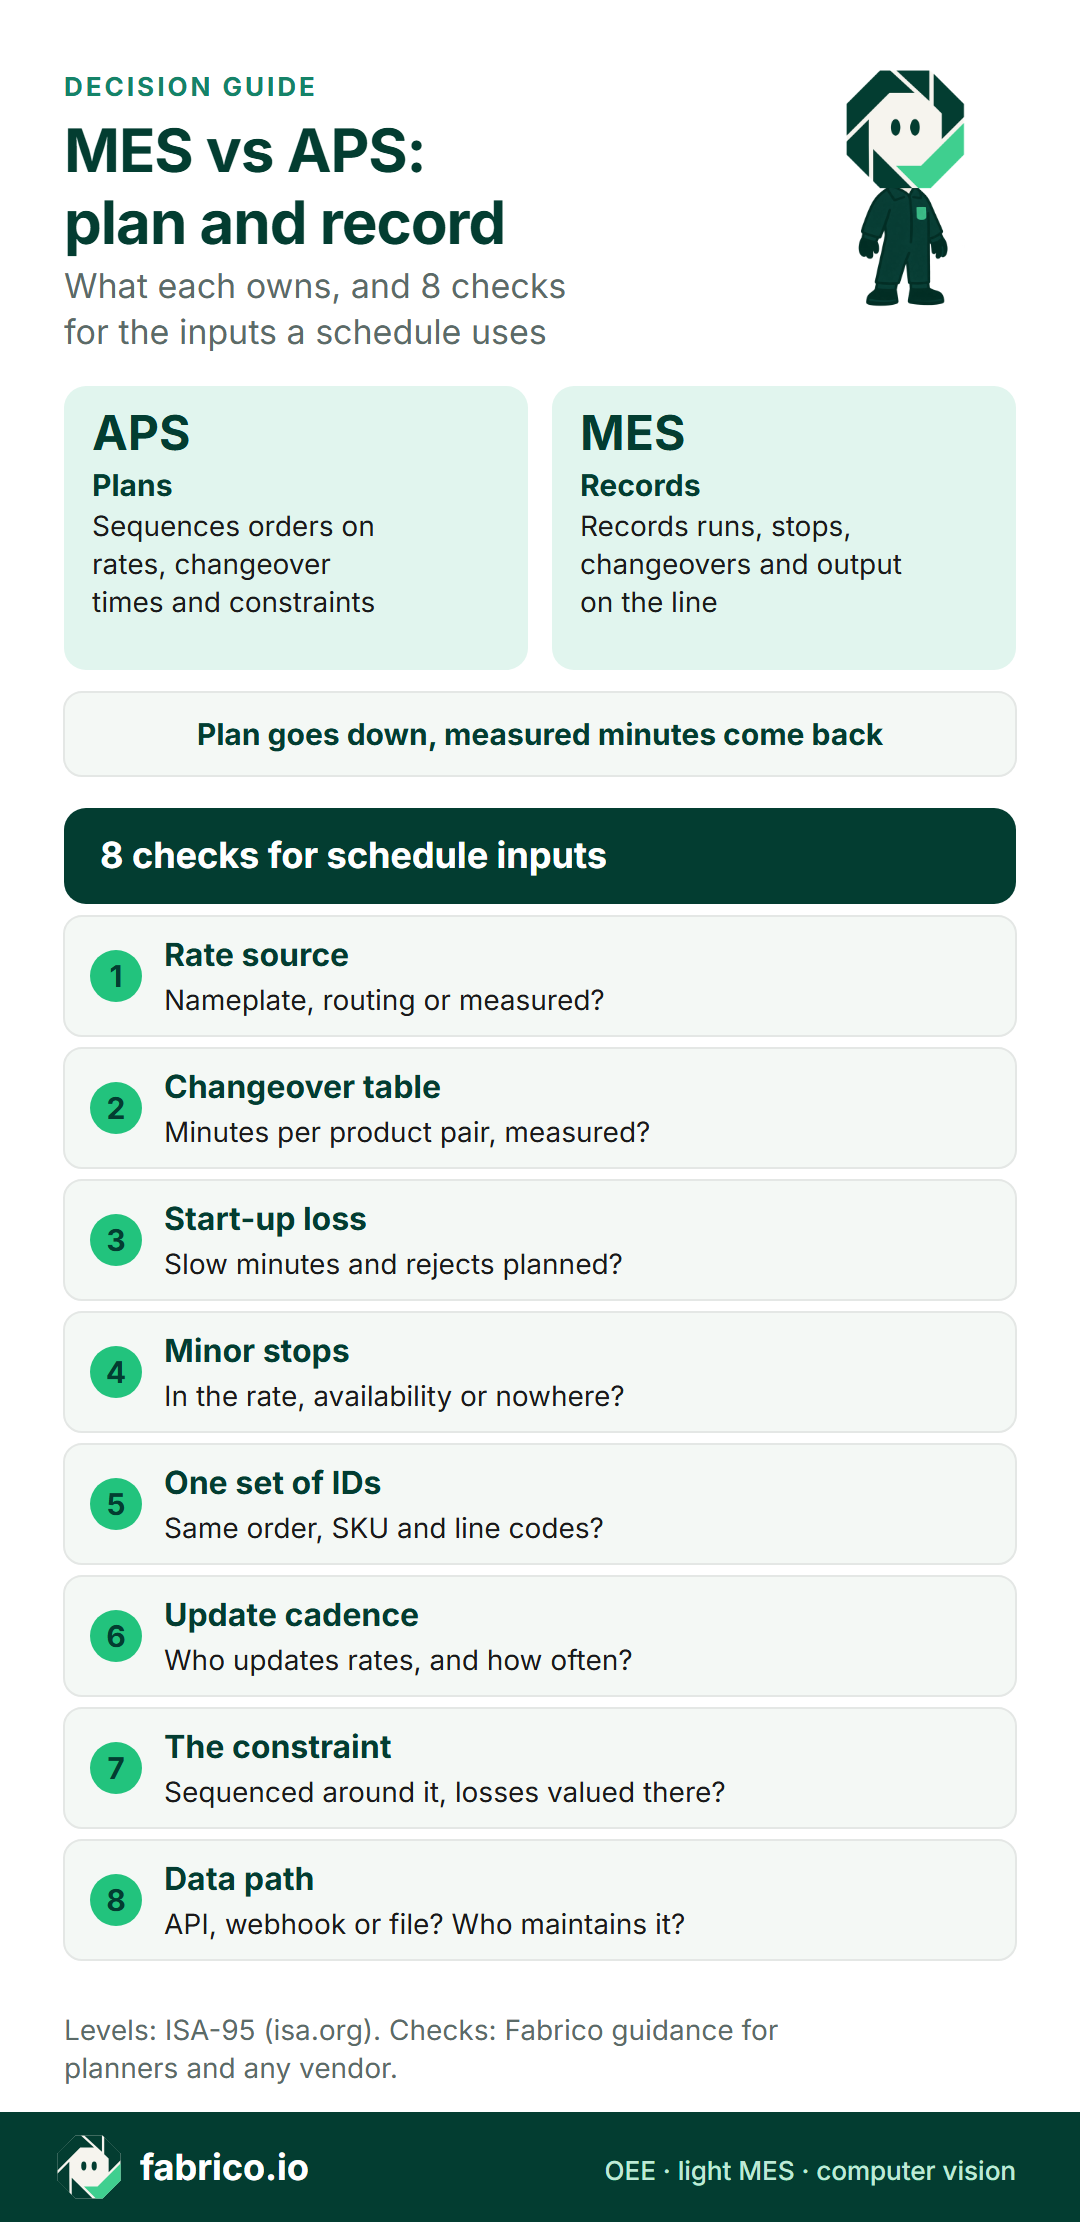
Text version of this infographic
- Two lanes: the APS plans the sequence; the MES records the line.
- The plan goes down; measured minutes come back.
- 8 checks: rate source, changeover table, start-up loss, minor stops, one set of IDs, update cadence, the constraint, data path. Each is a question in the checklist below.
Keep a changeover log on paper or in a spreadsheet? Book a demo with one week of it to hand and compare it with a measured line record.
Four steps before the first measured changeover table
- One set of codes: one SKU, line and order code across the APS, the ERP and the line, so measured minutes match the right order.
- Start at the constraint: the filler, bagger or sealer where the schedule misses most, from the machine signal, not a shift sheet.
- Log changeovers as their own stop reason, with the from and to product, so minutes can be grouped by pair.
- Feed the APS on a cadence: monthly per SKU and line to start, sooner after a new format or routine.
Sector detail: an MES on snack lines, where a mid-size FMCG plant starts and MES functions for food plants.
Schedule input checklist: 8 questions
Put these to your planners, IT/OT team and any vendor.
- Rate source: which rate does the APS use per SKU and line: nameplate, routing, or measured?
- Changeover table: are changeover minutes held per product pair, and when were they last measured?
- Start-up loss: does the schedule allow for slow running and rejects after a changeover?
- Minor stops: where do short stops go: into the rate, into availability, or nowhere?
- One set of IDs: do the APS, the ERP and the line record use the same order, SKU and line codes?
- Update cadence: who updates rates and changeover times, and how often?
- The constraint: is the sequence built around the constraint machine, and are its lost minutes valued there?
- Data path: how do measured minutes reach the APS, by API, webhook or file export, and who maintains that path?
If the answer to the second check is "one figure from the routing", start there.
Where Fabrico helps a planner
Fabrico, a cloud-based MES and OEE platform, sits on the record side of this split. For a planner whose APS still runs on routing figures:
- Rates from the line, not the routing: Performance sets actual output against what the ideal cycle time allows in the run time, and shift results show output, stops and OEE per shift, so the rate a planner keys into the APS can come from what the line made rather than from the routing.
- Downtime by cause: the operator picks the cause on a tablet or phone, from a reason list the plant defines, so downtime by cause, changeovers too if they are on the list, adds up shift by shift.
- Data out: REST API and webhooks, plus Excel or CSV export of any list. Whether that can keep an APS changeover table current is a question for your IT/OT team and the APS owner.
- Manual stations: where hand packing has no signal to read, the camera add-on counts output. Video from the camera add-on opens as a stream on request and, in the standard setup, is not kept in Fabrico. Camera add-on suggestions for stop reasons are roadmap work, in development.
Production planning and scheduling are not part of Fabrico today. Read more in the solution overview, how to judge OEE software, the scope of a light MES, how the camera add-on counts output and camera add-on use on FMCG lines.
Questions planners ask
What is the difference between MES and APS?
An APS plans forward: it sequences orders and sets start and finish times from rates, changeover times and constraints. An MES records what the line actually did: runs, stops, changeovers, good output and rejects.
Can an APS work without an MES?
It can run, but it plans on whatever rates and changeover times sit in its master data. Without measured figures those are routing or nameplate values, and the schedule drifts by the losses it never modelled.
Which data should flow from the MES to the APS?
Changeover minutes per product pair, the demonstrated rate per SKU and line, start-up losses after a changeover, and when each order closed with how many good units.
How often should changeover times in an APS be updated?
Start with a monthly update for each SKU and line, using the median of several weeks per product pair. Update sooner after a new format, a new line or a changed routine.
Can Fabrico build the schedule?
Production planning and scheduling are not part of Fabrico today. It records OEE, stops and output on the line, and data goes out by REST API, webhooks or Excel and CSV export. Whether that can keep an APS changeover table current is a question for your IT/OT team and the APS owner.
Want to put a schedule's changeover minutes next to measured ones? Book a demo; the changeover table from your APS is the one document worth having open.
Related articles


Latest from our blog



Real Fabrico tiles, sample data.