


 Login
 Blog

EU Factory Output Tracker: Monthly Industrial Production by Country

In short: EU factory output rose 0.5% in September 2026 and euro area output rose 0.2%, Eurostat reported on 16 November 2026, but both were lower than a year earlier (EU -0.8%, euro area -1.5%). Germany, Italy and Finland grew in the month; the Netherlands and France slipped. Managers in EU industry put capacity utilisation at 78.4% in October, below the long-term average of 80.3%.
- Non-durable consumer goods, the grouping that holds food and drink, fell 0.4% in the month and 7.5% on the year in the euro area. That is the figure to watch for an FMCG plant.
- A national figure says how busy industry is. It does not say whether your line was slow, stopped or short of orders. Split your own month into loading and OEE before you react.
- Example plant: an 8.3% order drop on a packing line. Planning hours to demand instead of running the old schedule frees 28 line hours a month, worth EUR 58,632 to EUR 67,704 a year at Eurostat labour costs.
Updated: 16 November 2026. Next update: December 2026.
This page tracks factory output in the EU and the euro area, plus the national releases that move first: Germany, Italy, the Netherlands, Finland and, outside the EU, the UK. Each month it adds the newest official figures under a dated heading and keeps the older ones below, so the page reads as a running record. It is written for plant, production and CI managers, so each release ends with a plant reading: what the figure means for loading a line, planning a shift or costing a unit. The thread through the page is the gap between national capacity utilization, which surveys and statistics offices report, and the OEE of one line, which only the plant can measure.
What this tracker follows, and where the figures come from
Every number below comes from an official release read on the day of the update. Releases are revised, sometimes by a full point, so the date of each reading is given with it. The core series are monthly indexes of industrial production: they measure the volume of output, after price changes are removed, against a base year.
| Series | Publisher | What it measures | Usual timing |
|---|---|---|---|
| Industrial production, euro area and EU | Eurostat | Total industry excluding construction, seasonally and calendar adjusted, with country figures | About 6 to 7 weeks after the month |
| Production in industry | Destatis (Germany) | Industry including energy and construction, plus sub-indexes by branch | About 5 weeks after the month |
| Produzione industriale | Istat (Italy) | Industrial production index by main grouping and sector | About 6 weeks after the month |
| Manufacturing output | CBS (Netherlands) | Manufacturing output, calendar adjusted, year on year, by sector | About 6 weeks after the month |
| Volume index of industrial output | Statistics Finland | Total industry and manufacturing by branch | About 6 weeks after the month |
| Index of Production | ONS (UK, outside the EU) | Production and manufacturing, monthly and three-monthly | About 6 weeks after the month |
| Capacity utilisation in industry | European Commission business survey | Managers' own estimate of how much capacity they use, asked in January, April, July and October | End of the survey month |
Two habits make the figures easier to use. First, read the month-on-month change for direction and the year-on-year change for level: a rebound after a bad month can still leave output below last year. Second, check what the index covers. Eurostat's total industry excludes construction; Destatis includes it. That is why the two offices print different numbers for Germany in the same month, as the September case below shows.
The latest month per country
| Area | Latest month | Month on month | Year on year | Published | Next release |
|---|---|---|---|---|---|
| EU (Eurostat) | September 2026 | +0.5% | -0.8% | 16 Nov 2026 | December 2026 |
| Euro area (Eurostat) | September 2026 | +0.2% | -1.5% | 16 Nov 2026 | December 2026 |
| UK manufacturing (ONS) | September 2026 | +0.7% | not stated | 12 Nov 2026 | 11 Dec 2026 |
| Italy (Istat) | September 2026 | +1.2% | -0.1% | 11 Nov 2026 | 11 Dec 2026 |
| Netherlands manufacturing (CBS) | September 2026 | not stated | +11.1% | 10 Nov 2026 | December 2026 |
| Finland (Statistics Finland) | September 2026 | +2.0% | +4.5% | 10 Nov 2026 | December 2026 |
| Germany (Destatis) | September 2026 | +0.7% | +0.4% | 6 Nov 2026 | December 2026 |
Year on year is calendar adjusted where the office gives it. "Not stated" means the release gives no consistent figure for it; we do not derive it. Germany's figure is Destatis' own, which includes construction; Eurostat's figure for Germany is +1.3% on the month.
September 2026: EU +0.5%, euro area +0.2%
Eurostat's first estimate, published on 16 November 2026, puts EU industrial production up 0.5% on August and euro area production up 0.2%. August was confirmed at -0.3% for the EU and -0.5% for the euro area, so the euro area recovered part of the loss and the EU more than all of it. On the year, the EU was 0.8% lower and the euro area 1.5% lower.
The split by grouping matters more to a plant than the total. In the euro area, intermediate goods rose 0.7% on the month, durable consumer goods 1.3%, and capital goods were flat. Energy fell 1.7%. Non-durable consumer goods, which include food, drink and other fast-moving goods, fell 0.4% on the month and stood 7.5% below September 2025; across the EU the annual fall was 6.1%. The country spread was wide: Denmark rose 3.7%, Poland 2.9%, Czechia and Slovakia 2.7% each, while Ireland fell 5.5%, Luxembourg 3.8% and Romania 2.6%. On the year, the Netherlands was 8.8% up and Ireland 19.1% down.
Plant reading. If you make non-durable consumer goods in the euro area, your sector's volume was 7.5% below last year in September while intermediate goods were slightly above it. A food or household-goods plant that held its own volume over that year has gained share; one that fell by about the same amount has simply moved with the market. Compare your own September against September 2025 before deciding that a weak month is a line problem. And if you supply buyers in Ireland, the 19.1% annual fall is a reason to check their forecasts line by line, not to assume a national number applies to them.
September 2026: UK manufacturing +0.7%, food and drink +2.9%
The Office for National Statistics reported on 12 November 2026 that UK production rose 0.3% in September and manufacturing 0.7%. Food products, beverages and tobacco rose 2.9% in the month. Over the third quarter, manufacturing grew 0.9% against the second, while production as a whole grew only 0.1%. Rubber and plastics products fell 2.0% over the quarter. The UK left the EU, so it is not in Eurostat's totals; it is here for EU plants that ship to UK customers or share a group with UK sites.
Plant reading. A 2.9% monthly rise in food and drink is volume coming back to lines that may have been run for a lower plan. When that happens, the first question is whether the extra cases come from more hours or from the hours already planned. A food line that ran at 60% OEE over the summer has spare output inside its existing shifts; a plastics or rubber converter, with its sector down 2.0% over the quarter, faces the opposite problem and should check how much of its planned time now waits for orders.
September 2026: Italy +1.2%, consumer goods -3.0% on the year
Istat reported on 11 November 2026 that Italian industrial production rose 1.2% from August, seasonally adjusted, but was 0.1% lower than a year earlier. Over the third quarter output was 0.4% below the second. By grouping, capital goods rose 1.3% on the month and 2.1% on the year; intermediate goods rose 1.2% on the month but were 1.4% lower on the year; consumer goods slipped 0.2% on the month and were 3.0% lower on the year. Transport equipment led the annual rises at 7.3%, while chemicals fell 8.3% and textiles, clothing and leather 4.5%.
Plant reading. Italy's September is a two-speed month: transport equipment up 7.3% on the year, consumer goods down 3.0%. A group with lines in both camps should not set one plant-wide target. For a consumer goods site, a 3.0% volume drop spread evenly over every line raises the cost of each unit on every line. Loading the volume onto the lines with the best measured OEE, and taking hours off the weakest one, keeps cost per unit flat. The worked example below shows the sums.
September 2026: Netherlands manufacturing +11.1% on the year, machinery +43.1%
Statistics Netherlands (CBS) reported on 10 November 2026 that calendar-adjusted manufacturing output was 11.1% higher than in September 2025, after an 11.7% annual rise in August. Machinery led with 43.1%. Metal products rose 2.4%, food products 0.6%, transport equipment 0.5% and chemical products 0.3%; rubber and plastic products fell 1.9%, electrical and electronic equipment 2.5% and repair and installation 4.3%. Producer confidence fell from 4.2 in September to 2.3 in October, still above its 20-year average of -1.4. Eurostat's figure for Dutch total industry is different again: -0.2% on the month and +8.8% on the year.
Plant reading. An 11.1% national rise that rests on a 43.1% jump in machinery tells a Dutch food plant, whose sector grew 0.6%, almost nothing about that plant's lines. The same is true inside a plant: a site OEE average can look healthy because one line is excellent while two lag. Look at the sector line in the release, then at your line-by-line figures, never at the headline alone.
September 2026: Finland +2.0%, chemicals +8.2%
Statistics Finland reported on 10 November 2026 that industrial output rose 2.0% in September from August, seasonally adjusted, and was 4.5% higher than a year earlier, working-day adjusted. Manufacturing rose 2.1% on the month and 5.6% on the year. By branch, chemicals rose 8.2% on the month, electrical and electronics 1.7% and food 0.3%. Mining and quarrying rose 11.6%, while electricity, gas, steam and air conditioning supply fell 9.7%. Eurostat's figure for Finland is +1.9% on the month.
Plant reading. An 8.2% monthly jump in a branch is the kind of move a plant should take apart before it celebrates. Output can rise because lines ran more hours, ran closer to their rated speed, or scrapped less. Only the first one is a planning decision; the other two are improvements that should be kept. A Finnish chemicals or packaging site that saw a jump like this in its own September should check which of the three it was, line by line.
September 2026: Germany +0.7%, cars +17.1% after changeovers
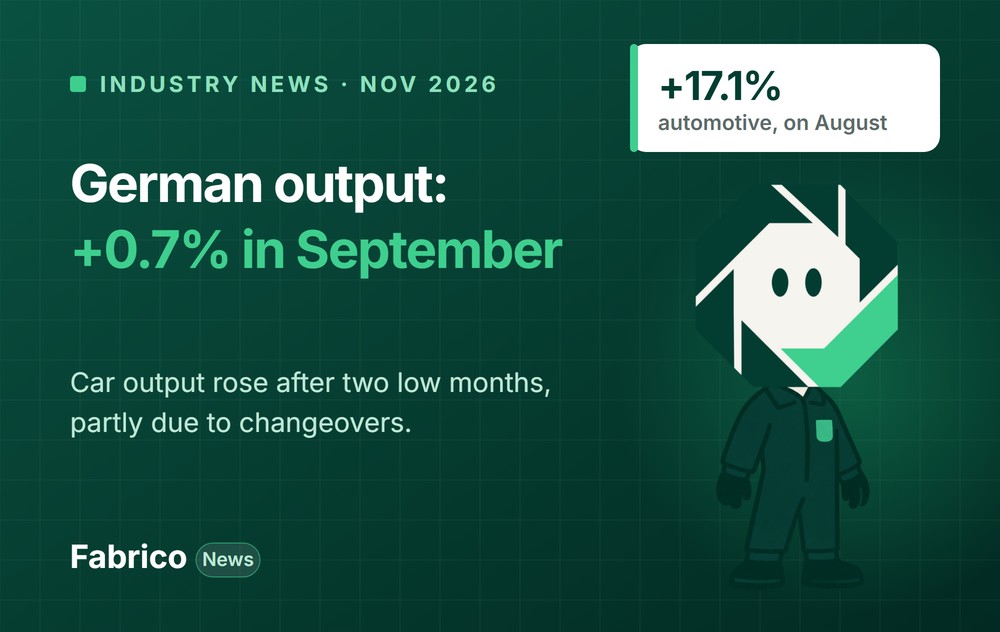
Destatis reported on 6 November 2026 that German production rose 0.7% in September from August, and 0.4% on the year. August was revised down from +2.0% to +1.0%. Industry excluding energy and construction rose 1.7% on the month. The automotive industry rose 17.1%; Destatis says output there had been at a low level in the two months before, in part because of production changeovers and factory holidays. Over the third quarter, production was 0.4% below the second, and the energy-intensive branches were 3.5% lower. The trade body VDA counted 392,200 passenger cars built in Germany in September, level with a year earlier, and 3,034,900 from January to September, 4% fewer than in 2025. Our earlier note on the German September figure covers the release in more detail.
Plant reading. Destatis names changeovers as part of the reason a whole sector's output sat low for two months. A 17.1% rebound in one month is what that looks like at national scale. In one plant, a run of model or product changeovers does the same to a line's month: output drops, and nobody has lost capacity. If your summer figures were weak, separate changeover hours from other stops before you compare them with autumn. For an energy-intensive site, the quarter's 3.5% fall means fixed energy spread over fewer good units, so every hour of scrap costs more than it did a year ago.
October 2026 survey: EU capacity utilisation 78.4%
The European Commission's business survey, published on 29 October 2026, puts capacity utilisation in EU industry at 78.4% in October, up 0.5 points from July and below the long-term average of 80.3%. In euro area manufacturing it rose 0.4 points to 78.6%. Insufficient demand limited production for 33.9% of industry managers and labour shortages for 17.0%, both about unchanged; shortages of materials or equipment rose 2.1 points to 14.7%.
Plant reading. This is the EU's survey measure of capacity utilisation, and it is a manager's estimate, not a measurement. One in three managers say demand limits them; one in six say people do. Those are two different problems on a line. If demand is the limit, the line has hours with no orders and the task is to stop paying for them. If people are the limit, the line has orders and the task is to get more good output from the crew already there. The next section turns that into three checks.
What it means for your line: three checks
National figures tell you which way the market moved. They cannot tell you whether a given line lost output to stops, slow running, scrap or empty order books. These three checks connect the release to the line.
1. Split your utilisation into loading and OEE
A survey answer of 78% mixes two things: how many hours the line was scheduled, and how well it ran in those hours. Write them down separately. Loading is planned production time divided by calendar time; OEE is good output divided by what the line could make at its ideal rate in the planned time. Multiply them and you get TEEP. A line scheduled for 336 of 720 hours in a month has a loading of 46.7%; at 62.5% OEE its TEEP is 29.2%. Our guides on the capacity utilization rate in manufacturing and on TEEP show the arithmetic. The split tells you which lever is real: a line with low loading and good OEE needs orders, not engineering.
2. Decide where "no orders" time goes, then price a unit
When orders fall, a line often keeps its shift pattern and waits, slows down or runs short batches. If that waiting time stays inside planned production time, OEE falls even though nothing broke. If it is moved out, OEE holds and loading falls. Either is a valid convention, but the plant must pick one and keep it, or month-on-month OEE will move with demand and hide the real losses. The difference is set out in planned production time vs operating time. Then put a cost on it: labour and fixed cost divided by good units is the cost per unit that OEE drives.
3. Compare your month with your sector's, line by line
Take the sector line from the release that fits your plant: euro area non-durable consumer goods at -7.5% on the year, UK food and drink at +2.9% on the month, Italian consumer goods at -3.0% on the year, Dutch food at +0.6%. Set each of your lines beside it for the same month. A line that fell further than its sector lost something of its own; a line that rose while its sector fell has found output, and the shift records should show where. That comparison needs run hours, stops and counts per line and shift. OEE software records them as they happen, and a light MES ties them to orders, so the comparison takes minutes rather than a week of spreadsheets.
Worked example: an 8.3% order drop on a packing line
Example plant. Every figure here is example data except the two labour cost values, which are sourced. The plant is not a company named on this page.
A food plant in the euro area runs one packing line on two 8-hour shifts, 21 days a month: 336 planned hours. The line's ideal rate is 6,000 packs an hour and it runs at 62.5% OEE, so it makes 3,750 good packs per planned hour, or 1,260,000 packs a month. Each shift has a crew of five. The plant's main customer cuts the monthly order by 8.3%, to 1,155,000 packs, in line with a sector that is several points down on the year.
The labour cost per hour, from Eurostat
Eurostat's hourly labour cost figures for 2025, extracted on 31 March 2026, give EUR 34.9 an hour for the whole EU economy and EUR 40.3 an hour for industry in the euro area. We use them as the low and high ends. They include wages and employer social costs, and they are averages, not any plant's rate. For a crew of five, one line hour costs 5 x EUR 34.9 = EUR 174.50 at the low end and 5 x EUR 40.3 = EUR 201.50 at the high end.
Two ways to handle the drop
| Example data | Before the drop | A: keep the old schedule | B: plan hours to demand |
|---|---|---|---|
| Packs a month | 1,260,000 | 1,155,000 | 1,155,000 |
| Planned line hours | 336 | 336 | 308 |
| OEE (no-order time left in planned time) | 62.5% | 57.3% | 62.5% |
| Labour a month, low | EUR 58,632 | EUR 58,632 | EUR 53,746 |
| Labour a month, high | EUR 67,704 | EUR 67,704 | EUR 62,062 |
| Labour per 1,000 packs | EUR 46.53 to 53.73 | EUR 50.76 to 58.62 | EUR 46.53 to 53.73 |
Option A is the realistic baseline: the shift pattern is already agreed, so the line keeps it and waits between orders. OEE falls to 1,155,000 / (336 x 6,000) = 57.3%, and labour per 1,000 packs rises by 1,260,000 / 1,155,000 = 9.1%, from EUR 46.53 to EUR 50.76 at the low rate (EUR 58,632 / 1,155 thousand packs). Nothing on the line got worse. The cost per unit rose because the same hours were spread over fewer packs.
Option B plans the hours to the order. At the line's real rate of 3,750 good packs an hour, 1,155,000 packs need 1,155,000 / 3,750 = 308 hours. That frees 336 minus 308 = 28 line hours a month, three and a half shifts. At the low rate the freed hours are worth 28 x EUR 174.50 = EUR 4,886 a month, and at the high rate 28 x EUR 201.50 = EUR 5,642 a month. Over a year that is EUR 58,632 to EUR 67,704: the same as a full month of the line's labour.
The money is only real if the hours go somewhere useful. In practice the crew moves to a line that is short of people (17.0% of EU managers named labour shortages in October), or the freed shifts carry planned maintenance and changeover work that would otherwise eat production time. If the crew simply waits elsewhere, the plant has freed hours, not cash. The calculation also needs the 62.5% to be a measured figure: plan 308 hours on a line that truly runs at 57%, and the order ships late.
Book a demo and see OEE and losses per line and shift.
Which response fits a falling or rising month
The same release can call for opposite moves in two plants. The table sets out the usual responses, what each costs and which plant it suits.
| Response | What it costs | Fits a plant where | Check first |
|---|---|---|---|
| Keep the schedule and wait | Labour per unit rises with the order drop (9.1% in the example) | The drop is expected to last weeks, not months | Customer forecast for the next quarter |
| Plan hours to demand on the best line | Planning effort; crew moves or retrains | Lines differ in measured OEE and the crew can move | OEE by line over the last 8 weeks |
| Use freed shifts for maintenance and changeover work | Parts and contractor time, already budgeted | Planned work keeps getting pushed into production time | Hours of planned work deferred this year |
| Add hours when output rises | Overtime premium or a new shift | Lines already run close to their own best weeks | Whether stops and slow running leave output inside current shifts |
| Recover output inside current shifts | Loss work on changeovers, short stops and scrap | OEE is well below the line's own best weeks | The gap between the best and the average week |
How to read next month's release in 15 minutes
The figures arrive over about ten days each month. A routine keeps them from turning into a talking point that changes nothing.
This week
- Production manager: pull September and September 2025 for each line: planned hours, good output and OEE. Put them beside the sector line from this page.
- Plant manager: write down which loading convention the plant uses for no-order time, and check that every line reports the same way.
- CI manager: take the line with the biggest gap between its best and average week in the last quarter. That gap is the output you can sell before buying hours.
This quarter
- Set a monthly 15-minute review the week after Eurostat's release: sector move, your move, the gap, one action.
- Track loading and OEE as two numbers on the same chart, so a demand drop and a performance drop can no longer look alike.
- Cost one hour of each line with your own labour and energy rates, and keep it next to the OEE chart.
- Agree a rule for planning to demand: when orders fall by more than an agreed share, the planner moves volume to the line with the best measured OEE and books the freed hours to planned work.
How Fabrico fits
Fabrico is a cloud OEE and light MES platform. It shows OEE and losses by machine, line and shift, from the PLC or a Fabrico IoT device, with the reasons operators add on a tablet or phone. That gives a plant the line-level half of this page: planned hours, run hours, stops and good counts, ready to set beside each month's official figure.
On manual stations, AI cameras (an add-on) count output.
Book a demo and see good output per line and shift.
Updated: 16 November 2026. Next update: December 2026, with October data from Destatis, Istat, the ONS and Eurostat.
What people ask next
What is the latest euro area industrial production figure?
Eurostat's first estimate for September 2026, published on 16 November 2026, shows euro area industrial production up 0.2% on August and 1.5% lower than a year earlier. EU production rose 0.5% on the month and was 0.8% lower on the year. October figures follow in December 2026.
How often is German industrial production published?
Monthly. Destatis publishes production in industry about five weeks after the month ends; September 2026 came out on 6 November 2026 at +0.7% on the month. Eurostat publishes its own figure for Germany about ten days later, excluding construction, which is why the two can differ (+1.3% for September).
What is the difference between industrial production and capacity utilisation?
Industrial production measures the volume of output, compared with a base year. Capacity utilisation estimates how much of the available capacity was used. In the EU it comes from a quarterly survey of managers: 78.4% in October 2026, against a long-term average of 80.3%. Neither says how well a single line ran; that is OEE.
Is EU industrial output rising in 2026?
Not since the summer. EU industrial production was above a year earlier from April to July 2026, then 0.1% below in August and 0.8% below in September; euro area production was 1.5% below in September, even after monthly gains. The split is uneven: euro area intermediate and durable consumer goods were up on the year, non-durable consumer goods down 7.5%.
How should a plant use monthly industrial production data?
As a benchmark, not a plan. Compare your own month with the sector line that fits your plant, line by line. Then split your utilisation into loading and OEE, so you can tell a drop in orders from a drop in line performance before you change shifts.
Why do the Netherlands' figures look so different from Eurostat's?
They measure different things. CBS reports manufacturing output, calendar adjusted, year on year: +11.1% in September 2026, led by machinery at +43.1%. Eurostat reports total industry for the Netherlands: -0.2% on the month and +8.8% on the year.
Sources
Sources accessed on 16 November 2026 unless marked as accessed on another date. Dates are the publication dates shown on each page.
- Eurostat, euro indicators: Industrial production up by 0.2% in the euro area and by 0.5% in the EU (September 2026), 16 November 2026, accessed 16 November 2026
- European Commission, Business and consumer survey results for October 2026 (PDF), 29 October 2026, accessed 16 November 2026
- Eurostat, Statistics Explained: Hourly labour costs (2025 data), data extracted 31 March 2026, accessed 16 November 2026
- Destatis, Production in September 2026: +0.7% on the previous month, press release No. 389, 6 November 2026, accessed 16 November 2026
- VDA, Production and market in September 2026, 4 October 2026, accessed 16 November 2026
- Istat, Produzione industriale, settembre 2026, 11 November 2026, accessed 16 November 2026
- Statistics Netherlands (CBS), Manufacturing output 11.1 percent higher in September year-on-year, 10 November 2026, accessed 16 November 2026
- Statistics Finland, Volume index of industrial output 2026, September, 10 November 2026, accessed 16 November 2026
- Office for National Statistics, Index of Production, UK: September 2026, 12 November 2026, accessed 16 November 2026
Related articles



Latest from our blog






Real Fabrico tiles, sample data.