


 Login
 Blog
Production Line Relocation: OEE Baseline, Downtime and Recovery

In short: a production line relocation goes to plan when the line's OEE is measured on the old site first, "back to normal" is written down as numbers before it stops, and weekly recovery after restart is tracked against that baseline until an agreed rule closes the move.
- Record availability, performance, quality and the top losses over normal weeks, before the stock build starts.
- Plan the downtime window and the recovery gap together: the stock build has to cover both.
- Name an owner for each part of the gap: the internal team, the rigger or installer, or the machine builder.
- Close the move on a written rule, not on the first good shift.
The line stops on a Friday night, the riggers come on Saturday, and the project plan has it running again two weeks later. What the plan may not hold is a figure for how well the line ran before it stopped, or a rule for when it is that good again. This guide covers both for an existing food or FMCG line moving within one site or to another plant.
A word on the author: Fabrico makes OEE and light MES software that measures lines, so read the Fabrico section as a vendor's view.
Still choosing whether to move at all? Compare new line cost vs recovering capacity and nameplate vs real capacity. A rebuild with new equipment needs factory and site acceptance tests; a line built from scratch needs a ramp-up plan for a new line, not a recovery curve.
A line move is more than lifting machines
In a 2019 paper in Production Planning and Control, Fredriksson and Jonsson write that manufacturing relocation is not just a question of transferring hardware: the knowledge of how to run it has to move too. Their 2011 to 2012 survey covered 178 Swedish and Danish manufacturers with over 50 employees that had moved production to another unit of their international network or to a supplier, with the CEO or plant manager answering for the sending plant's most recent transfer. Moves inside one site were not sampled.
Drawing on earlier start-up research, they describe a start-up phase and a steady state, reached when the receiving site makes full-scale production at the targeted levels of cost, quality, volume and yield. In between, rate and yield rise step by step as the new crew learns the process.
A moved line has one advantage over a new one: a record. Its target is what the same machines did last month, if someone measured it.
Moves within a group are the common pattern when work crosses a border. Eurostat's 2021 to 2023 global value chains survey covers enterprises with 50 or more people employed in the business economy, in 22 EU countries and Norway. Of those that sourced business functions abroad, 72% of enterprises that sourced business functions abroad did so within their own group, against 39% that outsourced to another company. Production of goods and materials was one of the functions most often sourced abroad, at 27%. For a plant manager, that makes a transfer to a sister plant the typical cross-border case, and it means the baseline and the recovery weeks come from two sites. Define OEE, the counting point and the stop reasons the same way at both, or the figures cannot be compared. The worked example below follows such a transfer.
Measure the old site first
Take the baseline while the line still runs as usual. Once the stock build begins, shifts run longer, the mix narrows, and the figures stop describing a normal week.
- Period: 6 to 8 normal weeks before the stock build, leaving out weeks with trials or long breakdowns.
- Three factors, kept apart: availability, performance and quality, not only the OEE figure.
- Top losses: the five largest in minutes, by machine.
- Rated speed and mix: per format, with each format's share of the baseline weeks.
- Quality rules: which rejects count, including start-up scrap.
Then freeze two things that travel with the line: the counting point, ideally the constraint, and the stop reason list. If either changes, the comparison measures the method, not the line. The math here follows our OEE calculation guide: availability x performance x quality, losses valued at the constraint, each lost pack counted once.
Agree what "back to normal" means before the line stops
Without a written definition, the move ends when people tire of it. Put the rule in the project plan:
- Per factor: availability, performance and quality each within a set margin of the baseline, such as one point.
- Held: three weeks in a row inside the margin, so one good week does not close the move.
- Same mix: compared on a mix close to the baseline weeks, or format by format.
Recover to the baseline first, then set any improvement target; otherwise nobody can tell whether the move went well.
Move now, move later or rebuild instead
The baseline also shows whether to move now, and whether to move at all. The money in the table is sample figures from the biscuit line in the worked example below: output valued at a contribution of EUR 0.0525 a pack (anchored to an industry margin range there) and people's time at the euro area industry labour cost of EUR 40.3 an hour (Eurostat, 2025, accessed 15.11.2026). Rigging, machine builder and capex figures come from quotes, so they are named, not priced.
| Option | Choose it if the plant sees | Cost or effort (sample) | Why |
|---|---|---|---|
| Move now | Baseline measured, stock build possible, services tested, no peak season inside the expected recovery | Recovery gap of 739,151 to 994,069 good packs, EUR 38,805 to 52,189 of contribution at risk if stock runs short. A stock build of 2,240,625 to 2,495,543 packs: about 54 to 60 extra shifts, EUR 81,200 to 90,400 of crew time for a crew of 5, if it is built on extra shifts. Plus the rigger's quote | Target and cover are both known |
| Move later, measure first | No baseline, or many stops with no reason, or peak season inside the expected recovery | 6 to 8 normal weeks of measuring at 2 to 4 h of CI time a week: 12 to 32 h, EUR 484 to 1,290, plus the cost of waiting for the new site | Nothing to recover to yet, or the gap would hit the busiest weeks |
| Split the move into stages | Stock cannot cover one long window and the recovery gap together | Two or more shorter windows, each with its own recovery curve and its own rigging quote; the stock for each stage is sized on the same rule | Smaller gaps, but more restarts to recover from |
| Rebuild or replace | Top losses come from worn or outdated machines, or the new layout needs new conveyors or a new line shape | Machine builder's quote, plus factory and site acceptance tests and a ramp-up plan instead of a recovery curve | Moving machines moves losses |
Questions to put to the rigger or installer, the machine builder and your own project team before the window is booked:
- Who checks each machine's heights, alignment and settings against the old-site record after placing, and on which day of the window?
- Which tasks in your scope sit inside the downtime window, and which sign-off closes each one?
- Will output be counted at the same machine, with the same stop reason list, after restart?
- If a loss after restart traces to transit, installation or controls, what does your scope cover, and how fast is a fix on site?
- If the machines come with the builder's monitoring, does it count at the same point and use the same OEE definition as the plant?
Book a demo to see how a baseline is measured at the machine, through the PLC, an IoT device with sensors or, at a hand-pack station, the camera add-on, before the line stops.
Plan the downtime window and the stock to cover it
The window is the time with no output: run-down, cleaning, transport, placing, services, re-commissioning and trials. Give each task an owner and a sign-off.
In food plants, placement matters for hygiene too. In the United States, the FDA rule for human food facilities, 21 CFR 117.40(a)(3), says equipment must be installed so as to facilitate the cleaning and maintenance of the equipment and adjacent spaces. Elsewhere, check local rules with your food safety team.
Safety steps belong in the window plan too, with hours against them. In Great Britain, PUWER regulation 6 requires work equipment whose safety depends on its installation to be inspected after assembly at a new site or in a new location, to confirm it is installed correctly and safe to operate. Under LOLER regulation 8, each lifting operation must be properly planned by a competent person, supervised and carried out safely; book the rigger's lift plan as a dated task in the window. In the United States, OSHA's lockout/tagout standard covers servicing where an unexpected start-up or a release of stored energy could injure workers, and it defines servicing to include constructing, installing, setting up, adjusting, inspecting, modifying and maintaining machines. Which disconnect and reconnect tasks need documented energy control procedures is for your safety team to decide. Each of these steps takes hours, so book them inside the window rather than in the first production week.
Do not size the stock build for the window alone. The line restarts below its baseline, so stock must cover the window plus the recovery gap.
Track the recovery curve after restart
From the first production shift, compare each week with the baseline, factor by factor:
- Availability shows alignment, controls and services: faults, jams at transfers, waiting for air or power.
- Performance shows speed below rated and short stops; see where reduced speed ends and minor stops begin.
- Quality shows settings: seal, weight, labels, start-up scrap.
Add good output lost against the baseline to the weekly review. If the machine builder brings its own monitoring, agree whose figures count; see OEM line monitoring vs OEE software.
Who owns the recovery gap
A move can involve the plant's own team, a rigger or installer and the machine builder. Who pays is for the orders and your legal team; the table shows where to look first:
| Loss after restart | Owner to check first | Evidence to keep |
|---|---|---|
| Misalignment, transfer heights, transit damage | Rigger or installer, per their scope | Stops by machine, photos, dates |
| Controls, drives, recipes, safety circuits | Machine builder or controls contractor, if ordered | Fault list, settings before and after |
| Air, power, water, steam, network | Internal engineering or projects team | Waiting time by cause |
| New crew, new routines | Internal team, with training planned | Stops and scrap by shift |
| Materials, upstream and downstream flow | Internal team and suppliers | Starved and blocked time |
Agree the split before the line stops, so no loss sits on the curve unowned. If the curve stays flat for two weekly reviews and the main loss sits in the rigger's, installer's or machine builder's scope, escalate: send the stop log, settings record and dates in writing, with a date for the fix.
Worked example: a biscuit line moves to a sister plant
Sample figures for illustration only. A biscuit plant moves a packing line to a sister plant. The flow wrapper is the constraint, rated at 135 packs a minute. A week has 8,100 planned minutes (3 shifts of 450 minutes, 6 days), so at most 8,100 x 135 = 1,093,500 packs.
Baseline, average of 8 normal weeks on the old site:
- Availability: 1,458 minutes of stops, run time 6,642 minutes: 6,642 / 8,100 = 82.0%.
- Performance: 762,170 packs against 6,642 x 135 = 896,670 possible: 85.0%.
- Quality: 11,433 rejects, 750,737 good packs: 98.5%.
- OEE: 0.820 x 0.850 x 0.985 = 68.7%. Check: 750,737 / 1,093,500 = 68.7%.
The move takes 2 weeks with no output. The agreed rule: the move closes when each factor is less than one point below the baseline for three weeks running.
Week 1 after restart: 3,240 minutes of stops give availability of 4,860 / 8,100 = 60.0%. 459,270 packs against 656,100 possible is performance of 70.0%. 22,964 rejects leave 436,306 good packs, quality 95.0%. OEE: 0.600 x 0.700 x 0.950 = 39.9%. Check: 436,306 / 1,093,500 = 39.9%. Losses in packs, each counted once: stops 437,400, speed 196,830, rejects 22,964; 1,093,500 minus their sum leaves 436,306, which matches.
All eight weeks, with good packs lost against the baseline of 750,737 a week:
| Week | A x P x Q | OEE | Good packs lost |
|---|---|---|---|
| 1 | 60.0% x 70.0% x 95.0% | 39.9% | 314,431 |
| 2 | 68.0% x 75.0% x 96.5% | 49.2% | 212,571 |
| 3 | 74.0% x 79.0% x 97.5% | 57.0% | 127,459 |
| 4 | 78.0% x 82.0% x 98.0% | 62.7% | 65,322 |
| 5 | 81.0% x 84.0% x 98.3% | 66.9% | 19,368 |
| 6 | 82.0% x 85.0% x 98.5% | 68.7% | 0 |
| 7 | 82.0% x 85.5% x 98.5% | 69.1% | 0 |
| 8 | 82.5% x 85.0% x 98.6% | 69.1% | 0 |
Recovery cost 739,151 good packs over weeks 1 to 5, close to one more baseline week. The stock build needed about 2,240,625 packs: two baseline weeks for the window plus the gap. Stock sized for the window alone would have run out in week 1 after restart.
In money: take a sample factory price of EUR 0.42 a pack and a sample contribution margin of 12.5%, or EUR 0.0525 a pack. Is 12.5% fair? NYU Stern's margin dataset (January 2026 data, 78 US food processing firms, accessed 15.11.2026) puts the pre-tax operating margin at 10.63% and the gross margin at 23.23%. Contribution sits above the first, because operating margin is struck after all fixed costs. It can sit above the second too, because gross margin still carries fixed plant cost, so 12.5% values the recovery gap on the low side. A baseline week of 750,737 good packs is then worth EUR 39,413.69, and the recovery gap of 739,151 packs EUR 38,805.43, almost one more week of contribution. Without stock to cover it, that is margin lost on orders the plant cannot ship. If recovery stalls: say the curve sits at week 3's level for two extra weeks, losing 127,459 packs each. The gap grows by 254,918 packs, EUR 13,383.20, to 994,069 packs, EUR 52,188.62, and the stock build has to rise from 2,240,625 to 2,495,543 packs. Size the stock on that slower curve, and free the surplus once the line passes week 5.
Week 5 is a full point short on availability and performance. Weeks 6, 7 and 8 are less than one point below the baseline on all three factors, so the move closes after week 8. Jams at a re-used transfer conveyor set at a new height, a rigger item fixed in week 4, held availability back longest.
What goes wrong after restart, and the sign in the data
Five failures that show in the weekly figures before they show in the move report:
| What goes wrong | Early sign in line data | Fix |
|---|---|---|
| Counting point moved | A factor above its baseline in week 1, when it should be below | Restore the old counting point before reading the curve |
| Reason list rewritten | Stop time with no reason rises; new reason names appear | Map the new names back to the frozen list |
| Transit misalignment | Jams at one transfer, availability flat after week 2 | Check heights and alignment against the old-site record |
| Services undersized | Waiting for air or power, clustered at peak load | Measure supply under full load; engineering owns it |
| New crew still learning | One shift's stops and scrap well above the others | Pair that shift with operators from the old site |
Line relocation checklist: what to agree before the riggers arrive
For the project team, the rigger or installer and the machine builder:
- Old-site baseline: Are A, P, Q and the top five losses measured over normal weeks?
- Same counting point: Is output counted at the same machine, the same way, after restart?
- Reasons travel too: Does the stop reason list move with the line, unchanged?
- Normal in numbers: Is back to normal a figure per factor, with the weeks it must hold?
- Window tasks: Which tasks sit in the downtime window, and who signs each off?
- Stock cover: Does stock cover the window and the recovery gap, outside peak season?
- Who owns the gap: Which losses sit with the internal team, the rigger or installer, the builder?
- Close-out rule: What closes the move, what keeps it open, what triggers escalation?
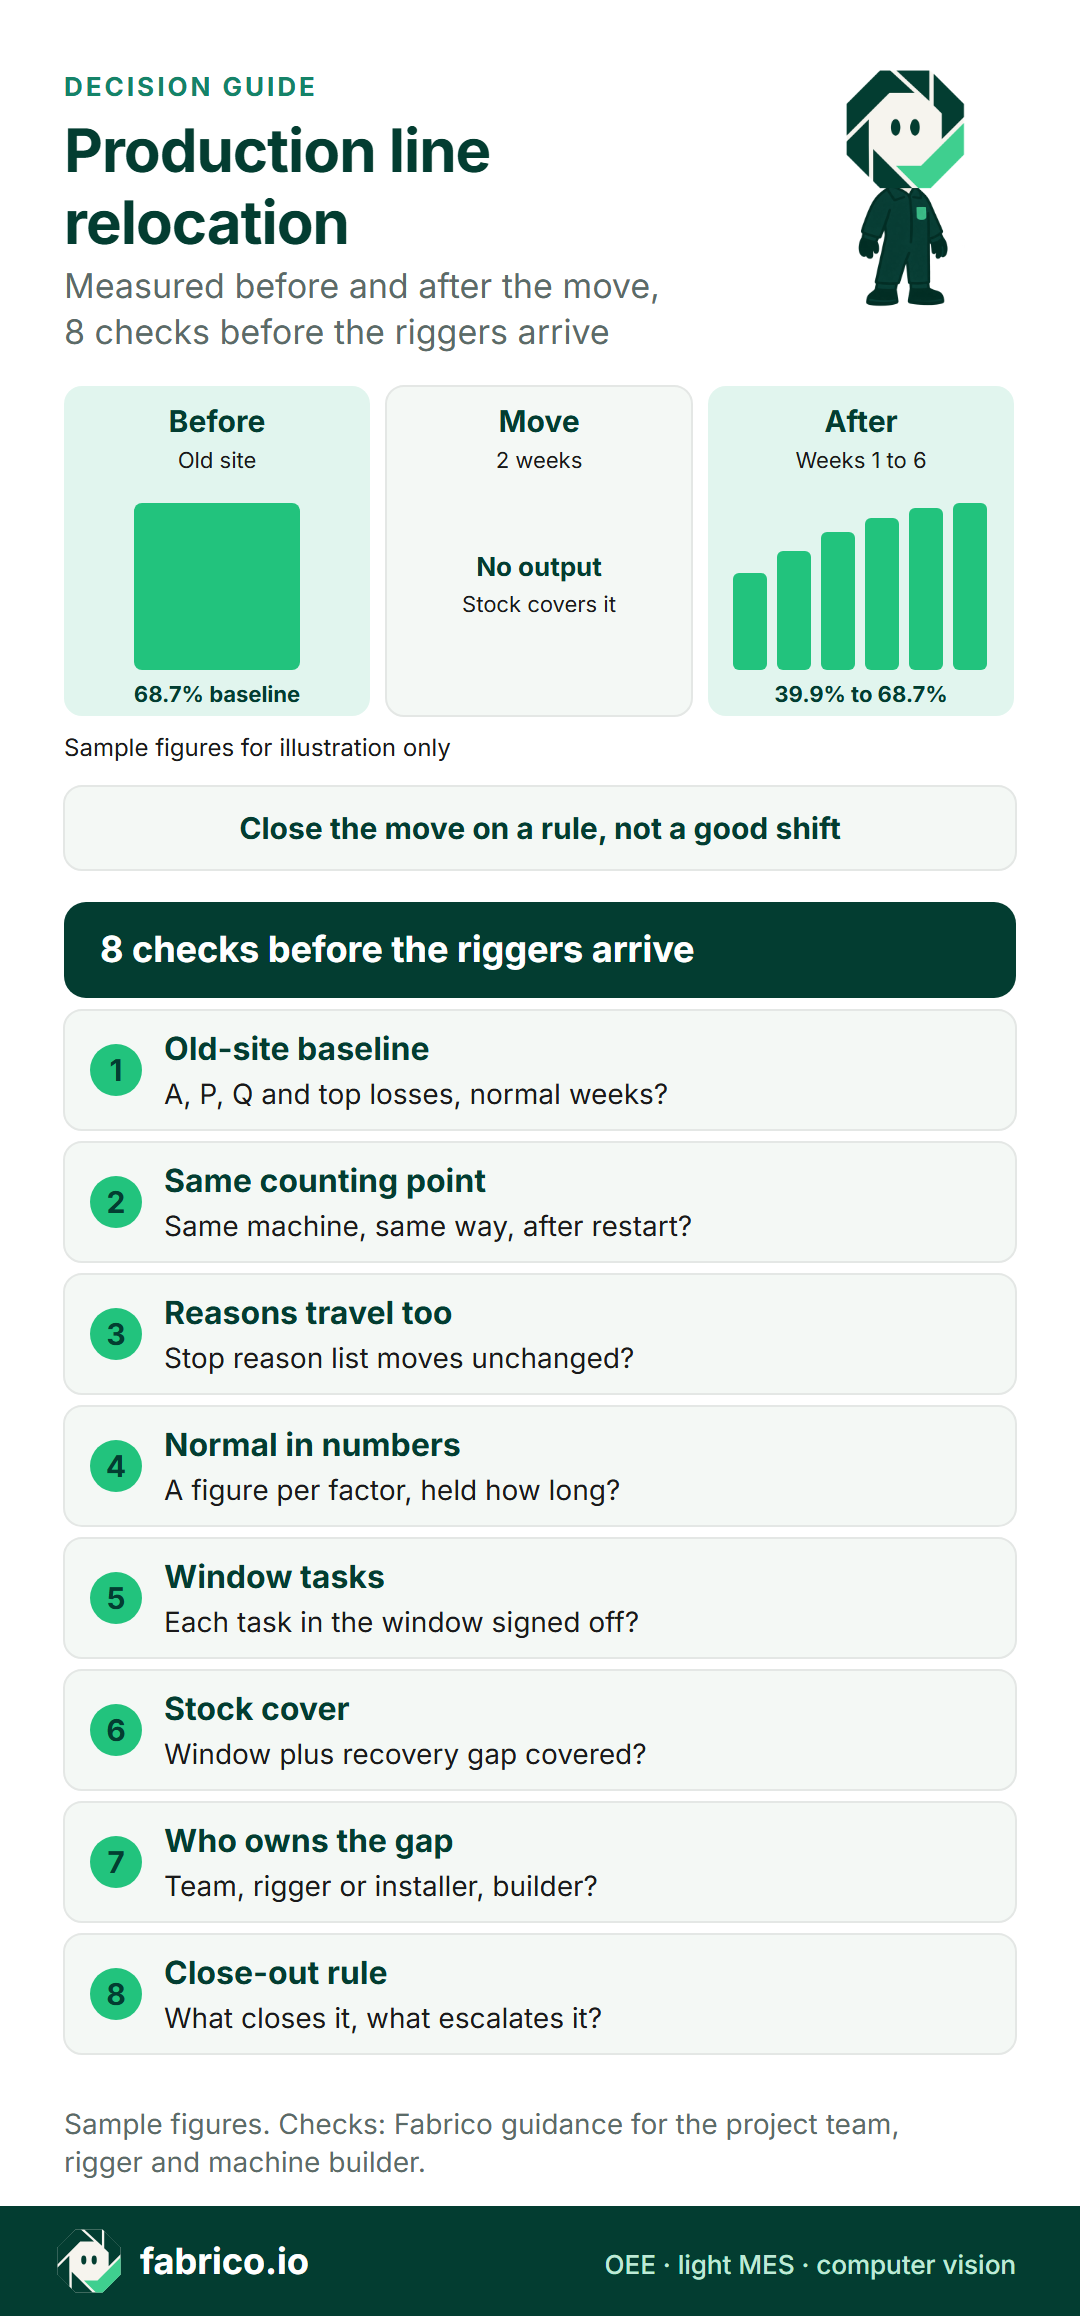
Text version of this infographic
- Heading: production line relocation, measured before and after the move.
- Before: old-site baseline OEE 68.7% over 8 normal weeks (sample).
- Move: 2 weeks with no output, covered by the stock build.
- After: weekly OEE rises from 39.9% in week 1 to the 68.7% baseline in week 6.
- Close the move on a rule, not a good shift.
- 8 checks before the riggers arrive: old-site baseline, same counting point, reasons travel too, normal in numbers, window tasks, stock cover, who owns the gap, close-out rule.
What to do this week, before the move is booked
Five actions, each with a name and a date against it:
- Monday: the operations manager exports the stop reason list, dates it and signs it as the only version until the move closes.
- By Wednesday: the CI or OEE lead marks 6 to 8 normal weeks on the calendar, all before the stock build, and confirms where output is counted at the wrapper or other constraint.
- By Friday: the project lead drafts the close-out rule; operations signs it before the window is booked.
- Next week: the project lead gets a date for the rigger's lift plan and asks the safety team which disconnect and reconnect tasks need documented procedures, then enters both in the window plan.
- Before the stock build starts: planning runs the stock build on the planned curve and on one two weeks slower, and the supply chain manager signs off the larger figure.
Fabrico's part in a line relocation
Fabrico measures the line on both sites, so the baseline weeks and the restart weeks come from one record.
- Same source on both sites: OEE comes from the machine itself, through the PLC on automated equipment or, on older machines, an IoT device with external sensors.
- Restart weeks beside baseline weeks: availability, performance and quality per machine, and stops split by cause, shift and machine over any past period.
- Restart stops sorted by owner: crews tag stop causes on a tablet or phone at the line, and OEE tracking shows when a drop began, so each loss lands in a row of the owner table.
- Recovery gap against stock cost: Fabrico puts a money value on each loss, so the restart gap can be weighed against the cost of building extra stock.
- Manual packing after the wrapper: at hand-packing stations with no PLC or sensor signal, the camera add-on does the counting. Its video is streamed on request and not stored in Fabrico, and camera add-on stop-reason suggestions are roadmap work.
Weekly figures leave through the REST API, webhooks or Excel/CSV export. More: the solution overview, our OEE software guide, light MES explained, the camera add-on page, and sector pages for food plants, mid-size FMCG sites and the camera add-on on FMCG lines.
What you see: a shift timeline, unclassified time waiting for a reason, and the operator's line-down screen, on sample lines.
Plays from YouTube. Google may set cookies when you press play. Privacy policy.
Questions engineers ask before a line move
How long does a production line relocation take?
It depends on scope: a move within one hall differs from a transfer to another plant. Plan two periods: the downtime window with no output, and the recovery after restart. The weeks in the sample show the method, not a benchmark.
How do you measure OEE before moving a production line?
Measure on the old site over normal weeks, before the stock build. Record availability, performance and quality separately, the top five losses and the product mix, and keep the counting point and stop reason list fixed for the restart.
What counts as back to normal after a line relocation?
Whatever the plant writes down before the line stops, for example each factor less than one point below its baseline for three weeks in a row. In the sample, the move closed after week 8.
How much output is lost after restarting a moved line?
Count baseline good output per week minus good output made, until the gap closes. In the sample, recovery cost 739,151 good packs on top of the two weeks with no output.
Who pays for lost output after a line move?
The contracts and orders decide, so check them with your legal team; this is not legal advice. For planning, name one owner per loss type, such as the internal team, the rigger or installer, or the machine builder.
When should you rebuild a line instead of moving it?
When the top losses on the old site come from worn or outdated machines, because moving them moves the losses. Compare a rebuild with recovering capacity on the existing line first.
Book a demo to see a restart curve set against a baseline period.
Related articles


Latest from our blog





Real Fabrico tiles, sample data.