


 Login
 Blog
Raven.ai Alternatives: OEE and Downtime Tracking for Food and Beverage

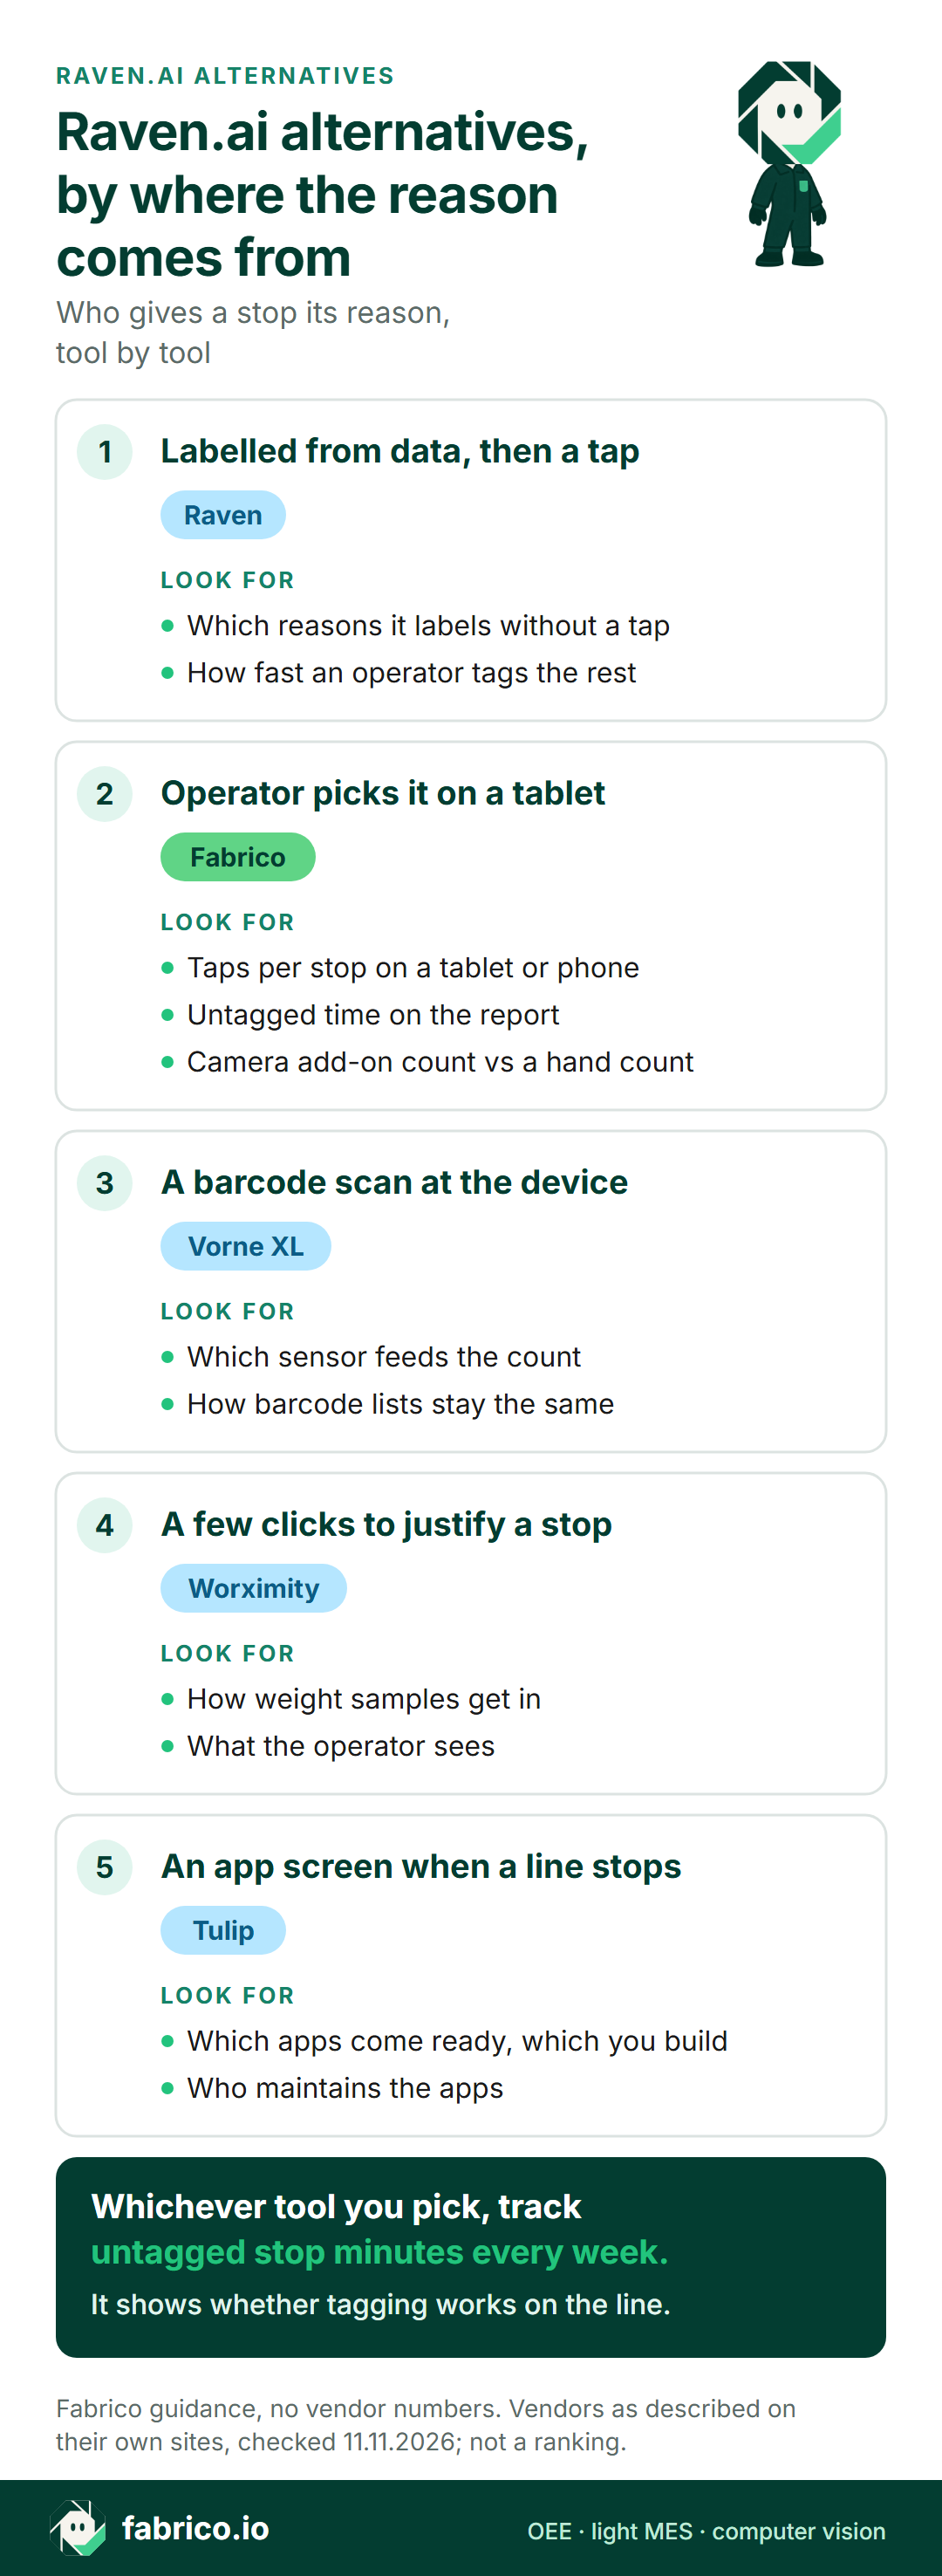
In short: Raven alternatives for food and beverage plants differ mostly in where a stop's start, length and reason come from. Raven labels reasons from machine and system data and asks operators on HMIs for the rest. The alternatives below get the reason in other ways: Fabrico (machine signal for the stop, the operator picks the reason, and a camera add-on that counts where no signal can), Vorne XL (a barcode scan at a standalone device), Worximity (a few clicks to justify a stop, plus giveaway and yield) and Tulip (an operator app that shows a reason screen when a line stops).
- Raven sells OEE and downtime tracking software: Automated Downtime Labeling, Smart Assistants and a Reporting Platform.
- Its food and beverage page covers processing and packaging lines.
- Pick by who gives the stop its reason: machine and system data, an operator tap, a barcode, or an app screen.
- Whatever you pick, measure how much stop time ends up with no reason.
- Each vendor fact is taken from that vendor's site as of 11.11.2026 and linked where it appears; no prices, no verdicts.
Picture a juice line that stops 40 times in a shift. The machine signal shows when the line stopped. Only the operator knows why, and by the end of the shift a quarter of the stop time has no reason at all. Closing that gap is the job of OEE and downtime tracking tools such as Raven.
Below: what Raven (raven.ai) sells according to its own site, and four alternatives that get the reason another way. We make one of the four, Fabrico, so test our claims as you would any vendor's. For a wider field, see our downtime tracking software comparison.
What Raven sells (as of 11.11.2026, per raven.ai)
Raven calls itself an Industry 4.0 technology platform and partner for continuous improvement across frontline operations, on its about page. The site footer names the company Raven Telemetry, and its contact page gives a head office in Ottawa, Canada.
- Automated Downtime Labeling. Raven connects to existing machines, sensors and systems (PLC, ERP, MES), pulls their data into a production timeline and labels downtime reasons, per its OEE software page.
- Operator Smart Assistants. HMIs on the lines, where operators tag downtime with one touch. The homepage says operators are only prompted when the machines don't have the answer, and end-of-line dashboards show teams whether they are winning the shift.
- Supervisor Smart Assistants. Live status of all machines from anywhere, with text and email alerts.
- Reporting Platform. Shift, 24 hour, weekly and monthly reports, plus top loss and Pareto reports, in a browser on desktop or mobile.
- Add-on modules. Ahead or Behind (hourly and shift targets), Changeover (SMED), Interconnected Processes and Forecasted Lot Completion.
- Food and beverage. Its food and beverage page covers processing and packaging lines, with packaging, batch processing and bottling as use cases.
The site also shows customer logos and case studies. Their results are vendor-reported, so we leave them out.
Ask in the demo: which stop reasons Automated Downtime Labeling can read from a typical PLC, and which will still need an operator tap.
When Raven fits your plant
Going by its own pages, Raven is worth a demo if your PLCs and systems already hold much of the stop data, you want operators engaged through HMIs and shift targets, and your CI team wants ranked losses by shift, day and month. The alternatives below get the reason in other ways.
The question that sorts the field: who gives the stop its reason?
A stop record needs three things: when the stop started and how long it lasted, why it happened, and how much the line made around it.
Take start and length from a signal, because people round them and skip the short ones. The reason is the hard part. Some tools read it from machine and system data, others ask the operator, and some do both. See our pages on operator downtime reason entry and automatic downtime tracking.
Comparison table: Raven and four alternatives
Table facts: vendors' own pages, read on 11.11.2026, linked in each section.
| Tool | How stop data gets in, per its site | Where the reason comes from | Also on its site |
|---|---|---|---|
| Raven (for reference) | Machines, sensors and systems (PLC, ERP, MES) | Labelled from data; HMI tap for the rest | Shift targets, alerts, Pareto reports |
| Fabrico | Machine signal (PLC, sensor, counter); camera add-on counts on request | Operator picks it on a tablet or phone | Losses in money; web, iOS, Android |
| Vorne XL | A standalone device wired to a machine sensor | Barcode scanned at the device | Scoreboard in the device |
| Worximity | Its own devices on any machine | Unplanned downtime justified in a few clicks | Giveaway, yield, quality modules |
| Tulip | Machine and PLC data over OPC UA or MQTT; edge devices for older machines | Operator picks a reason code when the line stops | Apps built on its platform; manual line tracking |
Want to see how stops and reasons get recorded on a line like yours? Book a demo and bring your current stop reason list.
Fabrico: machine signal, operator reasons, a camera add-on where no signal counts
Fabrico, the author of this page, is a cloud OEE and light MES platform. Raven and Fabrico do a similar job, and differ in where the reason comes from. For a wider checklist, see our OEE software guide.
Today, per our computer vision add-on page and the MES and OEE overview:
- Signal first. Stops and counts come from the machine signal: a PLC, an add-on sensor or a counter.
- Reasons at the line. The operator picks the reason on a tablet or phone at the line.
- Money, not just minutes: OEE, downtime and losses by line and shift, in a web app and in iOS and Android apps.
- On request: AI cameras, a Fabrico add-on, count output where no usable signal exists, such as a manual case packing station or an old wrapper. With the camera add-on, video for any moment on the shift timeline opens on demand; in the standard setup it is streamed, not stored in Fabrico.
- Exports: a REST API, webhooks, Excel and CSV.
- Roadmap, labelled as such: the camera add-on detecting stops by itself, and proposing the likely reason for the operator to confirm.
- Outside Fabrico: pack inspection and production scheduling. Ask us in the demo how plants run it next to the systems that do those jobs.
One FMCG plant's numbers, with a disclosure first: Ficosota, a Bulgarian maker of hygiene, tissue and household products, is also a Fabrico investor (see the investment announcement). Across 16 lines in Fabrico from June to September 2026, the share of production time with no recorded reason dropped from 3.20% to 0.40%. OEE went from 53.11% to 59.62% in the same period, and monthly good output from 10.49 million to 12.92 million units. The case study covers OEE, output and stop reasons. Read the Ficosota story.
Ask in the demo: how a stop gets its reason when operators are busy, and how the camera add-on's count holds up against a hand tally at a manual station. See how accurate camera OEE is.
Vorne XL: a standalone device with a scoreboard
On Vorne's homepage, the reason comes from a barcode: operators plug a scanner into XL and scan downtime reasons, with the barcodes printed from XL itself. XL is a standalone device with its own I/O, an operator scoreboard and built-in reports. As of 11.11.2026, the site also says:
- The count comes from one or two sensor inputs wired from a photo-eye, relay, proximity switch or encoder on an existing machine.
- Reports for OEE, downtime, TEEP, changeover and top losses open in a browser, with no software to install. XL Enterprise is its cloud part.
- Its food and beverage page lists bakery, beverage, dairy, sauces and condiments, snack food and more among the specialties where XL is used.
Compared with Raven: on XL the reason is a barcode scan at the device. Raven's pages describe reasons labelled from machine and system data, with an HMI tap for the rest.
Ask in the demo: which sensor on each machine gives the cleanest count, and how barcode reason lists stay the same from line to line.
Worximity: a few clicks to justify a stop, plus giveaway and yield
Worximity's measure page says unplanned downtime can be justified in three clicks, and planned stops scheduled into the shifts. Its food and beverage page says it gives food and beverage manufacturers data to fine tune production and the efficiency of machines and people. As of 11.11.2026, its pages also say:
- Its food and beverage clients include meat and poultry plants, dairy processors, beer and spirit producers and bakeries.
- Its own devices collect data on any machine, and it integrates with ERP, MES and CMMS systems (product overview).
- Its Giveaway Module samples weights and units and reports giveaway and process yield KPIs; its Quality Module captures rejects for quality KPIs and OEE (giveaway module).
Compared with Raven: Worximity's pages describe operators justifying unplanned downtime in a few clicks, where Raven's start from labels read from machine and system data. Worximity's pages also describe a Giveaway Module with weight sampling and yield KPIs.
Ask in the demo: how weight samples reach the system, and what an operator sees when asked to justify a stop.
Tulip: operator apps that ask for the reason
Tulip calls itself a frontline operations platform on its homepage. Its OEE tracking page describes a composable platform that connects equipment, enterprise systems and frontline workers. As of 11.11.2026, that page says:
- An operator picks a reason code the moment a line stops, and when a machine faults, Tulip can show a downtime categorization screen at the operator's terminal.
- For availability and performance, the page names machine and PLC data over OPC UA or MQTT, with edge hardware for older machines.
- On manual lines, operators follow guided workflows on a screen, and Tulip records step timing and cycle times. Triggers can send an SMS, email or push alert when a machine goes down.
Compared with Raven: both combine machine states with operator reasons. Tulip's page describes OEE tracking built as apps on its platform. Raven's pages describe Automated Downtime Labeling and Smart Assistants as products.
Ask in the demo: which OEE apps come ready to use, which your team would build, and who maintains them.
Which reason path fits your plant
- Raven fits plants whose PLCs and systems already hold many stop reasons, and that want HMIs and shift targets at the line, per raven.ai.
- Fabrico fits plants whose lines mix PLC machines, old machines and manual packing, and that want losses in money, with the camera add-on counting at manual stations that have no usable signal, per fabrico.io.
- Vorne XL fits plants that want a standalone device with a scoreboard at the line, barcode reasons and a count wired from an existing sensor, per vorne.com.
- Worximity fits plants where giveaway and yield cost as much as stops, per worximity.com.
- Tulip fits plants that want a downtime screen to open at the operator's terminal when a line stops, per tulip.co.
More for food and drink lines: OEE for food and beverage, downtime on food and beverage lines, and where cameras earn their place in food plants, on beverage lines and across FMCG. For signal choices machine by machine, see camera or sensor for OEE, by machine.
Worked example: one shift where a quarter of the stop time has no reason
These are sample figures, invented for this page: one 8 hour shift on a juice bottling line, at an ideal 150 bottles a minute. With 480 planned minutes, the shift could make 72,000 bottles.
The line stopped for 72 minutes, so it ran for 408. Availability is 408 of 480 minutes, or 85.0%.
In 408 minutes the ideal is 61,200 bottles. The filler counted 55,080, so performance is 90.0%. Rejects were 1,102, leaving 53,978 good bottles, so quality is 98.0%. OEE is 85.0% x 90.0% x 98.0% = 75.0%, the same as 53,978 good of 72,000 possible.
Now the reasons. The changeover took 25 minutes, filler jams 14, waiting for bottles 9 and the capper 6. The other 18 minutes, a quarter of all stop time, have no reason.
Ask each tool to show you those 18 minutes. What differs is how many get a reason, and how fast. In a pilot, track untagged stop minutes as a share of all stop minutes every week. If the share does not fall, fix the tagging setup, whatever the software. It often hides in micro-stops.
Seven questions for every vendor, us included
Have each vendor answer them for a real line in your plant, with real shift data.
- Which stop reasons are labelled without a tap? And how often do operators override an automatic label?
- Which reasons come from PLC fault codes, and which from ERP or MES states?
- Who gives the rest, and when? An operator tap, a barcode or an app screen. Time it with gloves on.
- What happens to untagged time? Ask to see it on a report, and how a shift lead fixes it.
- Where does the count come from? A machine counter, a sensor, or a camera at a manual station. Check it against a hand count for one hour.
- How do cleaning and changeovers show? CIP, allergen clean-downs and washdowns are planned stops. Ask how they are kept apart from breakdowns.
- Who sees the data, and where is it kept? Cameras at manual stations see people, so settle any camera add-on setup with your works council before install; our guide to production line cameras without surveillance covers it.
What people ask next
Is Raven OEE software?
Yes, per its site. Raven's homepage calls it OEE and downtime tracking software, and its site lists three products: Automated Downtime Labeling, Smart Assistants for operators and supervisors, and a Reporting Platform.
How does Raven get downtime reasons?
Its site describes two routes: Automated Downtime Labeling, which labels reasons from machine, sensor and system data, and a one-touch tag on an HMI when the machine cannot give the answer.
Does Raven work on food and beverage lines?
Yes, per its site. Raven's food and beverage page covers processing and packaging lines, with packaging, batch processing and bottling as use cases.
How is Fabrico different from Raven?
In Fabrico, stops and counts come from the machine signal, the operator adds the reason on a tablet or phone, and losses are shown in money by line and shift. With the AI camera add-on, on request, cameras count output where no machine signal exists. Stop detection by the camera add-on is on the roadmap, not live.
Can we keep our HMIs and still change the OEE tool?
Often, yes. Ask each vendor whether it reads the PLC behind the HMI or a sensor on the machine, and where operators enter the stop reason.
Want to see how Fabrico records stops, reasons and counts on a line like yours? Book a demo or contact us.
Related articles



Real Fabrico tiles, sample data.