


 Login
 Blog
Computer Vision for Beverage and Bottling Lines: Counts, Stops and OEE

In short: computer vision for beverage and bottling lines works best next to the filler PLC, not instead of it. The filler counts bottles and logs stops. AI cameras count packs, cases and pallets, and let you open the video for the minute behind a stop.
- Keep two jobs apart. Inspection vision rejects bad containers: fill level, caps, labels, codes. An OEE camera counts output, and its video lets you see where a stop started.
- Read line OEE at the filler, the constraint. Charge starved and blocked minutes to the machine that stopped first.
- At hundreds or thousands of containers a minute, the filler PLC is the counter. Cameras earn their place at the labeler, wrapper, case packer, palletizer and manual stations.
- Fabrico logs stops from the machine signal and the operator adds the reason. Its AI camera add-on counts output, with video for any minute of the shift.
A beverage line is built around one machine. The filler sets the pace, the machines around it run faster, and accumulation tables soak up the short stops in between.
That design decides where a camera pays and where it is wasted. This page is for managers choosing software to put cameras on bottling and canning lines and measure OEE.
We sell Fabrico, so test what we say here like any other vendor's claims.
Computer vision for beverage lines: two jobs, two systems
Machine vision in the beverage industry usually means inspection. A fill level inspector rejects a low fill. A cap or label inspector rejects a crooked cap or a missing label. A code reader checks the date code. These systems come from inspection makers such as Heuft or FT System, from line builders such as Krones, and from machine vision firms such as Cognex or Keyence. They act on every container.
An OEE camera has a different job. It counts output, and it gives you a view of the line for the minute a stop happened.
| Job | Inspection vision | OEE camera |
|---|---|---|
| Check fill level, caps, labels, codes | Yes, every container | No |
| Reject a bad container | Yes | No |
| Count packs, cases and pallets | Not its job | Yes, where no signal counts well |
| Log when a stop starts and ends | No | No, the machine signal does |
| Show the minute a stop started | No | Yes, open the video for that minute |
| Feed OEE | Reject count, for Quality | Counts, for Performance and Quality |
The two sit side by side. The inspector's reject count, or a reject signal from it, feeds the Quality part of OEE. The camera counts what reaches the end of the line. Most lines need both. Our page on label and code vision vs an OEE camera goes deeper.
Fabrico does not sell inspection: buy that from an inspection vendor and bring its reject signal into OEE.
Where beverage lines lose time
Bottling and canning lines are usually built on the V-curve. A V-curve guide from LineView, a line performance software vendor, says to set the two machines either side of the critical machine "10% faster in recovery speed", and each machine further out faster again. On most beverage lines the critical machine is the filler.
The same guide notes the catch: only the critical machine runs at a steady speed, and every other machine stops often, starved of containers or backed up by them. The filler sets the line's pace, so a minute lost there is output the line never gets back. Our guide to filler OEE on a bottling line covers the filler's own states.
That leaves four places where minutes hide:
- Blocked and starved time. A film break at the wrapper fills the table, then the labeler stops, then the filler. The filler PLC logs "blocked". It does not say which machine started it. See starvation and blocking.
- Short stops downstream. Labeler splices, bottles down in a wrapper lane and case jams are short. The table hides them until enough of them in a row block the filler.
- CIP and product changeovers. A flavor change, a size change and a full CIP are three different stops with three standard times. Code them apart, and never shorten a validated CIP to win OEE points. See our beverage filling line downtime codes and CIP time in OEE.
- Waiting for product. When the syrup room or the mixer is behind, the filler stops with nothing wrong with it.
The minutes add up. In a 2021 benchmark commissioned by the software vendor OFS and reported by Brewers Journal, craft brewers were filling cans or bottles only 54% of the time. The average brewer could not run the line longer than 12 minutes without a stop, and a changeover from one beer to another took over 49 minutes on average. The article gives no sample size, and craft lines are smaller than most bottling plants, so read it as a sign of where minutes go, not a target for your line. See OEE for brewery packaging lines.
The Siemens True Cost of Downtime 2024 report, a survey of large industrial firms in four sectors, puts an hour of unplanned downtime at $36,000 in fast moving consumer goods, the lowest of the four. FMCG was also the only one of the four where downtime hours had not fallen since 2019. Those are survey figures from large firms, not a price for your line.
Glass, PET and cans: the camera moves with the container
- PET. The blow molder feeds the filler through a short air conveyor, or directly in a blow-fill block, where a stop at one machine stops both. Light empties tip at transfers and at the air conveyor exit, and the PLC sees "running" or nothing at all. Our bottled water line page shows three camera views worth opening.
- Glass. Heavier and breakable. One-way glass starts at a depalletizer and a rinser. Returnable glass adds an unpacker, a bottle washer and an empty bottle inspector, and each of them can starve the filler. A burst bottle at the filler means a stop to clear the glass.
- Cans. The fastest of the three. KHS's product page for its Innofill Can DVD filler gives up to 135,000 cans an hour, which is 2,250 a minute, or more than 37 a second. At that speed the filler and seamer PLC is the counter. A camera pays off further down, where cans become packs and trays.
For carbonated lines, see OEE for carbonated soft drink lines.
Where a camera goes on a bottling line
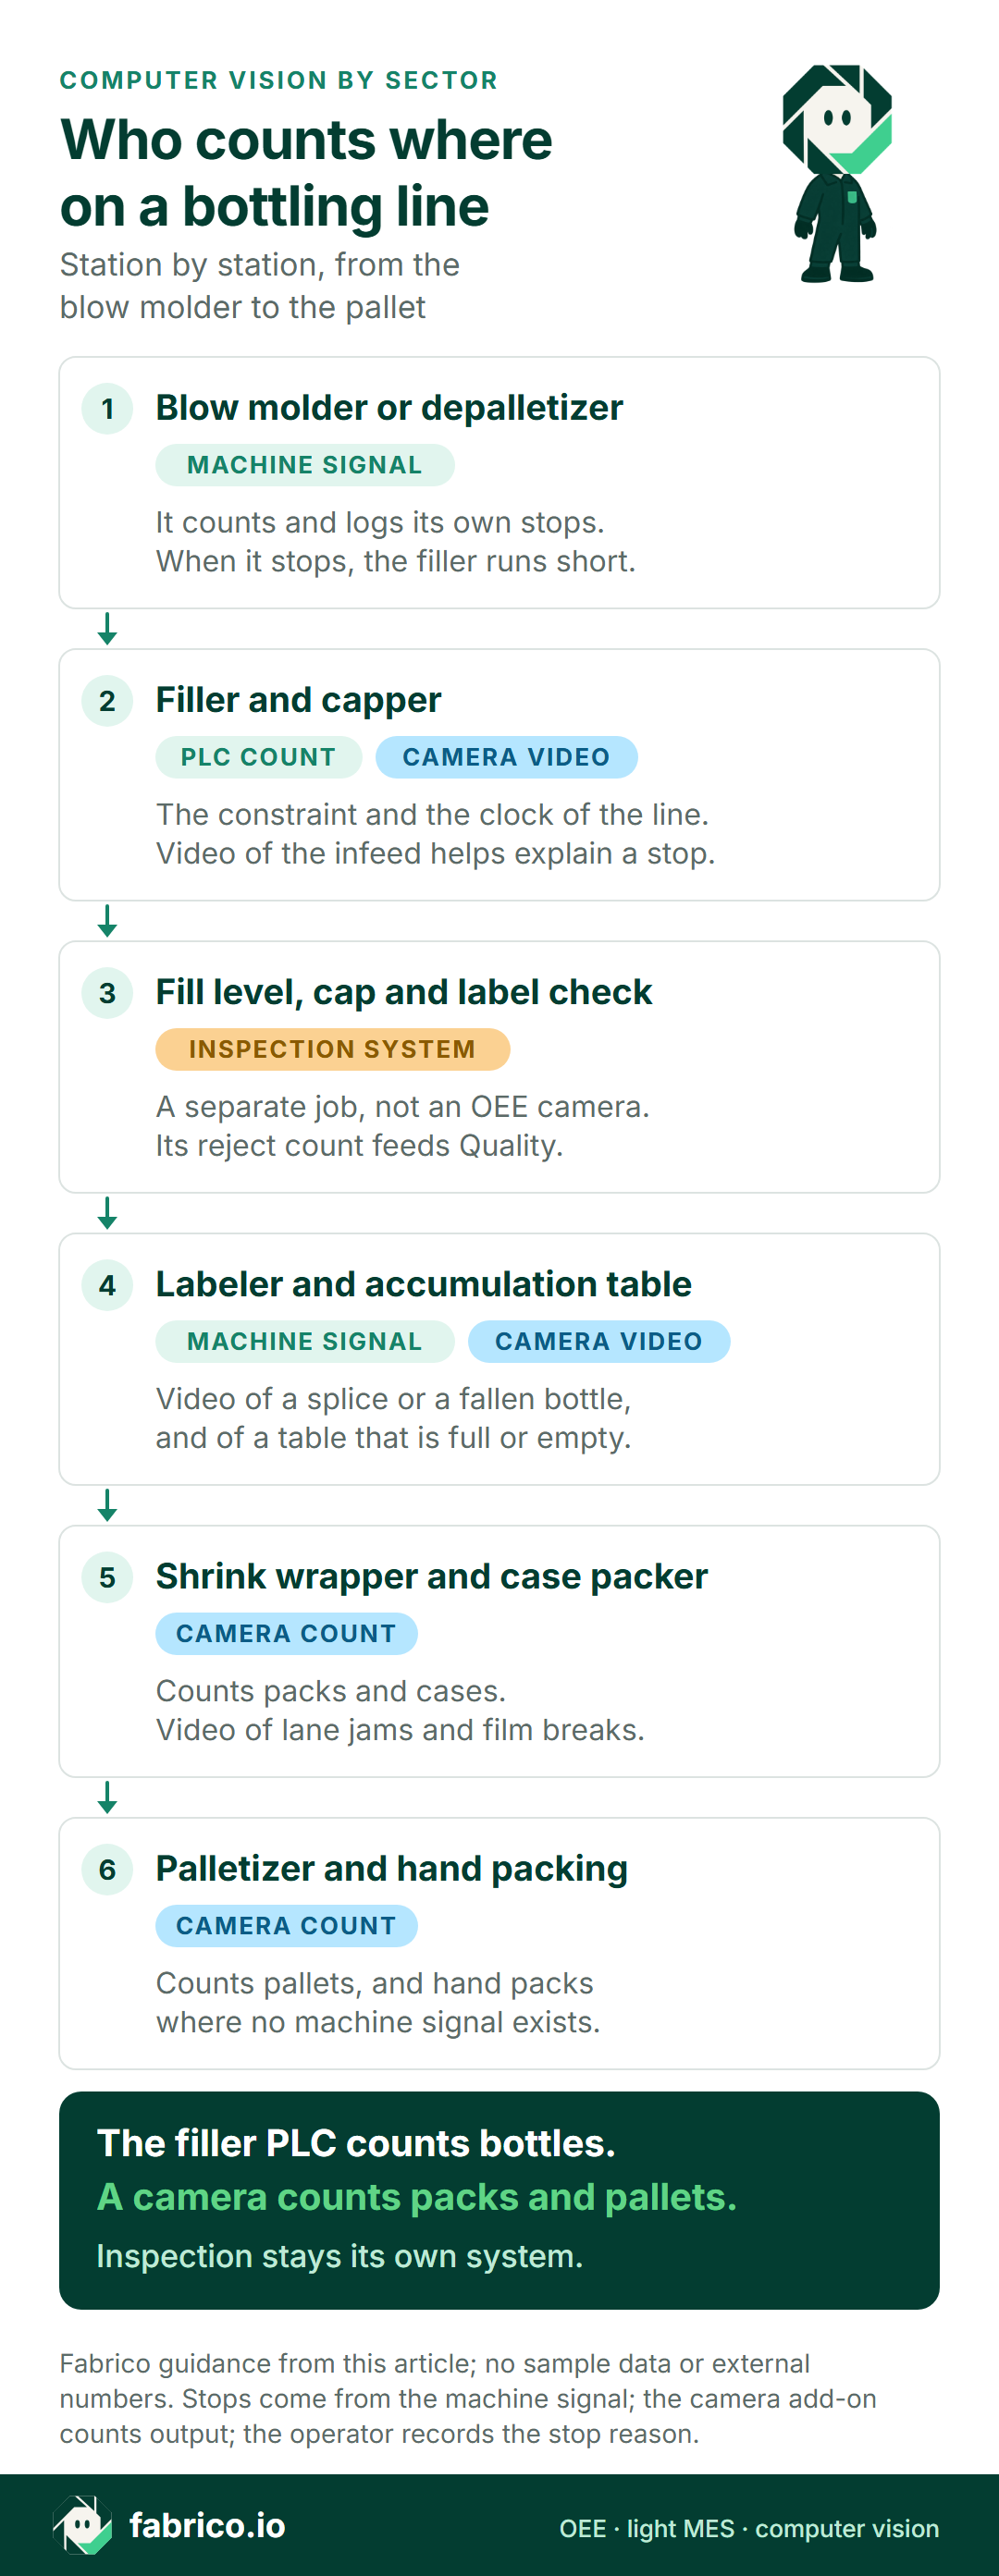
Here is a typical PET line from the blow molder to the pallet, with the source of each count, to plan AI camera monitoring on a bottling line. Your own line list decides.
The filler PLC is the clock of the line. The camera is a second look where the PLC says least: between machines, at the end of the line, and wherever people pack by hand. For the filler infeed itself, read camera on a filling line. For the end of the line, read palletizer downtime with a camera and case packer downtime.
Camera, sensor or both: station by station
Use this as a start for your own line list, and ask each vendor to fill in the same table.
| Station | Count from | What a camera adds |
|---|---|---|
| Blow molder or depalletizer | Machine signal | Little, unless empties tip at the transfer |
| Filler and capper | Filler PLC | Video of the infeed for a stop, not the count |
| Fill and cap inspection | The inspector's reject signal | Nothing: that is the inspector's job |
| Labeler | Labeler signal or a sensor | Video of a splice, a glue skip or a fallen bottle |
| Accumulation table | Photo eyes for full and low | Video: full or empty, so which side stopped |
| Shrink wrapper or case packer | Camera, or the machine count if it is reliable | Video of lane jams and film breaks |
| Palletizer | Camera at the infeed, or the machine's pallet count | Video of pallet supply and the pallet magazine |
| Manual packing and rework | Often nothing | A count where no signal exists |
Count each machine in its own unit: bottles at the filler, packs at the wrapper, cases at the packer, pallets at the end. Convert to filler bottles only when you add machines up. Our page on OEE units: bottles, cases and pallets shows the arithmetic, and camera or sensor, machine by machine covers other machine types.
Want to see camera counts and filler stops on one timeline? Book a demo and bring your line list.
Worked example: one shift on a sample PET line
Sample line, illustrative numbers, not a customer: a 0.5 liter PET line with the filler and capper rated at 400 bottles a minute for this format. The shrink wrapper makes packs of 6, and a pallet holds 90 packs.
The shift is 480 minutes. The plant takes its scheduled 30 minute CIP out of planned time, so planned production time is 450 minutes. The accumulation held the same number of bottles at the start and the end of the shift.
| Stage | Count | Source |
|---|---|---|
| Filler | 148,200 bottles | Filler PLC |
| Fill and cap inspection | 1,200 rejected | Reject signal |
| Palletizer infeed | 24,300 packs, or 145,800 bottles | Camera count |
| End of line | 270 pallets | Camera count |
| Lost after inspection | 1,200 bottles | Worked out |
The filler PLC logged 60 stopped minutes: 14 from its own faults, 10 starved and 36 blocked. So run time was 390 minutes.
- Availability = 390 / 450 = 86.7%.
- Performance = 148,200 / (390 x 400) = 148,200 / 156,000 = 95.0%.
- Quality = 145,800 / 148,200 = 98.4%, with good output counted as packs at the end of the line.
- OEE = 0.867 x 0.950 x 0.984 = 81.0%.
The short way gives the same answer. 145,800 good bottles at 400 a minute are 364.5 minutes of good time, and 364.5 of 450 is 81.0%. The speed loss is 7,800 bottles, or 19.5 filler minutes. The quality loss is 2,400 bottles, or 6 minutes.
What the camera added to the number:
- The real good count. Filler count minus rejects says 147,000 good bottles and 81.7% OEE. The pack count says 145,800. The 1,200 bottles in between went down at transfers, in wrapper lanes or in damaged packs. Without a count at the end, that loss never shows.
- An owner for the blocked minutes. The operators added the reasons and opened the wrapper and palletizer video where unsure: 20 minutes of film breaks and reel changes, 10 of an empty pallet magazine, 6 of bottles down in wrapper lanes. The filler's own availability is (450 minus 14) / 450 = 96.9%.
- A size for each loss. The 36 blocked minutes are 14,400 bottles the filler could have made. Ranked by filler minutes, the wrapper comes first.
Questions to ask any vendor before you buy
Run these with every vendor, us included, on one real shift from last week.
| Ask | How to test the answer |
|---|---|
| Where does each count come from? | Ask to see filler PLC counts and camera counts on one timeline, for the same minute. |
| Who gets the blocked minutes? | Take one real wrapper stop. Ask if the report charges it to the wrapper or to the filler. |
| Is the rated speed set per format? | A 0.5 liter and a 1.5 liter bottle on the same PET line do not fill at one rate. Ask how a format change updates it. |
| How are CIP and changeovers coded? | Ask to see flavor changes, size changes and CIP apart, each with its standard time. |
| Can the camera count at your speed and light? | Ask for a count test against a known number, with clear PET, glare off shrink film and wet lenses near the rinser. |
| Where does the video go? | Ask if it is stored or streamed, who can open it, and for how long. |
| Can inspection rejects come in? | Ask how the inspector's reject count or signal reaches Quality. |
| What is live and what is roadmap? | Ask to see each claim on a working line, not on a slide. |
Before the count test, read how accurate camera OEE is. For a wider shortlist, start with our OEE software guide, and settle early whether you need a full MES or a light MES. Plants with a syrup room also need batch, lot and recipe records: see MES for beverage manufacturing.
Cameras on the bottles, not on the people
Frame the bottle path, not the walkways. Keep faces out of the frame, and report OEE by line and shift, never by named operator. The video can defend a crew: it shows a film break or a bottle down in a lane, not a "slow" person.
In Germany, section 87 of the Works Constitution Act gives the works council a say on "the introduction and use of technical devices designed to monitor the behaviour or performance of the employees". Treat any camera in the hall as in scope, and agree in writing who can open the video and why before the first camera goes up. Our guide to production line cameras without surveillance covers the steps.
How Fabrico does it on beverage lines
Fabrico is a cloud OEE and light MES platform. Here is what it does today, and what it does not.
- Stops: they come from the machine signal, such as the filler PLC, a sensor or a counter. The operator adds the reason at the line, on a tablet or a phone.
- OEE and losses: OEE, downtime and losses by line and shift, with losses shown in money. On the web, iOS and Android.
- Cameras, on request: AI cameras count output on the line, including at manual stations and at machines with no usable signal. You can open the camera video for any moment on the shift timeline. In the standard setup, the video is streamed on request, not stored in Fabrico.
- Your data: it leaves through a REST API, webhooks and Excel or CSV export.
- Roadmap, not live today: stops detected by the camera, jam zones, and a camera that suggests a stop reason. Judge us on what runs today.
- Not Fabrico: inspection. Fill level, cap, label and code checks stay with your inspection system, and its reject count can feed Quality. For production planning, ask us in the demo.
Start with one line, a baseline and a decision date agreed in advance. The computer vision for OEE and MES page shows how camera counts and machine data share one timeline.
Book a demo and bring one filler's stop log from last week.
What people ask next
Can a camera count bottles at full filler speed?
At hundreds or thousands of containers a minute, the filler PLC and its sensors are the better counter. Cameras fit where units are fewer and bigger: packs, cases, pallets and manual stations. Test any camera count against a known number on your own line.
Is machine vision for beverages the same as an OEE camera?
No. Inspection vision checks every container for fill level, caps, labels and codes, and rejects the bad ones. An OEE camera counts output and lets you open the video for a stop. Most lines need both.
Does the camera tell us why the filler stopped?
Not today. The machine signal logs the stop and the operator adds the reason. The operator can open the camera video for that minute to check. A camera that suggests a reason is on Fabrico's roadmap.
Should starved and blocked minutes count against the filler?
Keep them in line OEE, because the line lost that output. Then charge them to the machine that stopped first, such as the blow molder, the wrapper or the palletizer.
Do glass, PET and can lines need different camera setups?
Yes. On PET, watch the transfers after the blow molder. On returnable glass, the washer and the empty bottle inspector add stops up front. On cans, the filler and seamer count, so cameras go where cans become packs.
What drives the cost of cameras on a beverage line?
Fabrico does not publish prices. The quote depends on the number of lines and cameras, mounting, network and training. Give every vendor the same line list, so the quotes compare.
Want to see it on your line? Book a demo.
Related articles



Real Fabrico tiles, sample data.