


 Login
 Blog
OEE Software: How It Works, the 5 Categories and How to Choose (2026)
TL;DR
OEE software measures how much of the planned production time your lines spend making good parts at full speed, and shows where the rest went. It takes counts and stops from the machines, splits the loss into availability, performance and quality, and ranks the stop reasons behind it, live, by line and shift.
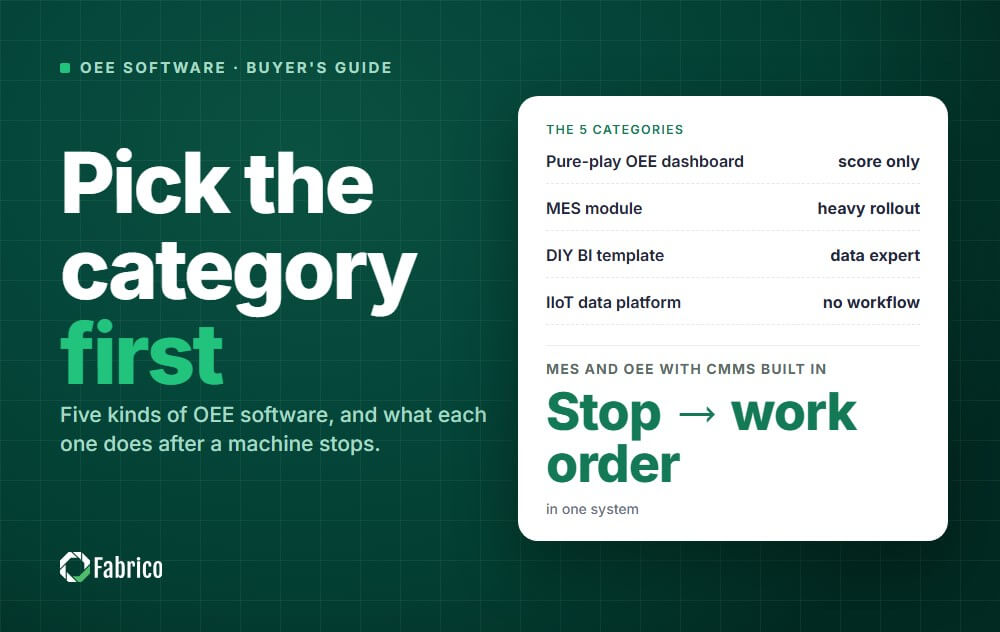
Choose the category before the features: a pure-play dashboard, an MES module, a DIY BI template, an IIoT data platform, or an MES and OEE platform. Below: what OEE software does on the shop floor, how the calculation works, who uses it, an OEE software comparison checklist and the 5 categories compared.
- Categories range from simple dashboards that only diagnose problems to massive MES platforms that are often too complex and expensive for most manufacturers.
- Then compare vendors by where their data comes from: PLC, add-on sensor, camera or a mix.
- Prove the choice with a pilot on one line: live data, a baseline OEE, and the top 3 losses by stop reason.
See our roundup of manufacturing analytics software.
Best OEE software for UK manufacturers
Five OEE software tools worth comparing for a UK plant are Fabrico, FourJaw, MachineMetrics, Tulip and TeepTrak. Fabrico is a cloud-based OEE and light MES platform with maintenance built in, FourJaw is the one based in the UK, in Sheffield, and the right choice for your plant depends on where your machine data comes from and what has to happen after a stop.
This table summarises each vendor's own site. Something missing from a site says nothing about what a product can do, so ask each vendor directly.
| Vendor | What its own site says | Source, checked 4 November 2026 |
|---|---|---|
| Fabrico | Based in: Sofia, Bulgaria (EU) Machine data: the PLC (OPC UA, Modbus, PROFINET and others), a Fabrico IoT device with sensors on older machines, or AI cameras (an add-on) where there is no machine signal Several plants: a group view of all plants, with cross-plant reports | Machine connectivity, multi-site |
| FourJaw | Based in: Sheffield, UK; founded in 2020 as a spinout from the University of Sheffield's AMRC Machine data: its own plug-and-play Machinelink hardware, a sensor clipped around a cable, without needing access to the machine PLC Several plants: every machine, shift, line and site from one connected system | fourjaw.com, About, hardware, home |
| MachineMetrics | Based in: Northampton, Massachusetts, USA Machine data: a direct connection to machine controllers; older equipment through sensors and IO adapters Several plants: performance across every plant in one live view | machinemetrics.com, Contact, Connect, multi-site |
| Tulip | Based in: Somerville, Massachusetts, USA, with offices in Munich, Budapest, Singapore, Tel Aviv and Tokyo Machine data: no-code apps; native OPC UA and MQTT connections; edge devices for machines and sensors Several plants: scale across lines and sites, with the instance segmented by site | tulip.co, About, OEE tracking, edge devices, scalability |
| TeepTrak | Based in: Paris, France, with a sales office in Chicago Machine data: plug-and-play sensors; a PLC signal, an external sensor or OPC UA; operators tag the cause on a workstation tablet Several plants: multi-plant dashboards | teeptrak.com, About, PerfTrak, home |
What to check before you choose
Where your data sits. Ask each vendor which hosting region your plant's data goes to and which certificates cover it. EU customers are hosted on AWS in Frankfurt. Fabrico holds ISO/IEC 27001, ISO 9001 and ISO/IEC 20000-1, and signs a data processing agreement under GDPR. For a plant in the UK, ask the Fabrico consultant where your data would be hosted. More on security and data protection.
How each machine connects. A plant with machines of different ages often needs more than one route. Fabrico reads the PLC where there is one, fits a Fabrico IoT device with external sensors on older machines, and uses AI cameras (an add-on) on manual stations. See machine connectivity.
What happens after a stop. OEE shows where time goes; someone still has to fix the cause. In Fabrico, maintenance is built in, on the same machine data, so the stop and the repair sit in one system. MachineMetrics feeds a CMMS to create work orders, with pre-built Fiix and MaintainX integrations (source). TeepTrak's stop events and machine signals can feed a CMMS (source).
Several plants. If you run more than one site, check that every plant measures stops and losses the same way before you compare them. Fabrico gives head office a group view of all plants while each site keeps its own control. See multi-site management.
How you start. TeepTrak runs a 90-day guided pilot on one line (source). MachineMetrics offers a demo (source), and FourJaw a demo with its sales team (source). Fabrico starts with a demo with a Fabrico consultant.
See OEE by line and shift in Fabrico, with stops by cause and what each loss costs. Book a demo or contact us.
What you see: a shift timeline, unclassified time waiting for a reason, and the operator's line-down screen, on sample lines. Book a demo.
Plays from YouTube. Google may set cookies when you press play. Privacy policy.
What OEE software does on the shop floor
- Calculates OEE live for every line and shift from machine data, not from figures typed in after the shift.
- Shows which factor is pulling the score down: availability (stops and changeovers), performance (slow cycles and micro-stops) or quality (scrap and rework).
- Explains the loss with stop reasons tagged at the line, so a low score comes with its causes.
- Compares lines, shifts and products on the same definition, so the morning meeting argues about fixes, not about numbers.
How OEE is calculated in Fabrico
OEE = Availability x Performance x Quality, consistent with ISO 22400: good output divided by the maximum output possible in the scheduled time.
- Availability = run time divided by planned production time. Changeovers count as lost time.
- Performance = units made during run time divided by what the ideal rate allows in that run time. It uses run time, not planned time, so a stop is never counted twice.
- Quality = good units divided by all units made, with scrap and rework recorded by reason.
- Next to OEE, Fabrico shows production achievement (good output against the plan) for planners and TEEP over the full 24 hours.
For worked numbers, see our OEE calculation examples.
The screens behind the number
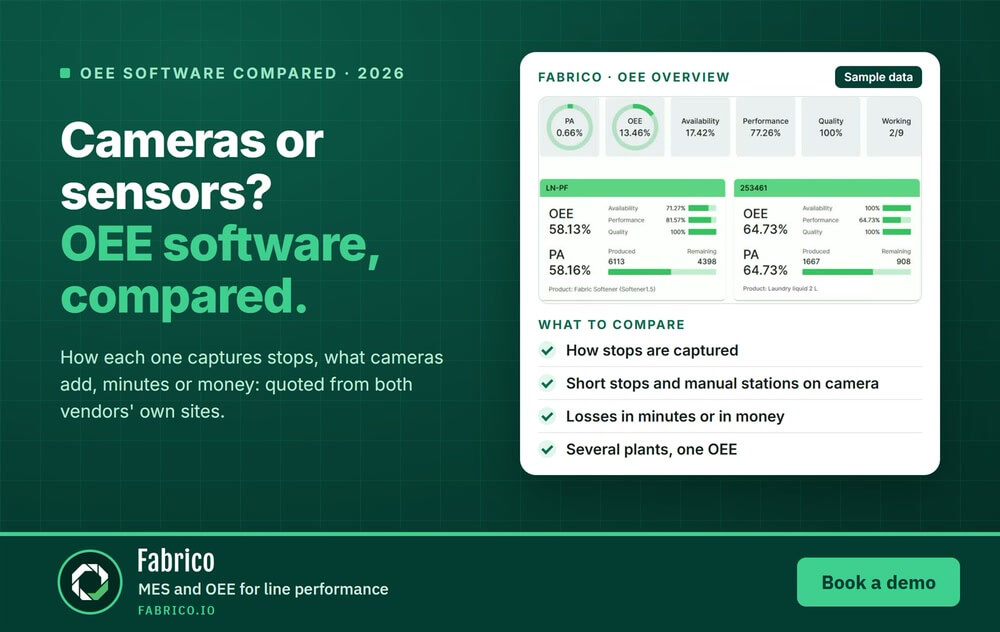
- Overview: one card per line with status, OEE, availability, performance and quality bars, and produced against remaining.
- Production line: the shift in hourly rows of actual against target, each stop coloured by type, with buttons for a stop reason, a changeover, waste or a task.
- TV status screen: the same line status and OEE, large enough to read from across the line.
- OEE analytics: OEE, availability, performance and quality over time, the top 10 unplanned and planned stop reasons and waste by reason, split by hour, shift, day, week or month.
Fabrico is a light MES, so the same data also gives you production monitoring and downtime tracking, with maintenance built in as a complement. See it in a live demo or contact us.
Who uses OEE software
- Plant and production managers track OEE by line and shift against target and critical levels.
- Shift leads see when the score drops during the shift and why.
- Continuous improvement engineers pick projects from the biggest loss and check the result in the same data.
- Operations and group leaders compare plants on one OEE definition.
How to compare OEE software vendors side by side
Feature lists look alike from one vendor to the next, so compare how each product handles the same situations. These steps keep the comparison fair.
Shortlist by category. Use the five categories below to drop the tools that cannot reach your goal, then compare only what is left.
Run the same demo script. Ask every vendor to show a micro-stop, a changeover, a breakdown that needs a technician and a manual station with no machine signal.
Score right after each demo. Rate every vendor on the four questions below with the same weights, before the next demo blurs the details.
Watch for red flags. OEE shown as one number, not split into availability, performance and quality; stop reasons entered only after the shift; reports that only work in a spreadsheet.
Ask what is live today. In Fabrico, for example, the AI Assistant answers questions from manuals and maintenance history today, while the AI Agent is planned and production planning is on the roadmap.
Call a reference with similar lines. Ask how long setup took, whether operators kept tagging stop reasons after the first weeks and what they would do differently.
Use the checklist below as your OEE software comparison sheet: one row per check, one column per vendor, all scored in the same demo week.
OEE software comparison checklist
| Check | Ask or test in the demo | A good answer | Why it matters |
|---|---|---|---|
| Category | Which of the five categories is the product? | One clear answer that matches your goal | Drops tools that cannot reach it |
| Data per machine | How each machine on the pilot line reports run, stop and count | A named method for every machine, old ones included | Gaps become hand-typed data |
| Micro-stops | The shortest stop it records, and where the threshold is set | A threshold per machine; short stops as their own events | Short stops hide in performance loss |
| OEE math | Calculate one shift by hand from the raw events | Availability, performance and quality match the screen | Two tools can give one shift two OEEs |
| Stop reasons | An operator tags a stop at the line, without help | Done in seconds, in the operator's language | No reasons, no Pareto |
| After the stop | How a breakdown reaches maintenance | A task or work order from the stop, no retyping | The cure sits in the same record |
| Several plants | Whether every site uses one OEE definition | One definition and a group view | Plant rankings stay fair |
| Data exit | API, export and what happens to data if you leave | An API, a full export and a written exit clause | History stays yours |
| Hosting | Hosting region and certificates, in writing | A named region and certificates | IT signs off faster |
| Pricing unit | Per machine, line, interface, user or site, and the price of the next line | A full pilot quote plus the cost of each extra line | The unit decides how the bill grows |
| Live or roadmap | Which features in the demo are live today | A written list for your pilot line | Roadmap slides are not features |
How pricing units differ, from published pricing pages (accessed 16.11.2026): Tulip lists $100 or $250 per interface a month, billed annually, with a 10-interface minimum. Factbird lists Production Insights from $399 per line a month and a platform fee from $1,000 per site a month. Symestic lists its Professional plan from $11,400 a year with 5 machines. MachineMetrics quotes after a demo and says its pricing is volume based. The same 4-line plant is billed by interfaces, lines, machines or volume, so ask every vendor to price one identical line list.
Worked example: what one 4-line plant pays in year one. Take 4 lines with 2 machines each (8 machines) and one operator screen per line, priced from the list prices above. Tulip Professional, the plan that connects to machines and devices, bills the 10-interface minimum even for 4 screens: 10 x $250 x 12 = $30,000. Factbird bills Production Insights at 4 lines x $399 x 12 = $19,152, plus the Factbird Platform at $1,000 x 12 = $12,000, so $31,152. Symestic Professional includes 5 machines for $11,400 and adds the other 3 at $816 each: $11,400 + $2,448 = $13,848. The same plant lands between $13,848 and $31,152 a year, about 2.2 times apart, before sensors, gateways, setup and integration. MachineMetrics prices it after a demo. List prices cover the subscription, not the project, so ask each vendor what its plan includes.
Our guide to OEE software pricing works the totals through, and what happens to your OEE data if you change vendor covers the exit row.
To keep demo scores honest across vendors, use the method for comparing OEE software demos fairly.
For a worked example of a side-by-side comparison, built from both vendors' own words, read Fabrico vs TeepTrak.
The 5 Categories of OEE Software Solutions
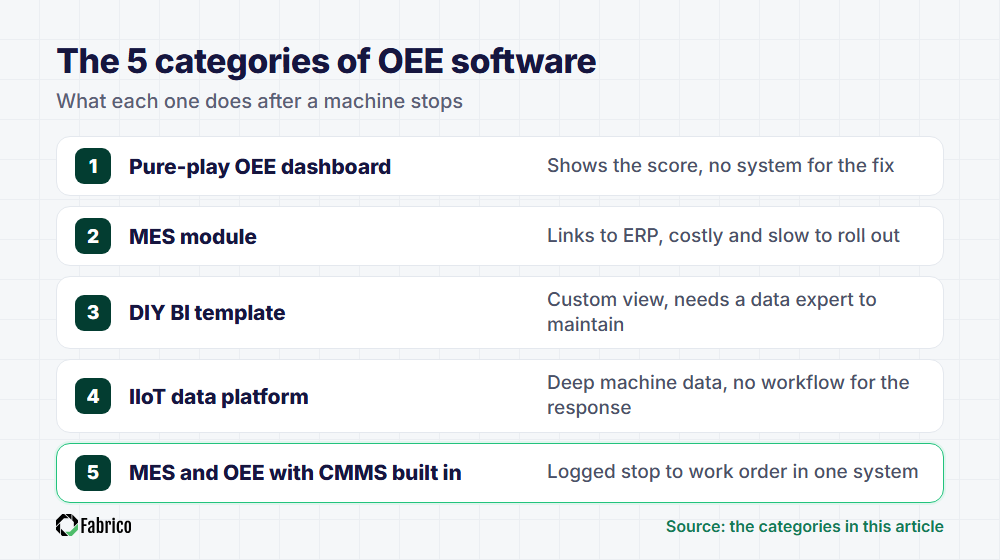
The "best" software is the one whose philosophy matches your goal. Let's break the market down into the 5 distinct categories to find the right fit.
Category 1: The Pure-Play OEE Dashboard
The Philosophy: "What gets measured gets managed." These tools are laser-focused on one thing: calculating and visualizing your OEE score in real-time.
Pros: They are often very good at data visualization and can be simple to set up.
Cons: This is the classic "fish tank." It's a diagnostic tool only. It's excellent at showing you that you're losing, but it offers no integrated system to help you manage the cure.
Category 2: The MES Module
The Philosophy: "OEE is one small part of a massive, all-in-one system for running the entire enterprise."
Pros: These systems can integrate OEE data with other massive functions like ERP and supply chain management.
Cons: They are expensive, and a full rollout often takes many months. They are often notoriously complex and difficult for frontline teams to use.
It's like buying an entire airport just because you need a single plane ticket.
Category 3: The DIY BI Tool Template
The Philosophy: "We can build it ourselves." This approach involves using general business intelligence tools like Tableau or Power BI to build a custom OEE dashboard.
Pros: The dashboard can be customized to your exact specifications.
Cons: This is a trap for most companies. It requires a data expert to build and maintain, is rarely truly real-time, and needs its own process to turn a number into action.
Category 4: The IIoT Data Platform
The Philosophy: "It's all about the data." These platforms are experts at connecting to machines (the Industrial Internet of Things) and pulling vast amounts of raw data.
Pros: They are excellent for deep, granular data analysis by engineers looking to optimize machine performance at a technical level.
Cons: These platforms are often technical, and they can leave manager dashboards and the follow-up after a stop to other tools.
Category 5: The MES and OEE Platform with CMMS Built In
The Philosophy: "The diagnosis and the cure must be in the same system."
Pros: This is the category that provides a complete solution, from detection to repair. It connects the real-time OEE diagnosis (a machine is down) to the maintenance cure (a technician opens a work order from that stop) in a single, user-friendly platform.
It is designed for action, not just analysis.
Cons: It is a light MES, less complex than a full MES, which makes it unsuitable for large enterprises that require deep financial ERP integration directly within the same platform.
At a Glance: Which OEE Software Category is Right for You?
The choice becomes clear when you focus on the ultimate goal: turning insights into action.
| Category | Connects to the cure? | Ease of use, setup speed |
|---|---|---|
| Pure-play dashboard | No | High, fast |
| MES module | Partly | Very low, very slow |
| DIY BI tool | No | Low, slow |
| IIoT platform | No | Medium, medium |
| OEE platform with CMMS built in | Yes | High, fast |
OEE software vendors, by data source
Categories narrow the list. The next question is where each vendor's data comes from, because that decides how much setup each of your machines needs.
This table summarises each vendor's own site. Something missing from a site says nothing about what a product can do, so ask each vendor directly.
| Vendor | Data sources named on its site | Source, checked 3 November 2026 |
|---|---|---|
| Fabrico | PLC, an IoT device with external sensors, AI cameras (an add-on) where there is no machine signal. Operators tag the cause. | Machine connectivity |
| TeepTrak | A PLC signal, an external sensor or OPC UA, with a workstation tablet for stop causes. | teeptrak.com, PerfTrak |
| Factbird | Plug-and-play devices and sensors, PLC integration, OPC UA, and a vision system called Factbird VIEW. | factbird.com |
| Vorne XL | Sensor inputs wired from an existing photo-eye, relay, proximity switch or encoder, and a barcode scanner for stop reasons. | vorne.com |
| MachineMetrics | CNC controls by brand, MTConnect, OPC UA and Modbus; IIoT gateways, I/O modules, sensors and PLCs for other equipment. | machinemetrics.com, protocols |
| Worximity | TileConnect by dry contact cable, or a machine signal from a PLC, an API or a photoelectric sensor. | worximity.com, FAQ |
| Redzone | Existing machines, ERP and SCADA through an API or IoT sensors. | rzsoftware.com, food and beverage |
Fabrico is a cloud-based MES and OEE platform. Maintenance is a side note here: it is built in, and a stoppage reason can be configured to open a maintenance task automatically.
Four questions to shortlist OEE software vendors
Once you know which category fits, compare the vendors on your shortlist with the same questions. Ask each one to answer for a real line in your plant, not for a demo data set.
Four questions sort a long list into a shortlist fast. The full 10-criteria scorecard, a worked OEE check on one shift and the ROI method are in our guide on how to evaluate OEE software.
| Criterion | What to ask | Why it matters |
|---|---|---|
| Data capture | Can it read PLC signals, add sensors to old machines and cover manual lines? | One method rarely fits every machine. |
| Time to first data | How long until one line shows live data, and who does the work? | Until then, losses are still counted by hand. |
| OEE math | Can it show the math behind each OEE number? | Two tools can give the same shift a different OEE. |
| Total cost | What does the first year cost in full, with hardware, setup and training? | The license is only one part of the total. |
For a fair cost comparison, ask every vendor for a written quote that covers one pilot line end to end, plus the price of each extra line. Our guide to OEE software price and pricing models explains what drives the total.
Three ways OEE software gets machine data
The data source decides how complete the stop list is and how much setup each machine needs. Many plants need more than one source to cover every line.
| Method | Best for | Watch for |
|---|---|---|
| PLC and machine signals | Machines whose PLC already reports run state and part counts | Old or locked PLCs may need extra setup work, and a run signal shows that a machine stopped, not always why. |
| Add-on IoT sensors | Older machines with no usable PLC | A sensor reads a simple signal, such as power draw or a part count, so the operator still adds the stop reason. |
| AI cameras | Manual and hybrid lines with no machine signal to read | Each camera needs a clear view of the work area, and the team should know what is recorded and why. |
Ask whether all three sources feed the same stop list and the same OEE, so a PLC line and a manual station can be compared in one report. In Fabrico's downtime tracking software, stops are logged automatically from the PLC or an IoT sensor, AI cameras (an add-on) count output where there is no machine signal, and the operator tags the cause on a tablet.
For five tools side by side, see our comparison of machine downtime tracking software.
AI cameras (an add-on) count parts where there is no machine signal, including manual and hybrid stations, and you can open the camera video for that minute. See how each connection method works in our machine monitoring software.
Prove it on one line before you scale
Run the pilot on one line, agree the success criteria before it starts and give it enough time to cover every shift and several changeovers.
The week-by-week pilot plan, with the five results a pilot should prove, is in our guide to evaluating OEE software.
With Fabrico, the pilot starts on one line, and every next line reuses its stop-reason list and settings.
Our OEE software shows OEE live by line, machine and shift.
Result from a Fabrico customer:
- Ficosota (also a Fabrico investor): OEE from 53.1% to 59.6% on 16 lines, June to September 2026.
What to test in a demo
- A short stop arriving from a real machine signal, not a sample data set.
- The math from raw events to availability, performance and quality.
- A changeover, and how it shows in the OEE figure.
- A manual station with no machine signal.
- How an operator tags a stop reason at the line.
- The rollout plan for your line, in writing.
Frequently Asked Questions (FAQ)
What's the average cost of OEE software?
Costs vary widely with the category of tool, the number of lines and how the machines are connected. A simple dashboard costs far less than a full MES, and our guide to OEE software pricing explains what drives the total.
How do I know if I'm ready for OEE software?
If you track downtime or production on paper or in spreadsheets today, you are ready. Start with one pilot line and agree up front what it must prove.
Should I choose a cloud-based or on-premise solution?
For most manufacturers, a cloud-based (SaaS) solution is the better choice: it is faster to implement, has lower upfront costs and is updated automatically. Check where the vendor hosts your data and which security certificates it holds.
How can I see OEE software before I buy it?
That depends on the vendor, so ask each one: some offer a pilot, others a demo. Fabrico starts with a demo with a Fabrico consultant: book a demo.
Which OEE software is based in the UK?
Of the five tools compared above, FourJaw is based in the UK, in Sheffield. Fabrico is an EU company, and EU customers are hosted on AWS in Frankfurt.
Can OEE software connect to older machines without a PLC?
Yes. FourJaw, MachineMetrics, TeepTrak and Tulip each describe a sensor or edge-device route on their own sites. Fabrico fits a Fabrico IoT device with external sensors on older machines, and AI cameras (an add-on) count output on manual stations.
Does Fabrico work in English?
Yes. The interface runs in English, German, French, Polish and Bulgarian, on iOS, Android and the web. Support responds by email and phone (callback) in under 2 hours.
Stop Comparing Features. Start Solving Problems.
The best choice is the one that fits your data sources and your biggest loss.
Fabrico measures OEE from the PLC, a Fabrico IoT device or AI cameras (an add-on), so one OEE timeline covers machines of every age. See machine connectivity.
See Fabrico live. Book a demo.
Book a demoContact usRelated articles




Latest from our blog


Real Fabrico tiles, sample data.