


 Login
 Blog
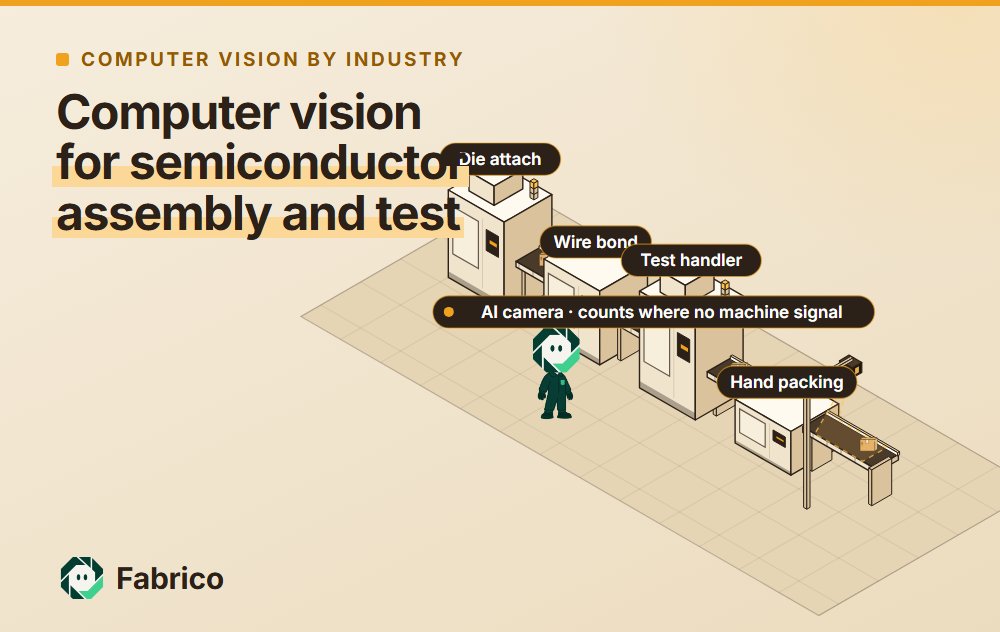
Computer Vision for Semiconductor Assembly and Test: Find the Station Holding Output Back

In short: computer vision helps find a semiconductor back end's constraint by counting boards, trays and bags at the manual benches the host MES cannot see.
Inspection cameras judge each device; a counting camera only tells you how many boards, trays and bags left a bench, and when.
- Run the queue test first: the queue that grows sits in front of the constraint, and the queue that runs dry sits behind it.
- Usual suspects: the final test cell and its setup operators, burn-in ovens and boards, or one bonding or mould step.
- Price only the constraint's lost minutes; in the example below, pricing the busy-looking bench instead overstates the loss 3.9 times.
- Camera add-on: counts output; the video for the minute of a stop is streamed on request and not stored in Fabrico.
Ask a back-end site why output was short last night and you will hear three answers: test was down, the ovens were full, the BIB bench was slow. All three can be true and only one of them cost shipments. The host MES knows when each lot was tracked in and out of test. It does not know how many burn-in boards left a hand-load bench, so the argument is settled by whoever talks loudest. Counts settle it better.
The queue test: which queue grows, which runs dry
Before anyone compares OEE per tool, count the queues. For one shift, write down what sits in front of each station at the start, what arrives, what leaves and what is left at the end. A back end has natural queue points: lots waiting for test after assembly, devices waiting to be loaded into burn-in boards, empty boards waiting at the load bench, and trays waiting for dry pack.
- A queue that grows over the shift sits in front of a station that cannot keep up.
- A queue that runs dry sits behind that station. The bench it feeds stands with nothing to load.
- A queue that shrinks means the station after it has spare capacity that night.
The station between a growing queue and an empty one is your constraint for that product mix. Two cautions. Repeat the count over a week of shifts, because a change in package mix or in the share of burn-in products can move the constraint. And keep lots on engineering hold out of the count.
Why the queue and not the OEE figure? A station running close to full capacity builds a long, jumpy queue even when its OEE looks ordinary, and throughput in manufacturing is set by that station, not by the average one. For the wider method, see bottleneck analysis in manufacturing.
What nobody counts is the hand work between tools: boards racked at a manual BIB bench, boards back from repair, bags sealed at dry pack. Those are the gaps a camera count fills.
Explainer presented by Iris, Fabrico's AI-generated presenter: how an add-on camera counts output where a machine has no signal. Book a demo.
Plays from YouTube. Google may set cookies when you press play. Privacy policy.
One night of queue counts at a four-queue back end
Example numbers, no real site. The plant has bonders, mould presses and saws on SECS/GEM, two final test cells, one manual burn-in board (BIB) load bench, a bank of burn-in ovens, sort, tape and reel, and a dry pack bench. Lots of 1,272 devices run on the night shift from 22:00 to 06:00. Lot counts come from the host MES, devices from the traveller, and boards and trays from a camera add-on at the benches.
| Queue | At 22:00 | Arrived | Left | At 06:00 | What it says |
|---|---|---|---|---|---|
| Lots waiting for test cell 2 | 6 lots | 5 lots | 4 lots | 7 lots | Grows: work arrives faster than the cell clears it |
| Devices waiting for BIB load | 192 | 5,088 | 5,280 | 0 | Runs dry twice, 35 minutes in all: the bench is starved |
| Empty boards at the load bench | 12 | 43 | 55 | 0 | Runs out once, 25 minutes: oven turnaround is tight |
| Trays waiting for dry pack | 40 | 120 | 142 | 18 | Shrinks: dry pack has room tonight |
Read it from the top. The lot queue in front of test cell 2 grew by one lot while the device queue behind it ran dry twice. That brackets the constraint: test cell 2. Its 4 lots out are the 5,088 devices that arrived at the BIB bench, and the bench loaded those plus the 192 waiting at the start, 55 good boards of 96 devices each.
The empty boards running out for 25 minutes is a second, smaller signal: the board pool will become the constraint the day test gets faster. Dry pack has slack tonight, so a camera there first would prove nothing.
Suspect one: test cells, setup operators and the double pass
A test cell is a tester with the test program, a handler that moves devices at the test temperature, and an adapter between them. Kress and Müller, describing the cells at their industry partner, add: Some handler-adapter combinations are able to handle multiple devices in parallel (multisite testing). Touchdowns times sites set the pace.
A setup can mean changing the adapter or handler, loading new software or waiting for the handler to reach temperature. Setups are executed by human setup operators and may take a significant amount of time in the range of multiple hours, and at that partner setup operators were a scarce resource. The constraint is often not the tester but the one person on nights who can convert it.
That changes how test should be counted:
- Output is units by final bin. Good bins count as good, fail bins as rejects. Touchdowns times sites is the pace, not the output.
- Retests stay apart. A unit tested twice is one unit. Count it once, after its final bin, or a bad contactor makes the cell look fast. First pass and final yield answer different questions; rolled throughput yield shows why.
- Two stop codes, not one. The planned kit change is conversion time. The minutes past the plan spent waiting for a setup operator get their own reason, or a staffing gap reads as slow testing.
Burn-in adds load here too: where a customer requires it, an optional subsequent burn-in operation followed by additional functional tests is performed. A product with burn-in passes test twice, so a rising share of burn-in products can make test the constraint without a single tool changing.
Suspect two: burn-in ovens, boards and the BIB bench
Burn-in is slow by design. During it, Kress and Müller note, the circuits are loaded into ovens and are subjected to thermal stress for multiple hours or even days in order to be able to detect latent defects. Yet at their industry partner, burn-in took place at large (non-bottleneck) ovens. Slow does not mean constraining. Whether the ovens hold output back depends on how many there are and how they are loaded.
Loading matters because an oven is a batch machine. Lee, Uzsoy and Martin-Vega, in their study of scheduling semiconductor burn-in operations, model ovens as batch machines: The processing time of a batch is equal to the largest processing time among all jobs in the batch. A short-stress lot mixed with a long one waits for it, and a half-full oven run is lost capacity no driver log flags as a stop.
Three counts tell the burn-in story: oven slots in use, from the driver log; boards racked at the load bench, from a camera add-on over the outfeed; and boards back from the repair bench. If slots sit empty while boards wait, the problem is batching. If the bench waits for empty boards, the board pool is the constraint, and the fix may be faster unloading, cooling or socket repair rather than another oven.
Suspect three: bonding and mould tools that already report their states
Die attach, wire bond, mould, saw and trim and form tools on a modern line report to the host MES over SECS/GEM. Many sites book their time in SEMI E10 states; the OPC Foundation's machine vision specification, for one, follows the scheme of 6 basic system states defined by SEMI E10 standard: productive, standby, engineering, scheduled downtime, unscheduled downtime and nonscheduled time.
Those states answer the constraint question without a camera. A bonder that spends hours in standby is not the constraint. A mould press that is productive nearly all shift while strips pile up at its input may be, especially when a chase swap or compound still thawing after cold storage takes it out. The tool-by-tool picture is in OEE software for semiconductor manufacturing.
The weak spot is hand work. A CSIS analysis puts it plainly: Semiconductor Packaging is an extremely labor-intensive process. The hand step that most often starves a bonder is lot kitting: a short kit of leadframes or wire stops the bonder an hour later, and its log books a material wait with no clue where it came from.
This plant's flow: two test cells, one burn-in loop
The example plant is not a straight line, which is why the constraint hides. Test cell 1 takes products that need no burn-in and sends them to sort and tape and reel. Test cell 2 takes burn-in products. After burn-in those boards are unloaded and the devices go back to test cell 1 for their second test, so cell 1 carries two flows at once.
The host MES gives Q1 and the tool states; the camera add-on gives the boards at the bench and the bags at dry pack. Draw this map for your site before choosing a camera position: where the flow branches or loops back, a straight station list points at the wrong bench.
Worked example: the BIB bench looks slow, test cell 2 sets the pace
Here is the same night seen from the BIB load bench. The shift runs 22:00 to 06:00 with a 30-minute break: 450 planned minutes. Each board holds 96 devices, and the ideal cycle to load and rack one board is 6 minutes. The camera add-on counts boards placed on the oven rack cart; the team lead enters stop reasons.
Availability. The bench stood 35 minutes with no devices, because test cell 2 was on a kit change that ran past its slot while the night's setup operator was at another cell, and 25 minutes with no empty boards, because the last oven load was still cooling. Run time was 390 of 450 minutes: 86.7%.
Performance. The camera add-on counted 58 boards racked. At 6 minutes each, that is 348 minutes of ideal work in 390 minutes of running: 89.2%. The 42 minutes left are slow loading.
Quality. The burn-in system's pre-check flagged 3 boards with devices not seated, and they were reloaded. 55 of 58 boards were good first time: 94.8%. Those 3 boards cost 18 minutes.
OEE. 86.7% x 89.2% x 94.8% = 73.3%. The quick check: 55 good boards x 6 minutes = 330 minutes, and 330 of 450 is 73.3%.
A 73.3% bench invites a project at the bench. The queue test says no: the bench cleared every device test sent it and ended the night with an empty queue. Its 60 stopped minutes were symptoms, 35 caused by test cell 2 and 25 by the board pool. Its 42 slow and 18 reload minutes cost nothing tonight, because the bench had more capacity than test could feed. OEE vs throughput explains that gap in general.
Price only the constraint's minutes, while demand waits
Money follows the constraint. A minute lost at the constraint is a minute of output the plant never gets back. A minute lost at a station with slack is absorbed by the queue in front of it. Price the night both ways with an example contribution margin of EUR 0.40 per device, a figure the plant replaces with its own, and an example ideal rate of 14 devices a minute for test cell 2.
| Way of pricing the night | Minutes priced | Devices | At EUR 0.40 | Over 21 nights |
|---|---|---|---|---|
| All lost minutes at the BIB bench | 120 (60 stopped, 42 slow, 18 reload) | 20 boards x 96 = 1,920 | EUR 768 | EUR 16,128 |
| Only the constraint's lost minutes | 35 at test cell 2 | 35 x 14 = 490 | EUR 196 | EUR 4,116 |
Pricing the bench overstates the loss 3.9 times and points the money at the wrong station. The honest figure is EUR 196 a night, and only while customer orders wait for those devices; with no backlog, a lost minute at test costs crew time, not margin. The fix is cheap: book the setup operator for the cell 2 kit change before the night starts, and give the wait its own stop code.
Once test is faster, the board pool takes over and its 25 minutes become the ones to price; theory of constraints vs lean explains that handover. Book a demo to see queue counts from the host MES and bench counts from a camera add-on on one shift timeline.
Where Fabrico fits in the hunt
Fabrico is cloud OEE software with light MES functions. At a back-end site it does three things today:
- On tools without a usable host count, such as older trim and form tools, bake ovens or a sealing station, it takes stops and counts from a machine signal: a PLC output, a sensor or a counter.
- At BIB benches, the repair bench, kitting and dry pack the camera add-on counts boards racked, boards returned, kits issued and bags sealed. Where the camera add-on covers the station, the video for the minute of a stop can be opened from the shift timeline, streamed on request and not stored in Fabrico.
- Per board type or package you set an ideal cycle time, and counted boards and bags become performance and OEE by bench and shift.
Operators and team leads enter stop reasons on a tablet or phone at the bench. OEE and losses by station and shift show on the web, iOS and Android, and Fabrico prices losses from the plant's own SKU price or margin, so the stop list ranks by money rather than minutes. Which station's minutes deserve that price is the queue test's answer. Bench figures go out by REST API, webhook, or Excel and CSV, to sit beside the host MES data.
On the roadmap, not live today: a camera add-on that notices an idle BIB bench without being told and proposes the likely reason.
Outside Fabrico: all inspection, test programs and binning, recipes and lot genealogy. They stay with the inspection systems, the tester and the host MES.
The product page is Fabrico computer vision for OEE, and the platform is described in light MES and OEE software. The questions below apply to Fabrico as well.
What to count first, and where a camera count stops
Start with the counts you have; add cameras only where the hunt needs them:
- Lots in and out of each test cell, from the host MES. No camera. This is half the queue test.
- Boards racked at the BIB load bench, with a camera add-on over the outfeed, if burn-in products are a real share of the mix.
- Boards back from the repair bench, if empty boards ever run out.
- Bags sealed at dry pack, only if the tray queue in front of it grows. Dry pack timing matters because the joint IPC/JEDEC standard J-STD-020 exists so moisture-sensitive devices can be properly packaged, stored, and handled, and devices that wait too long between bake and seal go back to the oven.
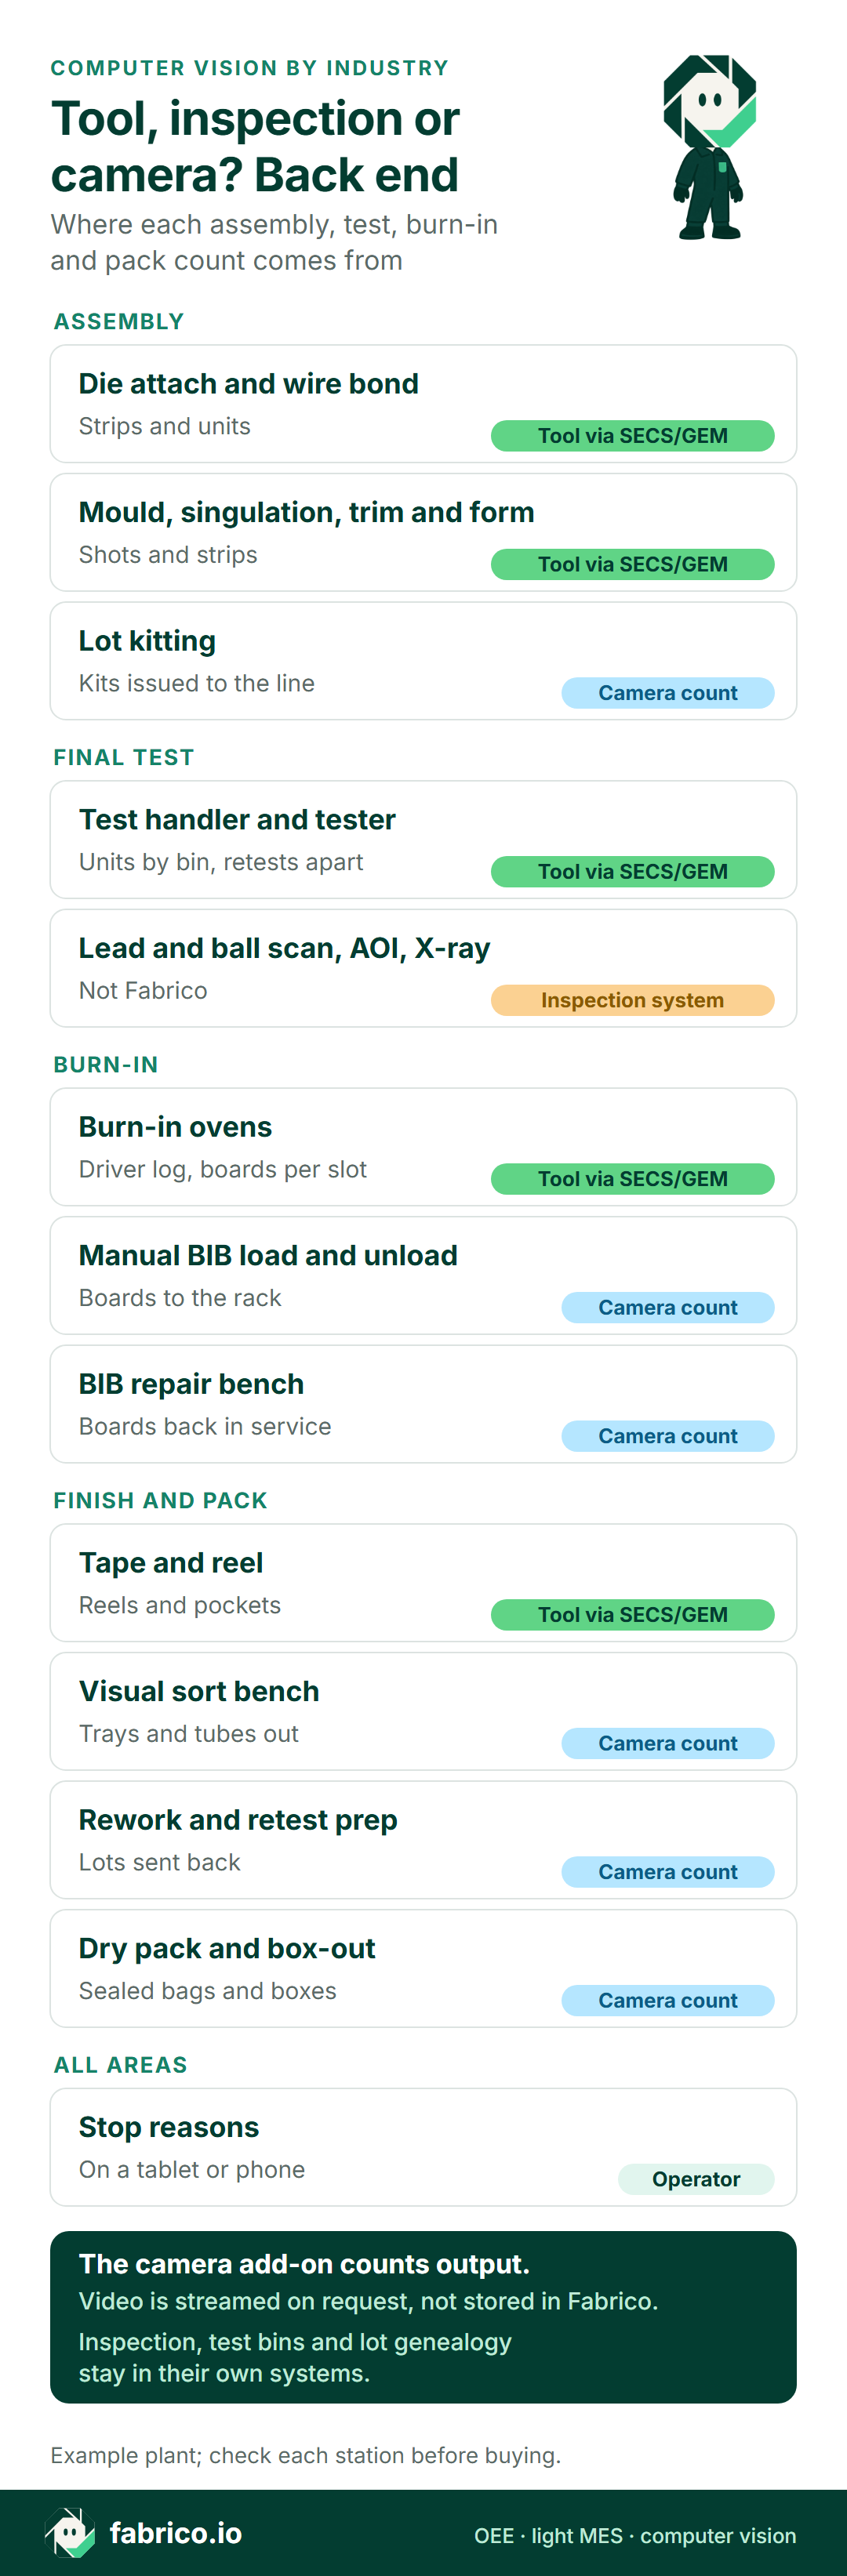
Text version of this infographic
- Assembly: die attach and wire bond: tool via SECS/GEM, strips and units
- Assembly: mould, singulation, trim and form: tool via SECS/GEM, shots and strips
- Assembly: lot kitting: camera count, kits issued to the line
- Final test: test handler and tester: tool via SECS/GEM, units by bin, retests apart
- Final test: lead and ball scan, AOI, X-ray: inspection system, not Fabrico
- Burn-in: burn-in ovens: tool via SECS/GEM, driver log, boards per slot
- Burn-in: manual BIB load and unload: camera count, boards to the rack
- Burn-in: BIB repair bench: camera count, boards back in service
- Finish and pack: tape and reel: tool via SECS/GEM, reels and pockets
- Finish and pack: visual sort bench: camera count, trays and tubes out
- Finish and pack: rework and retest prep: camera count, lots sent back
- Finish and pack: dry pack and box-out: camera count, sealed bags and boxes
- In every area, stop reasons come from the operator on a tablet or phone
- Camera add-on: counts output; video is streamed on request, not stored in Fabrico
- Inspection, test bins and lot genealogy stay in their own systems
Count large objects at one point: a loaded board leaving the bench, a sealed bag dropping into a box. Avoid counting devices in trays or sockets. A 2026 review of industrial object counting in Sensors names the hard cases plainly: workpieces often have highly similar textures and shapes, and are stacked at extremely high densities, leading to severe occlusion and adhesion. The same review lists strong specular reflection on metal parts, motion blur and backlit or low-light stations among the conditions that degrade counting. Shiny trays, clear barrier bags and hands over the work are those conditions, so the camera looks at the outfeed. The review gives no accuracy figure for a back-end bench, so check the count against the traveller before trusting it.
Inspection is a different field. A survey by Alam and Kehtarnavaz reviews detection methods for die attach and wire bonding defects across optical, radiological, acoustical and infrared sensing. AOI, X-ray, lead and ball scanners and the tester decide what is good, and their reject and bin counts reach OEE quality through the host MES. For how bench counts become an OEE figure, see OEE with computer vision.
Questions for any vendor before a constraint pilot
| Question | What a good answer shows |
|---|---|
| Can lot counts and bench counts sit on one timeline? | Lots in and out of each queue by shift, beside the boards and bags counted at the benches. |
| How is a kit change that runs long booked? | The planned conversion and the wait for a setup operator as two codes; see operator-friendly OEE reason codes. |
| How is test output counted? | Units by final bin, retests once, touchdowns and sites as pace only. |
| What does the camera count at a BIB bench? | Boards racked at the outfeed, not hands moving over sockets. |
| Can it follow WIP between stations? | Queue sizes from counts in and out; dedicated WIP tracking software is the other route. |
| Can it price one station's minutes on their own? | Losses in money from the plant's own margin, per station, as in throughput accounting. |
| Can the camera go in the clean room or ESD area? | A housing, mount and cleaning routine facilities and the ESD coordinator approve. |
Settle the purpose of the count with the operators, and with the works council where one exists, before a bracket is drilled. Report boards and bags per bench and shift, never per person. OSAT customers audit the site, so keep their markings out of frame and tell each customer where cameras sit.
ISO 14644-1 classifies clean room air by the concentration of airborne particles, so a housing and its cleaning routine are a particle question for facilities. ESD programmes follow standards from the EOS/ESD Association, which describes itself as the only organization accredited by ANSI to write and produce standards on electrostatics. Get a written data flow for video from any vendor.
Constraint questions from back-end teams
Is final test always the constraint in assembly and test?
No. Test is a common one, because burn-in products pass it twice and setups can wait for a setup operator, but the ovens, the board pool or a mould step can hold output back instead. The queue test settles it for your product mix.
Can an OEE camera replace AOI, X-ray or the tester?
No. Voids, wire sweep, bent leads, missing balls and marking errors are found by AOI, X-ray, lead and ball scanners and visual inspection, and the tester decides the bins. Fabrico does no inspection. Reject and bin counts from those systems still feed the OEE quality figure.
Why count boards and not devices at a burn-in bench?
A loaded board leaving the bench is one large object passing one point, which a camera counts far more reliably than small, identical devices in sockets under an operator's hands. The traveller already says how many devices a board holds.
Does a bonder on SECS/GEM still need a camera?
Rarely. A bonder or handler that reports its states and counts to the host MES already shows whether it is starved, blocked or running flat out. Spend the camera budget on the benches between those tools.
Want to see test lots, BIB boards and dry pack bags counted on one shift timeline? Book a demo.










Real Fabrico tiles, sample data.