







 Login
 Blog
OEE vs OTIF: How Line Performance Reaches the Customer

Key takeaways
- OTIF (on time in full) = orders delivered on time and complete / all orders.
- OEE reaches OTIF through one thing: enough good product before the truck leaves.
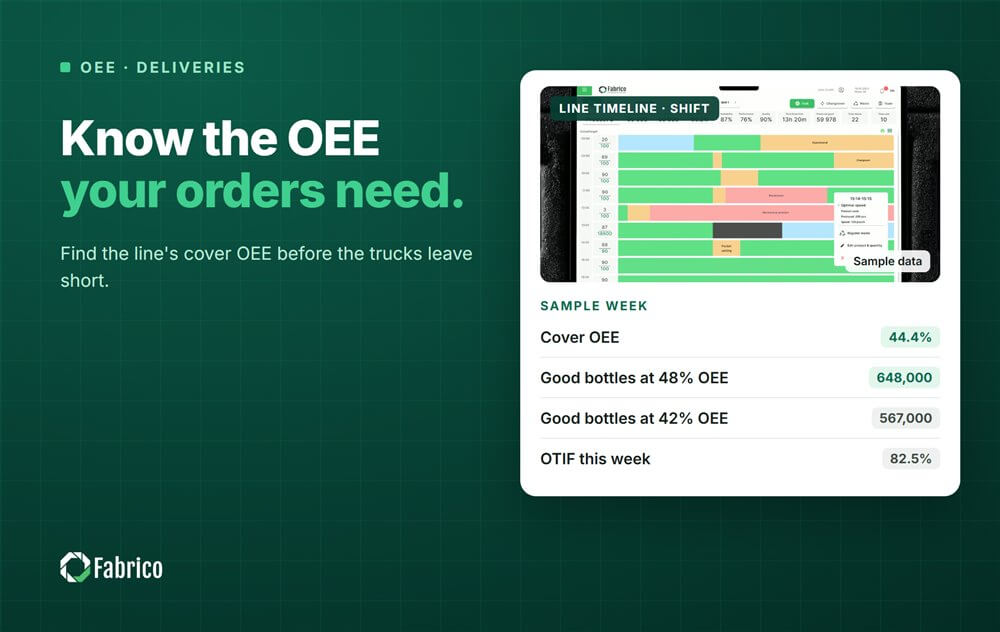
- The worked example line needs a 44.4% OEE to cover demand. We call that the cover OEE.
- In the worked week only 3 of 7 missed orders traced back to the line.
Fabrico, OEE and light MES (manufacturing execution system) software with AI cameras, logs stops automatically and prices each loss. Order and delivery data stay in your own systems.
Below: the two measures, the OEE a line needs to cover its demand, and how to split OTIF misses by cause.
What is OTIF?
OTIF stands for on time in full. An order counts only if it arrives in the agreed window, with every item complete.
- OTIF = orders on time and in full / total orders, for a week or a month.
- Some customers count per order line or per case instead. Ask which one yours uses.
Our guide on improving OTIF in manufacturing covers the delivery side. Here we stay on the line.
How does OEE connect to OTIF?
Through good output. A line with low OEE makes fewer good units in the same hours. When demand sits well inside what the line can make, a few OEE points matter much less to the customer. The margin still absorbs bad weeks.
When demand is close to what the line can make, every point counts.
| Link in the chain | Measure | Owned by |
|---|---|---|
| The line uses its time well | OEE | Production |
| Enough of the right products | Attainment and adherence | Production, planning |
| Ready when the truck comes | Stock and dispatch | Logistics |
| Arrives on time and complete | OTIF | The supply chain |
Our article on schedule attainment vs production adherence explains the second row.
What OEE does a line need to cover demand? A worked example
Sample line (illustrative numbers, not a customer): a filler rated at 300 bottles a minute. It is planned for 2 shifts of 450 minutes, 5 days a week.
That is 4,500 minutes, or 4,500 x 300 = 1,350,000 bottles at the ideal speed. Customers order 600,000 a week.
- OEE needed to cover demand = 600,000 / 1,350,000 = 44.4%.
- At 48% OEE: 648,000 good bottles, 48,000 to spare.
- At 42% OEE: 567,000 good bottles, 33,000 short. Some orders leave late or short, unless stock or overtime covers them.
The difference between a calm week and an OTIF problem is six OEE points. Plants that know their cover OEE can see trouble coming. A few bad shifts in a row are a delivery risk long before dispatch feels it.
Is every OTIF miss a line problem? A worked example
Same Sample line, one week with 40 orders and 7 misses. OTIF = 33 / 40 = 82.5%.
| Cause of the miss | Orders | What fixes it |
|---|---|---|
| Line made too little in time | 3 | OEE, mostly the long stops |
| Wrong product made first | 1 | Plan adherence |
| Transport late | 2 | Logistics |
| Order changed after cut-off | 1 | Customer service |
Only 3 of the 7 misses trace back to the line's OEE. Pushing production harder fixes those three and nothing else. Split the misses like this every week, so the right team owns each one.
How do you use OEE to protect OTIF?
- Work out the cover OEE for each line: weekly demand / possible output in the planned hours.
- Show the week's running OEE against that line on the daily board.
- When the week falls below cover, act early: more hours, another line, or a call to the customer.
- Price each stop by what it costs the week, so the biggest risk is fixed first.
- Review the cover OEE whenever demand or the product mix changes.
Our note on OEE vs output target covers daily targets in the same way.
Why does the OTIF method matter for the line?
A customer who counts per case sees a short order as nearly complete. A customer who counts per order sees it as a miss. The same short week can look fine to one customer and bad to another. Know which method each big customer uses, and plan the line margin for the strictest one.
What mistakes do plants make with OEE and OTIF?
- Blaming production for every OTIF miss.
- Chasing OEE on a line with plenty of spare capacity, while another line sits at its limit.
- Measuring OTIF per order while the customer measures it per case.
- Ignoring a run of bad shifts until the trucks leave short.
Where Fabrico fits
Fabrico is a computer vision enabled Manufacturing Performance Platform. OEE and light MES come first. Automatic downtime logging and OEE live by line and shift put the stops behind a short week on record.
- OEE live by line and shift, to compare the week with the line's cover OEE.
- Losses ranked by money, so the costliest stops come first.
- One view across plants, when a short line in one plant can be covered by another.
Read what a light MES covers in our light MES guide. You start on one line, with a baseline and a decision date agreed in advance. There is no free plan and there are no tiers: each plant gets a quote.
Frequently asked questions
What is the difference between OEE and OTIF?
OEE measures how well a line used its planned time. OTIF measures how many orders reached the customer on time and complete. OEE is one input to OTIF, next to planning, stock and transport. A good OEE helps OTIF most when the line is close to its limit.
Does higher OEE improve OTIF?
Only when the line is close to the limit of what it must make. Above that point, extra OEE becomes spare capacity. That still helps, because it absorbs bad weeks, but it improves OTIF only if the extra output goes into more orders or replaces overtime.
How do you calculate OTIF?
Count the orders that arrived in the agreed window and complete, and divide by all orders in the period. Check whether your customer counts per order, per order line or per case. The same week can score quite differently on each of the three methods.
What is cover OEE?
It is our name for the OEE a line needs to make weekly demand in its planned hours. Divide demand by planned time x ideal speed. In the worked example it is 44.4%. Below that figure, the line cannot cover demand without stock, overtime or another line.
Who owns OTIF in a plant?
The whole supply chain. Production owns the line's share, planning owns the sequence and logistics owns transport. Split each missed order by cause every week. Then each team owns its part, and production is not blamed for a late truck or a changed order.
See your lines' share of OTIF in a demo
Bring one line, its weekly demand and a month of shift data. We will show its cover OEE and the stops that put orders at risk.
Related articles









Real Fabrico tiles, sample data.