


 Login
 Blog
7 Best Visual Factory Software Tools for Real-Time Visibility (2026)

Key takeaways
- Visual factory software shows the state of production on screens at the line: the target for now, the actual count, the gap, the reason for a stop and who owns the response.
- The 7 tools below differ most in what feeds the screen (machine data, sensors, operator input or typed indicators) and in the screen itself: built apps, a scoreboard, a dispatch view, machine dashboards, team huddle screens, digital SQCDP boards or a live OEE dashboard.
- Every vendor line here comes from that vendor's own pages, read on 16.11.2026, and the comparison matrix marks what those pages do not state.
- Worked example (sample figures): on a tube line, cutting the wait from a stop to a response from 9 to 4 minutes for 5 stops a shift wins back 25 run minutes, EUR 121.35 of margin a shift and EUR 100,478 a year, if the tubes would sell.
- Choose by the decision the screen must support: a count, a call for help, a meeting, a custom app, or why a line stops and who responds.
Visual factory software shows the live state of production on screens where the work happens: what a line should have made by now, what it made, the gap, and, when it stops, why and who is responding. It is the software side of a visual factory, the lean idea that the state of the floor should be readable at a glance, and it rests on the principle of visual management.
Paper boards, lights over the line and lines on the floor did this job first. Software adds a live count, the reason a line stopped and a notification to the person who has to act, on a floor screen, a tablet or a phone.
This list compares 7 visual factory software tools: Tulip, Vorne XL, L2L, MachineMetrics, Redzone, iObeya and Fabrico. Fabrico, the seventh entry, is made by the publisher of this page. Each entry gives the fit, what the vendor's own pages say the tool shows and where its data comes from, and what to plan for; a matrix then puts all 7 side by side.
What visual factory software should show on a floor screen
Research treats visual management as communication over a short distance. A literature synthesis by Tezel, Koskela and Tzortzopoulos (2016) calls it an important close-range communication strategy based on cognitively effective information conveyance, and proposes nine functions it can serve in a plant, from process transparency and discipline to management-by-facts. Transparency, in their reading, supports management-by-sight, which requires understanding of the workplace at a glance by both the manager and the people being managed.
A 2021 paper on patterns for visual management in Industry 4.0 by Fenza, Loia and Nota puts the same demand on software: the message must be perceived at a glance, so that places become self-explanatory. Among the well-known forms it names the andon board, placed near a workstation or above a production line to give the operating status of the equipment. Andon here is a method: a signal at the line that says it needs help; andon system vs OEE software compares the two.
For a plant manager, the method comes down to five things on the screen at the line:
- Target: what the plan says the line should have made by this point in the shift.
- Actual: the good units counted so far.
- Gap: target minus actual, in units, so nobody has to do the sum.
- Reason: why the line is stopped now, given at the line.
- Owner: who responds to that reason and whether they are on the way.
A screen with output alone is a scoreboard: it tells the shift that it is behind. Add the reason and the owner, and it tells someone what to do next. The rest of this page measures each tool against those five elements.
Tezel and colleagues add a warning that applies to this page too: the consultants' books in their review carry the positive bias that is inherent in their depiction and narrative of visual management. Vendor pages share it. So each entry below repeats what a vendor's page says, dated, and the matrix marks what the page does not say.
None of the five elements works without measurement behind the screen. OEE software takes run time and output from the machine's PLC or an IoT device with sensors on the machines you connect; operators add the reason for a stop at the line, and the screen can then show the gap and its cause together. The video walks through a shift timeline on sample lines and the screen an operator uses to name a stop.
What you see: a shift timeline, unclassified time waiting for a reason, and the operator's line-down screen, on sample lines. Book a demo.
Plays from YouTube. Google may set cookies when you press play. Privacy policy.
Tulip: no-code apps and dashboards
Made for, per its own pages: plants with engineers who want to build their own shop floor apps and screens and connect machines to them.
Tulip is a no-code app platform. Its authoring page says you can create apps, add logic, build connectors, and more with no-code editing. On its OEE tracking page, availability and performance come from machine and PLC data over native OPC UA or MQTT and combine with the reason code an operator enters, to produce one OEE number broken out by line and by shift.
The same page says that if a machine goes down or an operator flags an issue, a trigger can automatically send an SMS, email or push notification to maintenance or supervisors, and that Tulip tracks production across entirely manual assembly lines through operator apps. Older machines connect through edge hardware.
-
Screen: the apps and dashboards you build, on operator terminals and screens at the line.
-
Data and alerts: PLC and machine data over OPC UA, MQTT or Modbus, edge devices for older machines, and reason codes from operators; SMS, email or push notifications set by triggers.
-
Plan for: a person in the plant who designs, builds and keeps the apps and screens current, because you build them.
Vorne XL: scoreboard at the line, reports in the browser
Made for, per its own pages: lines that want a large target against actual display at the line, fed by one or two sensors, with reports in a browser.
Vorne XL is a device that sits at the line. Its XL product page says that by connecting just one or two sensors to your line, Vorne XL automates data collection and gives real-time and historical visibility with 140+ metrics and 64+ built-in reports. The sensors can be new, or an existing photo-eye, relay, PLC or proximity switch. A state light on the device glows green, red, amber or blue for the state of the line, and the HDMI port lets you use any size TV or monitor as an operator scoreboard.
Operators scan down and reject reasons with a barcode kit. On the integration tools page, the XL HMI sets downtime reason codes from a tablet or touchscreen, an API and data links connect ERP and PLC systems, and the Display Viewer recreates the scoreboard on any monitor or television. Managers receive email reports and email or text alerts.
-
Screen: the XL device with its state light, an operator scoreboard on any TV or monitor, and browser reports for managers.
-
Data and alerts: one or two sensors, or an existing photo-eye, relay, PLC or proximity switch; reasons by barcode scan or the XL HMI; email reports and email or text alerts.
-
Plan for: a scanner or HMI at the line if you want stop reasons as well as counts and cycles.
L2L: dispatch and escalation on the shop floor
Made for, per its own pages: plants where the gap is getting the right person to a problem, with timed escalation across shifts and sites.
L2L logs an issue on the floor as a Dispatch. Its factory notification system page lets you configure automatic, timed notifications up a chain of command, so an unresolved issue reaches the next person without anyone having to remember to follow up. Alerts go by email, text, Microsoft Teams, WhatsApp or browser notification, a machine status dashboard shows open issue status and duration at a glance, and a banner can push a plant-wide message to every screen.
On its production management page, L2L tracks output, performance and status live across lines and sites, connects machine pace and operator inputs, and gives visibility into the Six Big Losses in real time, with an ERP connection across every site.
-
Screen: a machine status dashboard with open issues and how long they have been open, plant-wide banner messages, and browser and mobile apps.
-
Data and alerts: machine pace and operator inputs; timed escalation by email, text, Microsoft Teams, WhatsApp or browser.
-
Plan for: agreeing the escalation chain and its timings with the people in it.
MachineMetrics: CNC machine dashboards and operator tablets
Made for, per its own pages: machine shops and discrete plants with CNC machines that want data read from the machine control, with a tablet at each machine.
MachineMetrics reads the machine control. Its machine monitoring page says it collects data from each machine control and machine operator for the entire production floor, through PLC protocols such as MTConnect, Fanuc and OPC-UA, with an edge device for digital and analog I/O on other machines. On shop floor dashboards, simple colour-coding gives an at-a-glance indication of whether a job is performing at or below expectations, against parts goal or OEE.
A tablet at the machine allows operators to categorize downtime, reject a part and start or stop jobs. For any job that falls behind or machine that goes down, a text or email notification can be sent, and managers can view the real-time status of machines across departments and locations.
-
Screen: colour-coded real-time dashboards on monitors across the shop floor, with an at-a-glance indication against parts goal or OEE. Operators categorize downtime and reject parts on a tablet at the machine.
-
Data and alerts: the machine control and PLC protocols, edge I/O for other machines, and downtime reasons from operators or rules; text or email notifications.
-
Plan for: a tablet at each machine where operators give downtime reasons, alongside the machine connection.
Redzone: live OEE with team huddles
Made for, per its own pages: plants that want live OEE tied to shift huddles and frontline routines.
Redzone pairs OEE with team routines. Its Redzone Productivity page says manufacturers get live OEE tracking for every line, cell and shift. Downtime and throughput are automatically collected, timestamped and linked to line, run and assets, and operators can log additional context from the line in seconds.
Structured digital huddle routines keep every shift aligned on targets, top issues and interventions, and the platform puts visual dashboards and cross-team communication in the same place that tracks OEE. It integrates with SAP, Oracle and other systems via Boomi or Snowflake, and runs on web, iOS and Android.
-
Screen: visual dashboards for live OEE, and structured digital huddle routines for each shift; web, iOS and Android.
-
Data and alerts: downtime and throughput collected automatically, with operator context; the connection method is not stated on the page read.
-
Plan for: a huddle routine for each shift that the team runs with the screen.
iObeya: digital boards for SQCDP and daily meetings
Made for, per its own pages: plants that run tiered daily meetings on SQCDP boards and want them digital and consolidated from line to plant.
iObeya turns meeting boards into software. Its SQCDP feature page describes operator-friendly boards with effortless data entry for performance management and continuous improvement. Consolidated dashboards give an overall performance outlook updated in real time, and actions can be escalated and de-escalated to different levels of the organisation.
Its lean manufacturing page adds plant and line management dashboards, and integrations through MS Power Automate or the iObeya Open API, to aggregate data from several manufacturing applications into one view of plant operations.
-
Screen: digital SQCDP boards with indicators and actions, and consolidated dashboards from line to plant level.
-
Data and alerts: indicators entered on the boards by teams, data from other applications through integrations, and actions escalated between levels.
-
Plan for: a source of machine data if you want live OEE on the boards; the pages read describe boards and integrations, not a machine connection; digital tier boards vs OEE software covers that choice.
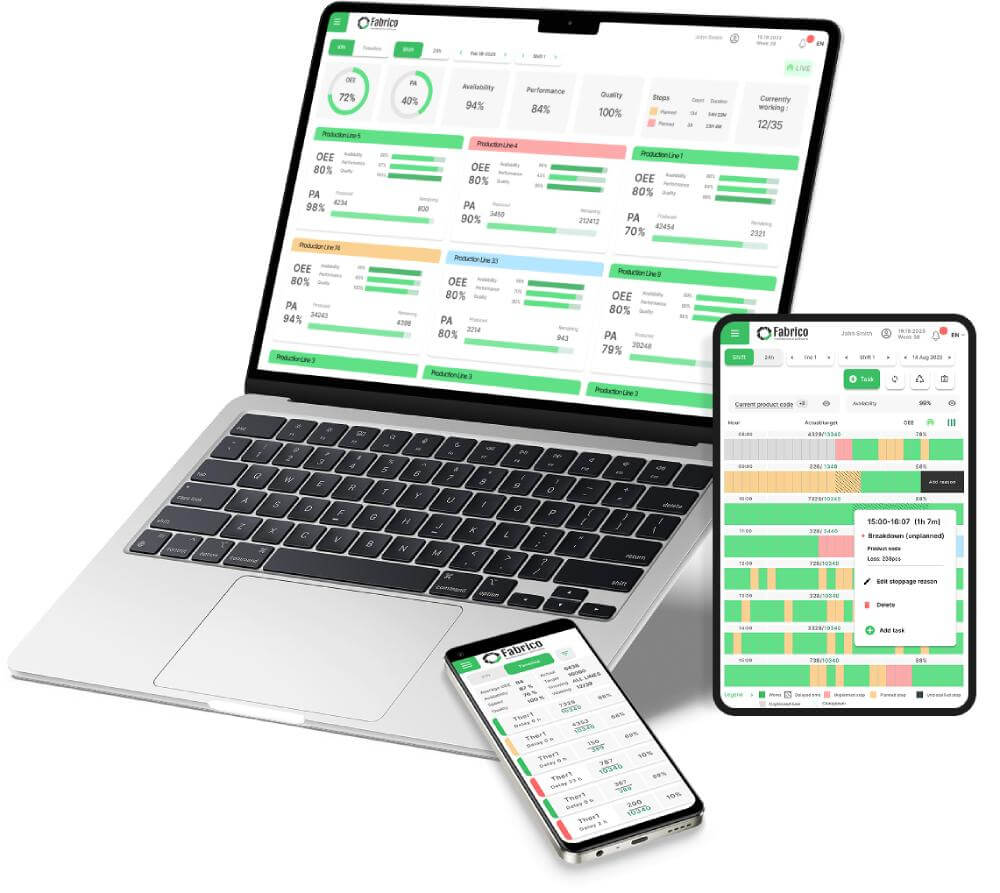
Fabrico: live OEE dashboard and light MES
Made for: discrete and FMCG plants that want live OEE on the shop floor and a light MES, with stop reasons from operators and the same numbers on a floor screen, a tablet and in the office.
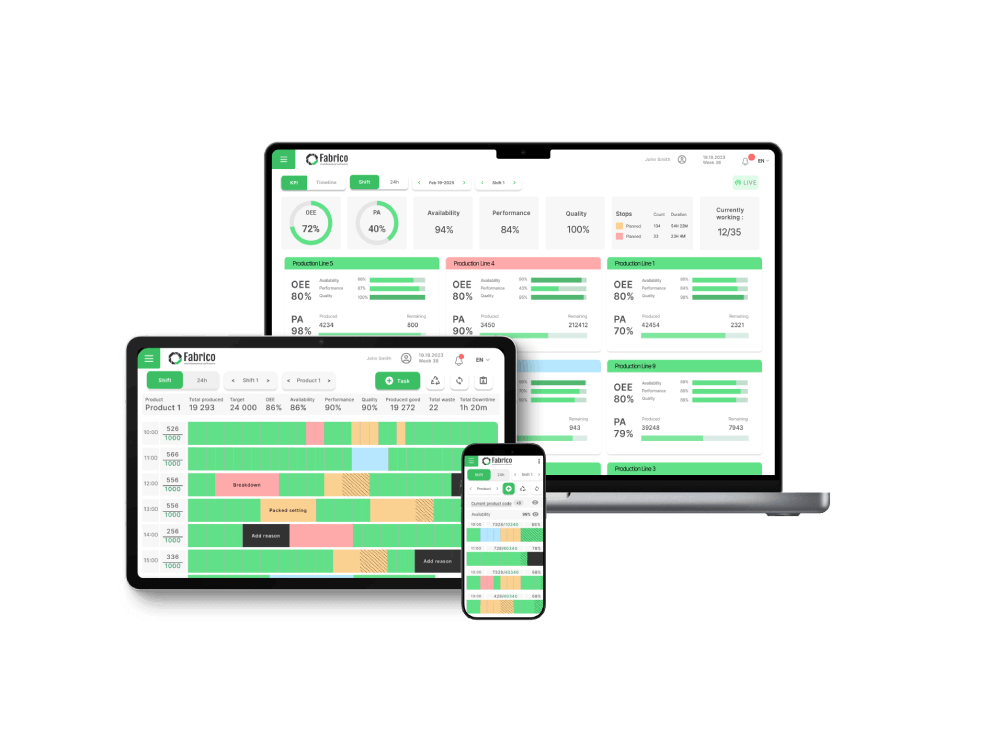
Fabrico is made by the publisher of this page. It combines OEE software with a light MES: real-time OEE (availability x performance x quality) per line and shift, a live OEE dashboard, micro-stop detection and the six big losses made visible. Data comes from the machine's PLC or an IoT device with sensors on the machines you connect, and operators give the reason for a stop at the machine.
On the floor, Fabrico shows a live OEE dashboard on a floor screen or tablet, with notifications by rule: push, in-app and email notifications with smart rules, on iOS, Android and the web. Customizable dashboards and a multi-plant view with cross-plant benchmarking put lines and plants side by side, and a REST API, webhooks, Zapier and Excel import and export connect it to other systems. With the selling price and margin of each SKU entered, losses are priced in money.
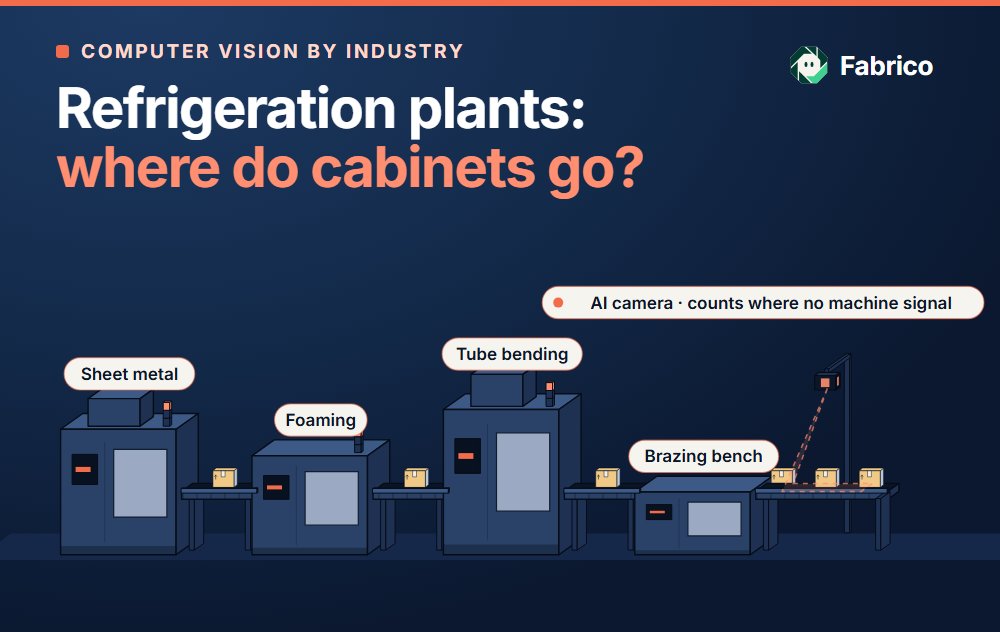
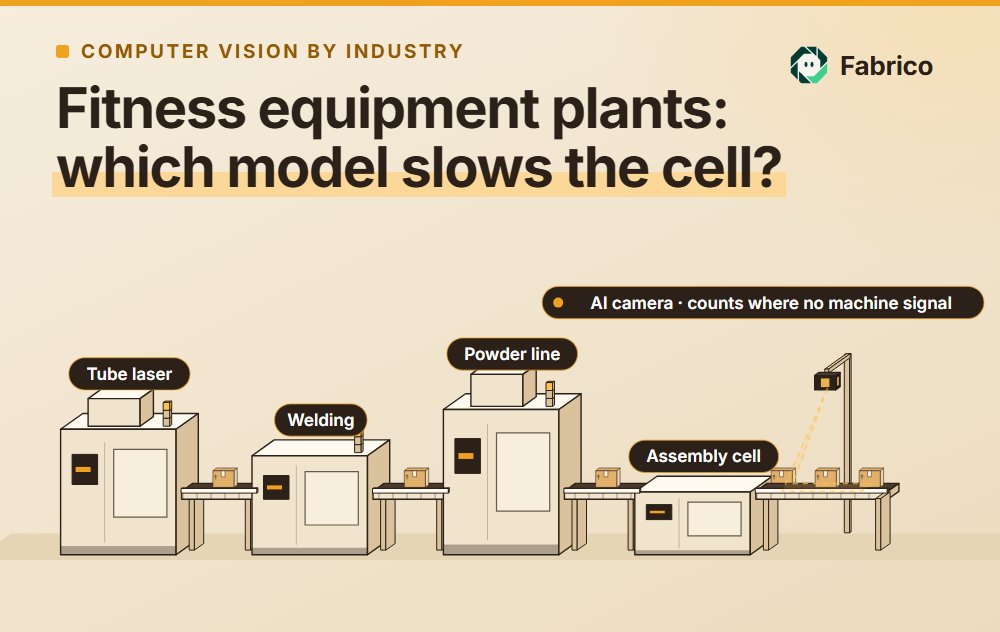
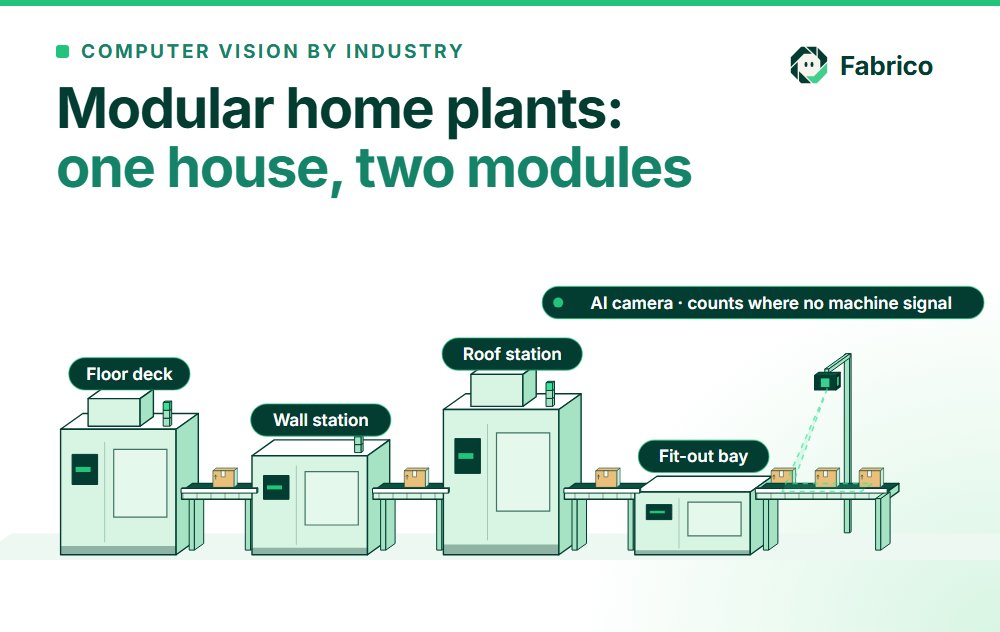
At a station with no usable machine signal, for example hand packing at the end of a line, the camera add-on counts output. Where the camera add-on covers the station, the video for the minute of a stop can be opened from the shift timeline, streamed on request and not stored in Fabrico.
-
Screen: a live OEE dashboard on a floor screen or tablet, plus the web and the iOS and Android apps.
-
Data and alerts: the machine's PLC or an IoT device with sensors, and stop reasons from operators; push, in-app and email notifications with smart rules.
-
Plan for: agreeing the list of stop reasons operators choose from, and which reason notifies which person.
For the measure behind the screen, see what OEE means.
Visual factory software comparison matrix: 7 tools side by side
The matrix puts the 7 tools side by side on the rows a plant manager asks about first. Each cell summarises the vendor page linked in its entry above, read on 16.11.2026. Where a cell says it is not stated, it was not found on the pages read; that says nothing about the product, so ask the vendor. Single-tool comparisons: Tulip alternatives, Vorne XL alternatives, an L2L review for food and beverage plants, MachineMetrics alternatives and Redzone alternatives; the wider list is in best OEE software.
| Tulip | Vorne XL | L2L | MachineMetrics | Redzone | iObeya | Fabrico | |
|---|---|---|---|---|---|---|---|
| Data source | Machine and PLC data over OPC UA or MQTT; edge devices; manual lines through apps | One or two sensors, or a photo-eye, relay, PLC or proximity switch | Machine pace and operator inputs | Machine control and PLC protocols; edge I/O | Downtime and throughput collected automatically; connection method: not stated on the pages read | Indicators entered on boards; data from other applications | The machine's PLC or an IoT device with sensors; camera add-on counts output |
| Live OEE, native | Yes, by line and by shift | Yes, among 140+ metrics | Six Big Losses in real time | Yes, against parts goal or OEE | Yes, every line, cell and shift | Not stated on the pages read | Yes, per line and shift |
| Stop reasons by operator | Yes, reason codes | Yes, by barcode scan or the XL HMI | Issues logged as Dispatches | Yes, on a tablet at the machine | Operators log context from the line | Not stated on the pages read | Yes, at the machine |
| Screen type | Apps and dashboards you build | Device state light; scoreboard on any TV or monitor; browser reports | Machine status dashboard; plant-wide banners | Colour-coded dashboards on shop floor monitors; operator tablets | Visual dashboards and digital huddles | Digital SQCDP boards and consolidated dashboards | Live OEE dashboard on a floor screen or tablet; customizable dashboards |
| Multi-plant view | Not stated on the pages read | A built-in report with every line in the enterprise | Yes, across lines and sites | Yes, across departments and locations | Not stated on the pages read | Consolidation from board to plant level | Multi-plant view and cross-plant benchmarking |
| Notifications | SMS, email or push, by trigger | Email reports; email or text alerts | Timed escalation by email, text, Teams, WhatsApp or browser | Text or email | Not stated on the pages read | Escalation of actions between levels | Push, in-app and email, with smart rules |
| Integration (API) | Connectors built with no-code editing | API; ERP and PLC data links | ERP connection across sites | Not stated on the pages read | SAP, Oracle and others via Boomi or Snowflake | Open API; MS Power Automate | REST API, webhooks, Zapier |
Read the first and fourth rows together: they decide what a floor screen can show. A screen fed by sensor counts shows the count and the gap; a screen fed by operator reasons and machine data can also show the reason and the owner, the two elements that turn a number into an action.
Worked example: what a faster response to a stop is worth
Sample figures for illustration only. A packaging plant makes printed laminate tubes for toothpaste and hand cream brands. Its tube line forms the printed laminate into a sleeve, welds the seam, then heads and caps each tube. The tube line is the plant's constraint: the printing press before it has spare capacity, and the plant sells the tubes it makes. It runs 3 shifts a day on 23 working days a month, with 450 minutes of planned production time a shift, and makes 125 good tubes a run minute.
Last month's stop log shows 5 stops a shift that need someone from outside the crew. The crew fetched help on foot or by radio, and the wait from the stop to the right person arriving was 9 minutes on average. Then a screen goes up at the tube line with target, actual, gap, the current stop reason and its owner, and the reason the operator gives sends a notification by rule to that owner. In the example, the wait falls to 4 minutes for each reason:
| Stop reason | Stops a shift | Owner | Wait before, minutes a stop | Wait after, minutes a stop | Minutes back a shift |
|---|---|---|---|---|---|
| Heading or capping fault | 2 | Maintenance fitter | 10 | 4 | 12 |
| Waiting for printed laminate | 2 | Forklift driver | 8 | 4 | 8 |
| Print or seam question | 1 | Shift lead | 9 | 4 | 5 |
| Total | 5 | 9 on average | 4 | 25 |
The repair takes as long as before; what shrinks is the wait before someone starts it. Those 25 minutes come back as run time on the constraint: 25 ÷ 450 = 5.56 points of availability, and 25 x 125 = 3,125 good tubes a shift.
In euros. Use a sample selling price of EUR 0.16 a tube with the 24.27% gross margin NYU Stern reports for US packaging and container companies (19 firms, January 2026 data). A tube then carries EUR 0.16 x 24.27% = EUR 0.038832 of gross margin, and a run minute 125 x EUR 0.038832 = EUR 4.854. The 25 minutes are worth 25 x EUR 4.854 = EUR 121.35 of margin a shift. Per month (69 shifts) and per year (12 x 69 = 828 shifts):
| Tube line | A shift | A month (69 shifts) | A year (828 shifts) |
|---|---|---|---|
| Run minutes back | 25 | 1,725 | 20,700 |
| Good tubes | 3,125 | 215,625 | 2,587,500 |
| Gross margin at stake | EUR 121.35 | EUR 8,373.15 | EUR 100,477.80 |
The margin is real money if the tubes would sell and the tube line is the constraint; on a machine with spare capacity, the same minutes cost wages, not output. A sector figure from 19 US companies is a stand-in: use your own SKU margin when you have it. The example also leaves out the people who wait with the line, and the second effect of a screen that shows the gap: a shift that sees it is behind can act before the end of the shift.
In Fabrico the same sum runs on the plant's own numbers: with the selling price and margin of each SKU entered, losses are priced in money. The euros sit above OEE, which stays a production measure.
How to choose visual factory software: 5 options and the effort each takes
The 7 tools fall into five kinds of visual factory software. Choose the kind first, by the decision the screen must support at the line, then compare the tools of that kind.
| Option | What it shows at the line | Rough effort (estimate) | Who picks it | Watch-outs |
|---|---|---|---|---|
| LED scoreboard at the line | Target, actual and a state light, from one or two sensors; reasons if a scanner or keypad is added | 4 to 8 hours a line of electrician and engineer time, plus the hardware | High-volume lines where one count drives the shift | A count says the line is behind, not why; plan how reasons are captured |
| Browser dashboard on floor screens | Status, counts and charts from data you already collect, on a large screen in each area | 16 to 40 hours to build and test the first dashboard, plus a screen and a small PC an area | Plants with an MES, historian or BI tool that already holds clean machine data | The screen is as current as its data source; check the refresh rate before it goes up |
| Digital whiteboard | Boards for the daily meeting: indicators, actions and escalations, updated by the team | 8 to 20 hours to move one area's boards, plus meeting time while the routine changes | Plants with a tiered meeting routine on paper boards today | Indicators typed in by hand trail the line; decide where machine data comes from |
| No-code app platform | Whatever you build: operator apps, dashboards and alerts | 40 to 120 hours for a first app with a machine connection, then the builder's time to keep it current | Plants with engineers who want to build their own tools | Every screen is yours to design, test and maintain |
| OEE platform | Live OEE per line and shift, stop reasons from operators, notifications by rule and a multi-plant view | 10 to 30 hours of plant time a line for the connection, the reason list and the notification rules, plus the vendor's work | Plants whose main question is why lines stop and who responds | Agree the stop reason list before the screens go up, or reasons will not compare across lines |
Effort is an estimate for one line or area, in plant-side hours, and it leaves out licences and hardware prices, which vary by vendor and plant. On the worked example, any option that cuts the wait from a stop to a response is measured the same way: minutes back on the constraint, times its margin a run minute.
Who picks which. The plant manager chooses between a count and a cause: a scoreboard answers whether the line is on target, an OEE platform answers why it is not and who responds. The production manager owns the reason list and the meeting the screen feeds, so a digital whiteboard is their call where meetings already run on boards. The CI engineer owns the measurement before and after, and is the person who builds and keeps an app platform current if the plant goes that way.
Questions to ask a visual factory software vendor:
- Show where each number on the floor screen comes from: the PLC, a sensor, a camera or a person.
- How does an operator give a stop reason at the line, and what does the screen show while a stop has no reason yet?
- Who is notified when a line stops, by which rule and on which channel, and what happens if nobody responds?
- Can one screen show target, actual, gap, reason and owner together, readable from a few metres?
- Can two plants be compared on the same definitions, and what does the API or export give us?
First steps by role: plant manager, production manager and CI engineer
A floor screen is measured by what people do differently in the shift. The table splits the first steps by role.
| Role | First week | First quarter |
|---|---|---|
| Plant manager | Pick one line and ask for two figures: its stops a shift that need help from outside the crew, and the average wait from the stop to the first responder. | Decide which of the five options fits each area, and review response times with the area owners every month. |
| Production manager | Write the reason list for that line's stops and name the owner of each reason. | Put target, actual, gap, reason and owner on a screen at the line, and run the shift meeting from it. |
| CI engineer | Time the wait from stop to response by reason, on paper or from the stop log. | Measure the same wait after the screen and the notification rules are in use, and price the minutes at the line's margin. |
This week, on one line:
- Choose the line whose stops wait longest for help.
- List last week's stops that needed someone from outside the crew, by reason.
- Name the owner of each reason: maintenance, logistics, quality or the shift lead.
- Time the wait from stop to response for each reason.
- Value a run minute of the line (good units a run minute x selling price x gross margin), then multiply by the minutes saved a shift, by the shifts in a month, and by 12 times that for a year.
- Show the five elements on a screen at the line, and repeat the timing a month later.
Summary: match the screen to the decision it supports
Visual factory software earns its screen when someone acts on it during the shift, and a screen at the line is as useful as the live machine data behind it. The review of production monitoring software that works in real time compares the tools that collect that data from the line.
Match the tool to the decision the screen must support:
-
A count at the line: a scoreboard fed by one or two sensors, as Vorne XL describes its device.
-
A board for the daily meeting: digital SQCDP boards, as iObeya describes them, for a plant whose meetings run on boards today.
-
A call for help that escalates: dispatch with timed escalation, as L2L describes it.
-
A screen you design yourself: a no-code app platform such as Tulip.
-
Why lines stop and who responds: an OEE platform with operator stop reasons, such as MachineMetrics for CNC machines, Redzone with shift huddles, or Fabrico with a light MES.
Whichever you pick, time the wait from a stop to a response before the screen goes up and again after it, and price the difference at the line's margin. That number, not the screen, is what the plant bought.
Frequently asked questions about visual factory software
What is visual factory software?
Visual factory software shows the live state of production on screens at the line and in the office: the target for now, the actual count, the gap between them, the reason for a stop and who owns the response. It takes its data from machines, sensors or people, and it ranges from scoreboards and digital boards to OEE platforms that also record stop reasons and send notifications.
Is visual factory software the same as a dashboard?
No. A dashboard is one part of it. Visual factory software puts the signal where the decision is made, at the line, and pairs the gap with its reason and an owner, so the screen prompts an action rather than a report. A dashboard nobody stands in front of changes nothing in the shift.
What should a plant floor screen show?
Five things, readable from a few metres: the target for this point in the shift, the actual good count, the gap between them, the reason for the current stop and the person who owns the response. Output alone is a scoreboard; output against target with a reason and an owner is a prompt to act.
LED scoreboard or browser dashboard: which suits the shop floor?
An LED scoreboard suits a line where one number, target against actual, drives the shift and one or two sensors can supply it. A browser dashboard on a floor screen suits a line where people also need the stop reason, the owner and the trend, and where the same view must open on a tablet or in the office. The two can run side by side: the scoreboard for the count, the dashboard for the reasons.
What should you ask a visual factory software vendor?
Ask where each number on the screen comes from (the PLC, a sensor, a camera or a person), how an operator gives a stop reason, who is notified by which rule and on which channel, whether two plants can be compared on the same definitions, and what the API or export gives you. Ask to see each answer on a screen, not on a slide.
How does visual factory software connect to OEE?
OEE gives the number, and the floor screen makes it visible while the shift can still change it. Availability, performance and quality shown live at the line, with the reason for each loss, turn the metric into a decision during the shift instead of a report the next day. See the OEE guide.
How should a plant start with visual factory software?
Start with one line and one screen that shows target, actual, gap, reason and owner, and agree who responds to which reason before the screen goes up. Add the next line when the first screen is used in the shift meeting and the wait from a stop to a response has been timed before and after.
To see a live OEE dashboard on a floor screen, with stop reasons from operators and notifications by rule, book a demo.
Related articles


Latest from our blog


Real Fabrico tiles, sample data.