


 Login
 Blog
How to Evaluate OEE Software: Features, Data and ROI
TL;DR
Evaluating OEE software comes down to one test on your own line: does the product log every stop with its start, end and cause, and give an OEE number you can check by hand against one shift? Then score alerts, work orders, reports and integration, and build the ROI from the hidden minutes it finds.
- Score every vendor 0, 1 or 2 on ten criteria; a 2 means shown on your plant's data.
- Real time means every stop, short ones included, appears within seconds with its start and end.
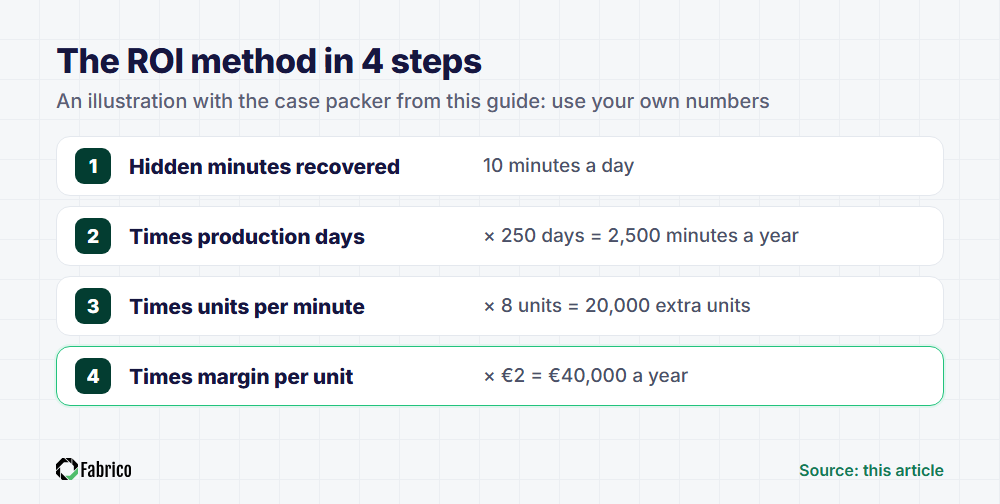
- ROI = hidden minutes recovered × production days × units per minute × margin per unit.
- Prove it in a 30-day pilot on the line that limits output.
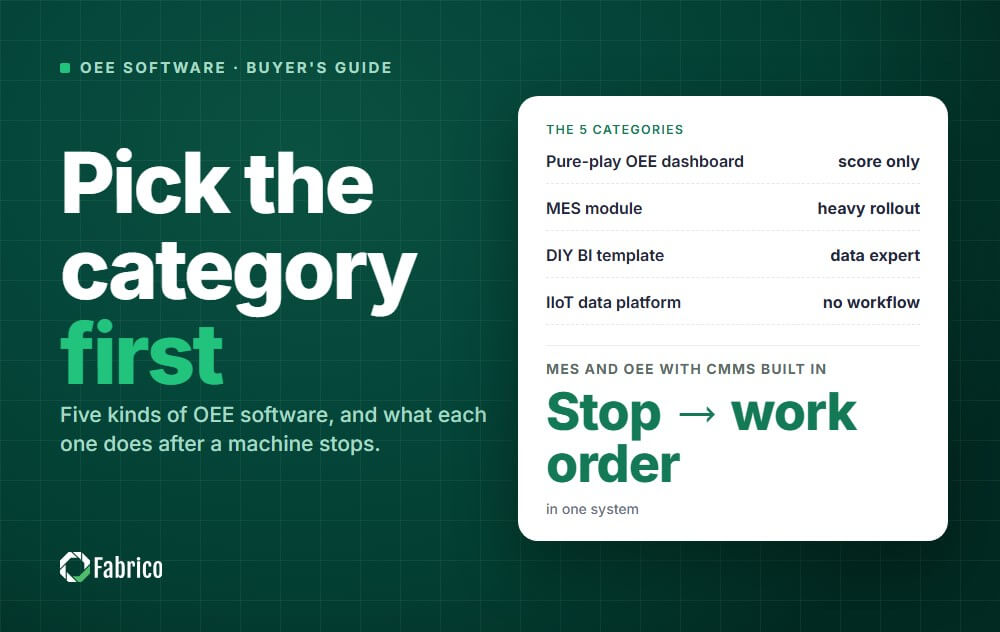
Still deciding what kind of tool you need? Our guide to the best OEE software sorts the market into five categories. This page shows how to test the products on your shortlist and prove the business case.
The OEE software evaluation scorecard
Most demos look alike, so score every product on the same criteria straight after each one. Use a three-point scale:
- 0: the vendor cannot show it, or only describes it.
- 1: shown on the vendor's own demo data.
- 2: shown working on data from one of your lines.
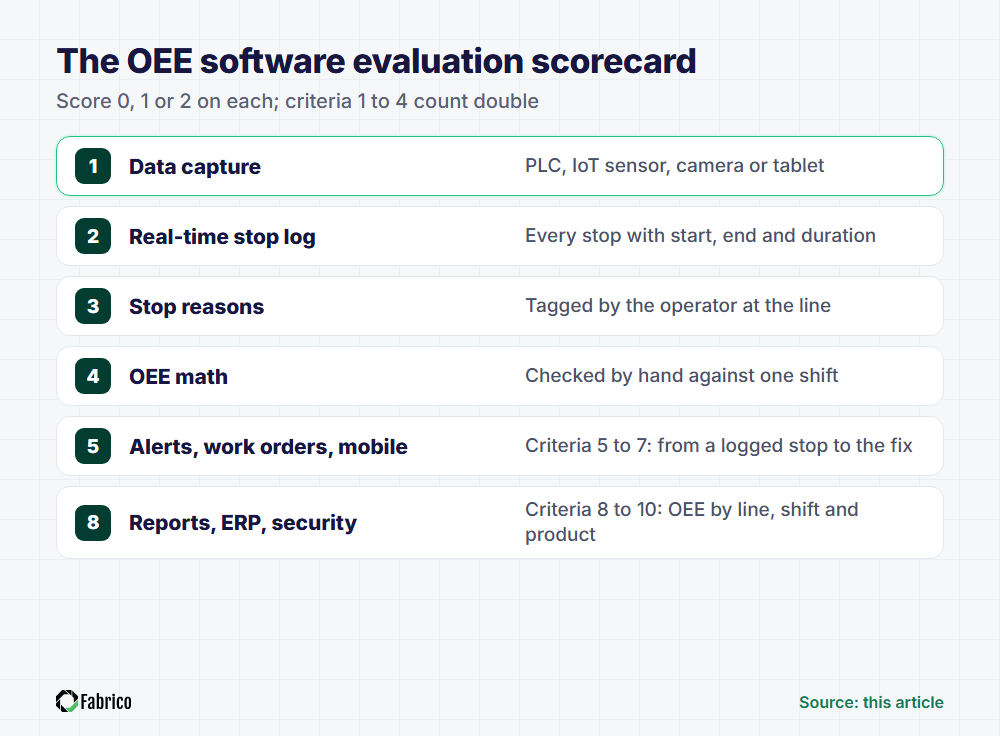
Count the first four criteria double. Every report and alert is built on them.
OEE software features: what to check in the demo
Send this table to each vendor a week ahead, as the demo script for your plant.
| Feature | What to check in the demo | Why it matters |
|---|---|---|
| 1. Data capture | The method per machine: PLC, IoT sensor, camera or tablet | Old and new machines rarely share one method |
| 2. Real-time stop log | Each stop within seconds, with start, end and duration | Short stops rarely reach a paper log |
| 3. Stop reasons | An operator tags the cause on a tablet, in a few taps | Without a cause, nobody knows where to send people |
| 4. OEE math | Your own shift entered live, with every step shown | Nobody acts on a number they cannot check |
| 5. Alerts | A rule set up live: which stop, after how long, to whom | A long stop costs most before the right person hears |
| 6. Stop to work order | A technician opens a CMMS work order from the logged stop | The repair keeps the stop's time and cause |
| 7. Mobile | Operator and technician screens on a tablet and a phone | Reasons typed after the shift come from memory |
| 8. Reports | OEE by line, shift and product, down to the stops | Averages blur the line or shift that loses most |
| 9. ERP integration | Which data moves each way, and who maintains the link | Products and orders need one source |
| 10. Security | Hosting region, access rights and ISO certificates | IT will ask before any machine is connected |
Red flags during a demo
- The demo only runs on the vendor's own data.
- OEE is one figure, with no availability, performance and quality behind it.
- Short stops vanish into a "minor stops" bucket with no times.
- "Real time" means a screen that refreshes every few minutes.
OEE data collection: getting a number you can trust
Everything later depends on this step: if the software misses stops, the dashboard is wrong in a way nobody on the floor can see.
Four ways to collect OEE data
- PLC signals: the controller knows when the machine runs, stops and cycles; the first choice for modern machines.
- Add-on IoT sensors: on power draw, a stack light or a part counter, for older machines.
- Cameras: for manual or hybrid stations with no signal to read.
- Tablet entry: quick to start but weak on short stops, so treat it as a bridge.
Most plants need a mix: a filler's modern PLC can be read directly, while the old press beside it needs a sensor. Our guide to machine monitoring systems explains each method.
What "real time" should mean
Four checks separate genuine OEE monitoring software from a report generator:
- A stop shows on screen within seconds.
- Every stop has a start, an end and a duration.
- Short stops are logged one by one, above a threshold you set.
- Counts arrive per cycle, so slow running shows up during the shift.
On a CNC cell, a 40-second stop to clear chips never makes the paper log, but twenty of them cost more than 13 minutes a shift. Our guide to micro stops shows how to cut them.
Stop reasons from the operator
The signal says when a line stopped; only a person can say why: no material, a jam, a changeover. Ask for the reason at the line, during the stop, on a tablet.
Signal plus reason is what good downtime tracking software delivers. Without the reason, your downtime Pareto is guesswork.
Check the OEE math against one shift by hand
Write down one real shift and ask each vendor to enter it and show every step. In this illustration (use your own numbers), a case packer has 450 planned minutes: a 480-minute shift minus a 30-minute break.
It stops for 45 minutes, its ideal rate is 10 units a minute, and it makes 3,240 units, 3,078 of them good.
| Factor | Calculation | Result |
|---|---|---|
| Availability | 405 min running ÷ 450 min planned | 90% |
| Performance | 3,240 units ÷ (405 min × 10 units a minute) | 80% |
| Quality | 3,078 good ÷ 3,240 total | 95% |
| OEE | 90% × 80% × 95% | 68.4% |
| Cross-check | 3,078 good × 0.1 min ideal cycle time ÷ 450 min | 68.4% |
If the software disagrees, ask how it sets planned time, ideal rates, the short-stop cut-off and changeovers. Each one moves OEE without changing anything on the floor.
For the full formula, see our OEE calculation guide and the Six Big Losses. New to the metric? Start with what overall equipment effectiveness is.
From a stop to a fix: alerts, work orders, reports and ERP
A correct OEE number is only a diagnosis. Test the path from a logged stop to the CMMS work order that fixes it.
Alerts to the right person
Ask the vendor to build one rule live: if the filler stops for more than 10 minutes with a mechanical reason, notify the shift technician. Rules should target a line, reason and duration, not everyone.
A CMMS work order straight from the stop
This hand-off is where a stop usually loses its detail: the repair is requested by phone, and the record in the CMMS never links back to the lost minutes.
In the demo, open a work order from a logged stop and check that the machine, start time and reason carry over. Our comparison of integrated OEE and passive scoreboards explains why this link matters.
Mobile on the floor
Operators and technicians work at the machine, so both need tablet and phone screens. Try the operator screen yourself in the demo.
Reports, ERP and security
Ask for last week's OEE by line, shift and product, then click from the worst number to its stops. If that needs a spreadsheet export, nobody will do it daily. For cross-site analysis, see our roundup of manufacturing analytics software.
Ask which data moves to and from the ERP and who maintains the link. Then ask where data is hosted, who sees which plant and which ISO certificates the vendor holds.
How to build the ROI case for OEE software
You do not need industry averages. The case comes from your own line: the minutes you lose without knowing it, and what an extra minute of output is worth.
The ROI method in four steps
- Hidden minutes recovered: stop time your log misses that you expect to win back each day. Estimate it from an operator study, then measure it in the pilot.
- × production days: the days the line runs in a year.
- × units per minute: the real output rate, not the nameplate speed.
- × margin per unit: if you can sell the extra units. If not, value the minutes as overtime or outsourcing avoided.
An illustration, use your own numbers
Take the case packer above: its paper log shows 25 of the 45 stop minutes, and the other 20 are short stops nobody wrote down. It runs one shift a day, 250 days a year, at a real 8 units a minute.
- Recover half of the 20 hidden minutes: 10 minutes a day.
- 10 minutes × 250 days = 2,500 minutes a year.
- 2,500 minutes × 8 units a minute = 20,000 extra units.
- 20,000 units × a €2 margin per unit = €40,000 a year.
Set that against the full first-year cost: subscription, sensors, installation, integration and your team's time. Our guide to what OEE software costs explains what drives each part.
Count only the line that limits output, because a minute saved on a machine that waits for work produces nothing. Add maintenance savings only where stops become CMMS work orders and repeat causes get fixed.
Machine monitoring ROI
Machine monitoring ROI uses the same arithmetic. Monitoring finds the minutes in step 1, but the value in step 4 only arrives when someone acts on each stop.
Run a 30-day pilot on one line
A demo shows what the software can do; a pilot shows what it does on your line, with your operators, on every shift. Agree the pass criteria in writing before day one.
Week by week
- Week 1, data flowing: connect the ready signals, use tablet entry where sensors are on order, agree the reason list and check OEE by hand.
- Week 2, every stop tagged: review the stops with no reason every day.
- Week 3, act: take the top three losses to the daily meeting, open work orders from stops and switch on alerts.
- Week 4, decide: compare week 4 with week 1 and rerun the ROI with measured minutes.
What the pilot must prove
- The data holds: stops and counts arrive every shift without manual fixes.
- Operators use it: the share of stops with no reason falls week by week.
- The losses have names: the top three causes, with the minutes against each.
- Someone acted: CMMS work orders were opened from logged stops, and at least one cause was fixed.
- The case holds: the rerun ROI still covers the first-year cost.
Mistakes that sink an evaluation
- Buying the dashboard. Every demo dashboard looks good; the stop log decides whether yours will.
- Piloting the easiest line. Pick the bottleneck, where minutes are worth money.
- Leaving operators out. If they first see the screen on go-live day, the reasons will be poor.
- Tuning the score. Changing planned time or ideal rates lifts the report, not the line.
Frequently asked questions
What is the difference between OEE software and MES?
An MES runs and records production across orders, materials, quality and labour. OEE software measures how well each machine uses its planned time and shows the losses. Fabrico combines both, with CMMS built in, and our MES software guide compares the options.
How long does it take to implement OEE software?
It depends mostly on how your machines connect. With Fabrico, for OEE with hardware, connecting the machines takes about a month and the full rollout 3 to 4 months. Ask every vendor for a dated plan.
Can OEE software connect to my older factory equipment?
Yes, in most cases. Where the PLC cannot be read, an add-on IoT sensor on power draw, a stack light or a part counter gives run state and counts, and a camera covers manual stations. Operators add the reason on a tablet.
How much does OEE software typically cost?
Pricing usually scales with the number of machines, lines or sites, mostly as a yearly subscription. The full cost adds sensors, installation, integration and your team's time. Compare vendors on the total first-year cost for the same pilot scope, against your own ROI.
How do you calculate machine monitoring ROI?
Multiply the hidden stop minutes you expect to recover each day by the production days per year, the real output per minute and the margin per unit. Compare the result with the full first-year cost, and count only the line that limits output.
What is the best way to collect OEE data?
Automatically wherever possible: the PLC on modern machines, an add-on IoT sensor on older ones and a camera on manual stations. That gives every stop a start and end time, short ones included. The operator adds what no signal can give: the reason.
Do I need a CMMS as well as OEE software?
You need both jobs done: OEE software finds and measures the losses, and a CMMS manages the repairs and preventive maintenance that remove them. As two systems, stops get retyped into work orders, which is why Fabrico builds the CMMS into the same platform.
Where Fabrico fits
Fabrico is a cloud-based MES and OEE platform with maintenance management (CMMS) built in. It logs stops automatically from the PLC, an IoT sensor or a camera, operators tag stop causes on a tablet, and a technician opens the work order straight from the logged stop.
Fabrico is hosted on AWS in an EU region and holds ISO/IEC 27001, ISO/IEC 20000-1 and ISO 9001 (DNV).
Customer results: ABB, 20% less downtime; Ficosota, factory-wide OEE from 53.1% to 59.6%. See the MES and OEE platform overview and how machines connect.
Bring one of your shifts to the demo and score Fabrico on the same criteria.
See how Fabrico works: an MES and OEE platform with maintenance (CMMS) built in.
Request a demoContact usRelated articles





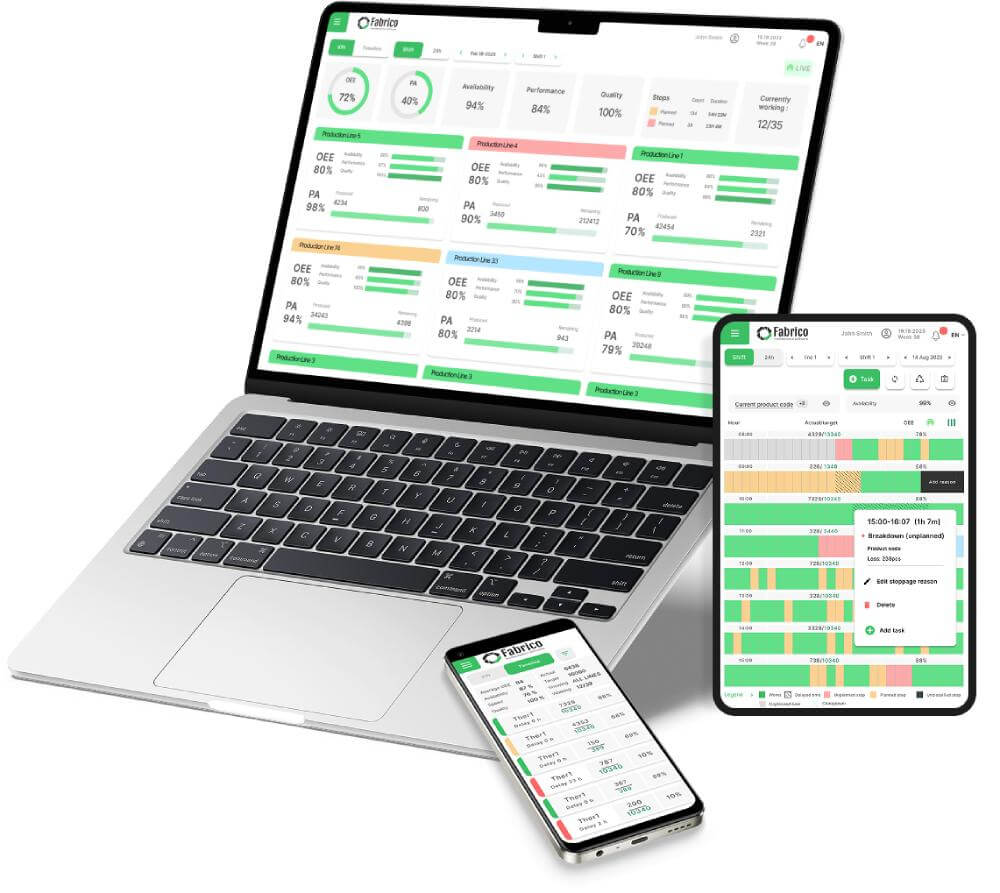








Real Fabrico tiles, sample data.