


 Login
 Blog

The Visual Factory: How to Make Production Problems Visible (2026 Guide)

Key takeaways
- A visual factory makes the state of production readable where the work is done, so a problem is seen and owned at the station, at the line or in the daily meeting.
- Build it in five layers, by the decision each one supports: floor marks and shadow boards (seconds), the line status signal (minutes), target vs actual and OEE at the line (within the shift), visual standards for setups and changeovers (per changeover) and the daily tier board (per day).
- Each layer catches a different loss with a known place in OEE: waiting and setup time in availability, short stops and slow running in performance, scrap and rework in quality.
- Worked example (sample figures): a photo standard for the first-off check on a socket line cuts the wait for release from 14 to 5 minutes and first-off rejects from 32 to 8 a changeover; OEE rises from 63.42% to 67.17%, worth EUR 525.03 of margin a shift and EUR 396,923 a year, if the extra sockets would sell.
- Build first the layer that matches the largest loss in your own records, and measure that loss before and after.
A visual factory is a manufacturing plant where the state of production can be read at the place where the work is done: where each tool belongs, which line needs help, how far the shift is from its target, how a setup should look and which losses keep returning. It is visual management applied to a whole plant. The Lean Enterprise Institute's lexicon defines that principle as the placement in plain view of all tools, parts, production activities and indicators of production system performance, so the status of the system can be understood at a glance by everyone involved.
The test of a visual factory is what people do with what they see. A floor mark tells an operator where a trolley goes. A light at the line calls a team leader. A screen tells the shift it is behind while the shift can still recover. A photo at the machine shows a setter what the first good part looks like. A board in the morning meeting turns yesterday's losses into actions with owners.
This guide builds the visual factory in five layers, sorted by how fast each one acts: seconds at the station, minutes at the line, within the shift, per changeover and per day. For each layer it names the loss the layer catches and where that loss sits in OEE. It then prices one layer in euros, a photo-based first-off check after a changeover on a socket assembly line, and ends with a decision table, first steps by role and a checklist for this week.
Visual factory examples: five layers and the decision each one supports
Each example of a visual factory on a shop floor does one job: it shows one person, at one place, what needs a decision now. Sorted by how fast that decision has to be made, the examples fall into five layers. The table gives, for each layer, what it shows, how fast it acts, the loss it catches, where that loss sits in OEE and who owns it.
| Layer | What it shows | Decision speed | Loss it catches | Where the loss sits in OEE | Who owns it |
|---|---|---|---|---|---|
| 1. Floor marks and shadow boards | Where each tool, gauge, change part, trolley and aisle belongs; an empty outline when something is missing | Seconds, at the station | Searching for tools, gauges and change parts | Availability: searching during a changeover lengthens the setup | Team leader of the area |
| 2. Line status signal (andon as a method) | Which line or station needs help, and for what reason | Minutes, at the line | Waiting for help after a stop | Availability (downtime), or performance where the plant books stops below a set length as short stops | The person named to respond to each call reason |
| 3. Target vs actual and OEE at the line | Planned count by now, good count, the gap, the current stop and its reason; availability, performance and quality for the shift | Within the shift | Short stops, slow running and a gap that grows unnoticed | Performance, with all three factors shown live | Shift lead |
| 4. Visual standards for setups and changeovers | Photos of the settings and of the approved first part, with the features to check marked | Per changeover | Adjustments, the wait for first-off release and first-off rejects | Availability (setup and adjustment) and quality (scrap and rework) | Setter, with quality approving the photos |
| 5. Daily tier board | Yesterday's losses by reason, and actions with owners and dates, by level | Per day | Losses that repeat because nobody owns their cause | All three factors, as trends by line | Production manager (tier 2) and plant manager (tier 3) |
The OEE column follows the Lean Enterprise Institute's definition of overall equipment effectiveness. The availability rate measures downtime losses from equipment failures and adjustments as a share of scheduled time; the performance rate measures running below design speed and stoppages lasting a few seconds; the quality rate expresses losses due to scrap and rework as a share of total parts run. Placing each layer's loss in one of those three factors is what makes a visual factory measurable: a layer earns its place when its factor moves.
The layers lean on each other: short setups make the changeover standard worth having, the line signal brings help to a stop, the screen shows whether the shift is still on target, and the tier board decides what to fix for good. They can be built in any order.
Layers 2 and 3 need live data behind the signal. OEE software records when a machine runs and how many units it makes, from the machine's PLC or an IoT device with sensors on the machines you connect, and the operator names the reason when the line stops. The video below walks through a sample shift: the timeline, time still waiting for a reason, and the screen where an operator logs why the line stopped.
What you see: a shift timeline, unclassified time waiting for a reason, and the operator's line-down screen, on sample lines. Book a demo.
Plays from YouTube. Google may set cookies when you press play. Privacy policy.
Layer 1: floor marks and shadow boards, read in seconds
The fastest layer needs no screen and no data. Lines on the floor, labels on racks and painted outlines show where each thing belongs, so anything missing or out of place is seen by whoever walks past. The U.S. Environmental Protection Agency's lean guide to 5S lists the strategies for its set-in-order step: painting floors, affixing labels and placards to designate proper storage locations and methods, outlining work areas and locations, and installing modular shelving and cabinets.
Some floor marks are law before they are lean. In the United States, where mechanical handling equipment is used, 29 CFR 1910.176(a) requires permanent aisles and passageways to be appropriately marked, and 29 CFR 1910.144 makes red the basic colour for danger signs and for emergency stop buttons and bars, and yellow the basic colour for designating caution and marking physical hazards. A plant that also uses colours for production status should keep those meanings apart, so that red on the floor and red over a line never ask the same person for two different things.
A shadow board applies the same idea to tools. Each tool hangs on its painted outline, so an empty outline shows what is missing before a changeover starts rather than halfway through it. Put the board at the machine it serves, with the change parts and gauges for that machine on it, each with its outline and label.
The loss this layer catches is searching: for a gauge, a change part, a pallet place or the right bin. Searching during a changeover lengthens the setup, and OEE counts setup and adjustment time against availability. The decision takes seconds, at the station, and the owner is the team leader of the area, who looks over the marks and boards at the start of the shift.
Layer 2: the line status signal, andon as a method
The andon comes from the Toyota Production System. Toyota describes jidoka, one of the system's two pillars, as stopping when an abnormality is detected so that defective products are not produced: when a machine, quality or work-delay abnormality occurs, the machine can stop itself, or an operator can halt the line with the stop cord.
Toyota UK's production system guide defines the andon as a visual aid that highlights where action is required: an illuminated signal that notifies others of a problem, shown on an overhead signboard that also identifies the area or workstation with the problem. In a reply on the same page, Toyota UK adds that pulling the cord alerts the team leader, who has a period of time to address the issue, and that the line stops if the issue cannot be resolved.
As a method, an andon needs three parts: a way to raise the call at the station, a signal that the people who respond can see or receive where they work, and a named person for each kind of call. A cord, a button, a light over the machine and a screen are all ways to deliver the same method.
A generic example, not a description of any product: line 4 stops on a jam. The operator presses the call button, the light over line 4 turns red, and the board at the end of the hall shows the line, the reason and how long the call has been open. The team leader for that area sees it from the aisle and goes to the line, with no radio call and no walk to the office.
The loss this layer catches is waiting: the time between a stop and the arrival of the person who can clear it. In OEE that time sits in availability as downtime, or in performance where the plant books stops below a set length as short stops. The decision speed is minutes, and the owner is the person named for each call reason: the team leader for a jam, a setter for a format problem, a fitter for an electrical or mechanical fault, a forklift driver for missing material. Agree that list before the first light goes up; the guide to andon system design covers call reasons and escalation.
Layer 3: target vs actual and OEE at the line
A shift that learns its numbers the next morning cannot change them. The third layer puts the shift's own numbers at the line while it runs: the planned count by now, the good count, the gap between them, and the current stop with its reason.
Behind the gap sits OEE, the product of availability, performance and quality. Shown for the shift, the three factors tell the people at the line which kind of loss is eating the target: stops, slow running and short stops, or scrap and rework.
- Put the screen where the people who can act will see it, at the end of the line and readable from the aisle.
- Show target and actual in units, and the gap, so nobody has to do the sum.
- Show the current stop, its reason and how long the line has been waiting.
- Keep the trend for the shift, so a slow hour shows at the next break and not at the end of the shift.
A screen shortens the time between a loss and someone seeing it. It does not by itself make a line run faster, and OEE shown live is still a record of what has already happened. Its value is the lag it removes: the shift sees the gap while there is still time in the shift to act on it.
Some losses are too fast to see on a walk past. A stop of a few seconds, repeated through a shift, leaves no trace in a paper log, and the Lean Enterprise Institute's definition places stoppages lasting a few seconds in the performance rate. Those losses appear when the count comes from the machine, not from memory.
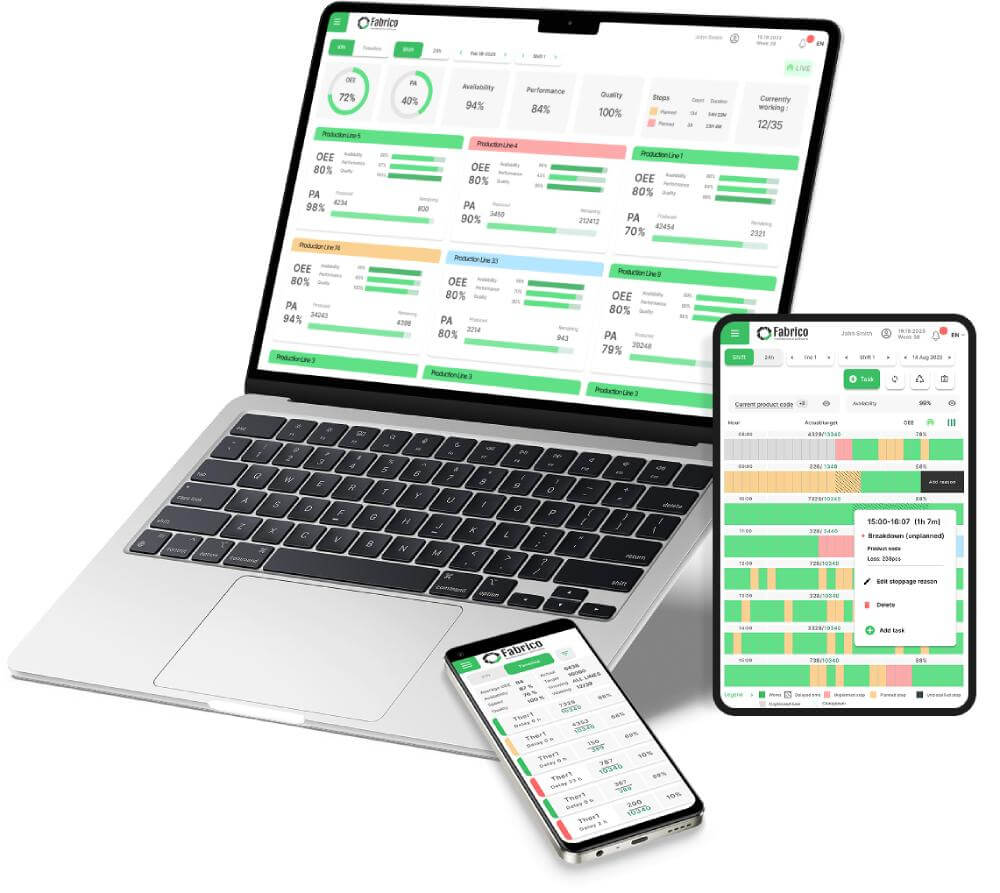
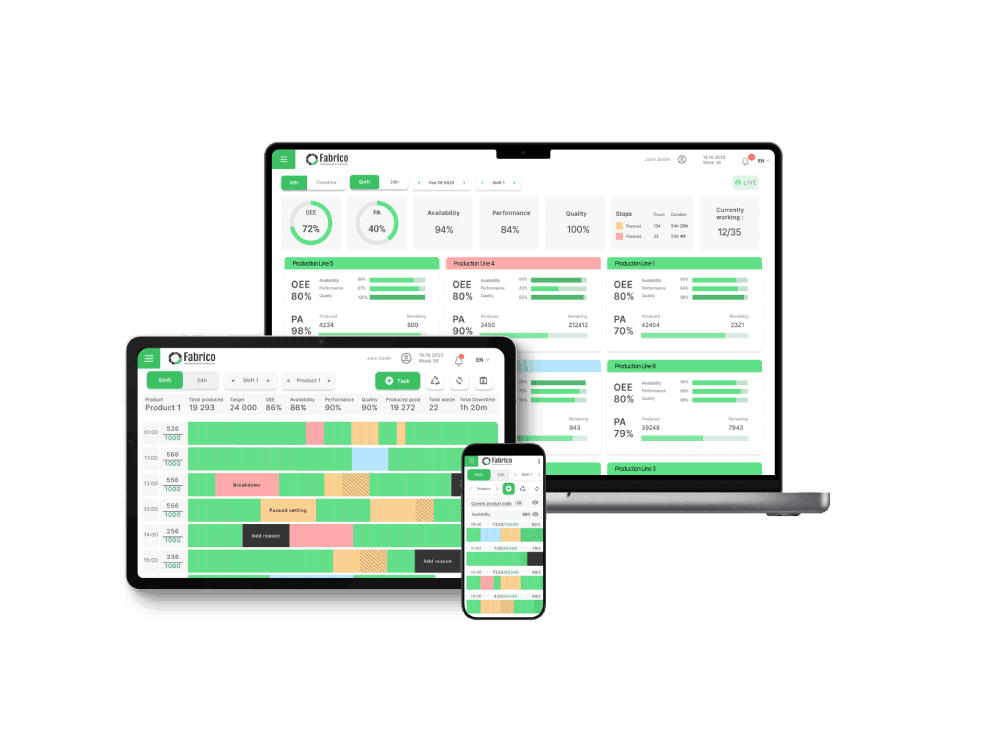
Fabrico, an OEE platform with a light MES, delivers this layer as a live OEE dashboard on a floor screen or tablet, with notifications by rule. Its view is real-time OEE (availability x performance x quality) per line and shift, with micro-stop detection and the six big losses made visible, built from the machine's PLC or an IoT device with sensors on the machines you connect. Operators give the stop reasons at the line, and push, in-app and email notifications with smart rules reach the person who responds.
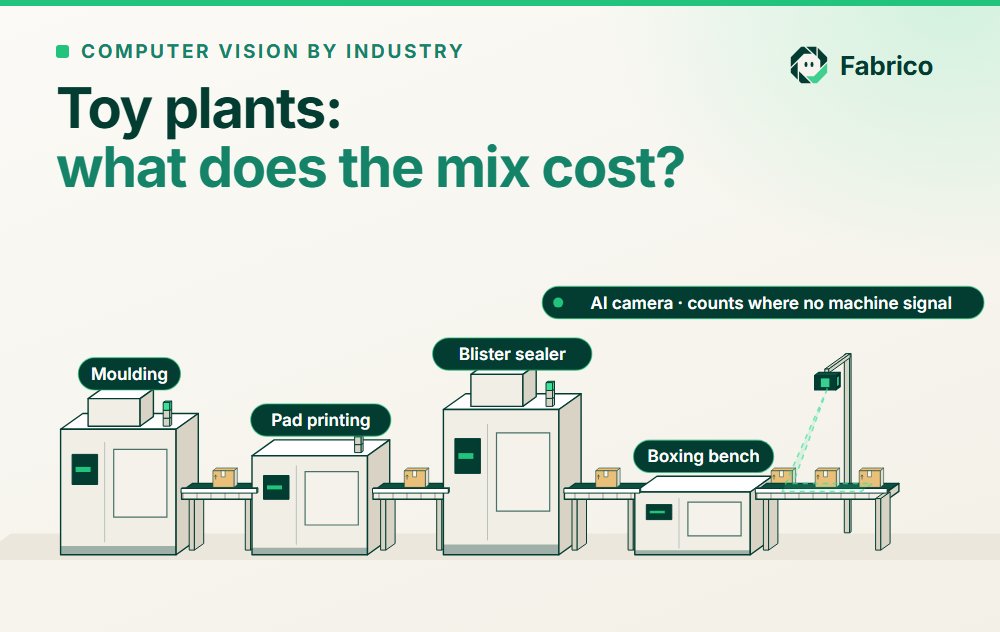
On a manual station with no usable machine signal, the camera add-on counts what the station produces. Where the camera add-on covers the station, the video for the minute of a stop can be opened from the shift timeline, streamed on request and not stored in Fabrico.
Layer 3 catches the gap that grows unnoticed during a shift: slow running, short stops and stops nobody called. The decision is made within the shift, and the owner is the shift lead, with the production manager reading the trend across shifts. Tools for this layer are compared in the review of visual factory software.
Layer 4: visual standards for setups and changeovers
Visual work instructions show a task in photos or drawings, with the text cut to what a picture cannot say. The evidence for pictures is real but narrow. In a laboratory study with 66 university students, published in the Australasian Journal of Educational Technology in 2013, manuals that combined text with pictures, or text with pictures and arrows, beat text alone: they led to faster assembly and operation and reduced errors, extra procedures and unsuccessful assemblies. The author reads the results as partial support. Students assembling an unfamiliar object are not setters on a production line, so take the result as a direction for design, not as a plant figure.
On a production line, the natural place for pictures is the changeover, because that is when a line switches to a new product and its settings, labels and parts change at once. A visual standard for a changeover has two parts: photos of the settings that matter, such as guide positions, plates, nozzles or a gauge reading, and a photo of the approved first part with the features to check marked on it.
At the first-off check, the photo lets the person at the line compare the first parts with the standard on the spot, instead of waiting for someone to bring the specification. Quality keeps ownership of the standard: it approves each photo and changes it when the specification changes. The checks stay the same; the wait for them gets shorter.
The losses this layer catches are adjustments, the wait for first-off release and first-off rejects. By the Lean Enterprise Institute's definition, adjustment time counts against availability, and scrap and rework against quality, so one visual standard can move two OEE factors at once. The decision is made per changeover, and the owner is the setter who does the change. The case for timing that wait step by step is made in first off approval after changeover.
Worked example: a photo-based first-off check on a socket line, in euros
Sample figures for illustration only. The plant in this example makes flush-mounted wall sockets in several colours and versions on one automated line that fits the insert, base and cover and pad-prints the rating on each socket. The line is the plant's constraint, and the plant sells what it makes. It works 21 days a month in 3 shifts, with 440 minutes of planned production time a shift, an ideal rate of 40 sockets a minute and a performance rate of 85% while it runs. Each shift has 2 changeovers between versions, each with 20 minutes of mechanical change, the part of a changeover that SMED works on.
Before: after each change the operator runs the first sockets, and the line waits for someone from the quality team, who checks them against a drawing and a written specification. The wait from the first sockets to the release averages 14 minutes, and last month's records show 32 first-off rejects a changeover on average: a wrong cover colour or an offset print, found after the sockets were made.
After: quality approves one photo standard per version, with the cover colour, the print position and the rating text marked on it, and the photos hang at the end of the line. The operator compares the first sockets with the photo and the shift lead signs the release, where the plant's quality system names the shift lead as authorised to release. The wait falls to 5 minutes, and a wrong setting shows on the first few sockets, so first-off rejects fall to 8 a changeover. Other stops (40 minutes a shift) and other rejects (62 a shift) stay as they were.
| Per shift | Before | After |
|---|---|---|
| Changeovers a shift | 2 | 2 |
| Mechanical change, minutes a changeover | 20 | 20 |
| Wait for first-off release, minutes a changeover | 14 | 5 |
| First-off rejects a changeover | 32 | 8 |
| Other stops, minutes a shift | 40 | 40 |
| Run time, minutes (440 planned) | 332 | 350 |
| Sockets made (run time x 40 x 85%) | 11,288 | 11,900 |
| Rejects (first-off plus 62 others) | 126 | 78 |
| Good sockets | 11,162 | 11,822 |
| Availability | 75.45% | 79.55% |
| Performance | 85% | 85% |
| Quality | 98.88% | 99.34% |
| OEE | 63.42% | 67.17% |
Run time rises by 18 minutes a shift (2 changeovers x 9 minutes), which adds 18 ÷ 440 = 4.09 points of availability (the table rounds both values). Quality rises from 98.88% to 99.34%, because the first-off check rejects 48 fewer sockets a shift. Performance does not change. OEE moves from 63.42% to 67.17%; as a check, OEE also equals good sockets ÷ (440 minutes x 40 a minute), 11,162 ÷ 17,600 before and 11,822 ÷ 17,600 after.
The 660 extra good sockets a shift come from two places: 18 minutes of run time at 40 a minute and 85% performance make 612 more sockets, and the first-off check rejects 48 fewer.
In euros. Take a sample selling price of EUR 2.50 a socket and the 31.82% gross margin NYU Stern reports for US electrical equipment companies (112 firms in the January 2026 data set). A socket then carries EUR 2.50 x 31.82% = EUR 0.7955 of gross margin, and 660 sockets carry 660 x EUR 0.7955 = EUR 525.03 a shift. For a month of 63 shifts and a year of 12 x 63 = 756 shifts:
| Socket line | Per shift | Month, 63 shifts | Year, 756 shifts |
|---|---|---|---|
| Good sockets gained | 660 | 41,580 | 498,960 |
| Gross margin at stake | EUR 525.03 | EUR 33,076.89 | EUR 396,922.68 |
The margin counts as money only if the line is the constraint and the extra sockets would sell; on a line with spare capacity, the same minutes save overtime and wages, not margin. The sum also leaves out the material in the scrapped sockets, which would add to it. The 31.82% is an average across 112 US companies, so use your own SKU margin when you have it.
With the selling price and margin of each SKU entered, losses are priced in money in Fabrico; OEE stays a production measure, and the money is a layer above it.
Layer 5: the daily tier board, per day and per level
The slowest layer is a meeting at a board. In a 2019 Chalmers paper on designing daily visual management, Kurdve and colleagues describe daily visual management meetings held at visual management boards and implemented at different management levels, such as the operator team and plant management. Citing earlier research, they note that Swedish large and medium manufacturers typically use 5 to 19 KPIs in 4 to 8 categories at operator team level, with safety, quality and delivery the categories updated most frequently, and that OEE is a widely used KPI for internal efficiency.
A tier board turns the other four layers into decisions that take longer than a shift. At tier 1, the team at the line reviews the day before: the gap by hour, the top stop reasons and the changeovers that missed their standard. What the team cannot close goes up to tier 2, the production manager's meeting, and from there to tier 3, the plant manager's. Each action on the board carries an owner and a date.
The loss this layer catches is the repeat: the stop reason that returns day after day because nobody owns its cause. Repeats can sit in any OEE factor, so the board shows the trend of all three by line, and a few measures the team can change rather than every measure the plant collects. The decision is made per day; the owner is the production manager at tier 2 and the plant manager at tier 3. How to run the meetings themselves is covered in tier board meetings.
Which visual factory layer to build first
Start where the largest loss is, not where the most visible tool is. One week of stop and reject records for one line is enough to rank the layers: compare the minutes lost waiting for help, the minutes of short stops and slow running, the minutes of changeovers and the units rejected after them.
| Option | Build it first if | Rough effort (estimate) | Who should pick it | Watch-outs |
|---|---|---|---|---|
| Floor marks and shadow boards | Changeovers wait while people search for tools, gauges or change parts | 8 to 16 hours of team time per area, plus paint, labels and boards | Team leader, with the area team | Outlines nobody restores after a layout change; look at them at the start of the shift |
| Line status signal | Stops wait longer for help than for the repair itself | 16 to 40 hours per line to agree call reasons and responders, plus lights or buttons | Production manager | A light with no named responder turns into noise |
| Target vs actual and OEE at the line | The shift learns its numbers the next day | 10 to 30 hours of plant time per line for the machine connection, the stop reason list and the screen, plus the supplier's work | Plant manager, with the production manager | A screen without stop reasons shows that the line is behind, not why |
| Visual standards at changeover | First-off rejects or the wait for release are a large share of changeover time | 4 to 8 hours per product version for photos, marking and quality approval | Quality lead, with the setters | A photo not updated with the specification becomes a wrong standard |
| Daily tier board | The same losses return day after day with no owner | 8 to 20 hours to design the board and the meeting, then meeting time each day | Plant manager | Too many measures; keep the ones the team can change |
Effort is an estimate for one line, area or product version, in plant-side hours; it leaves out hardware and licence prices, which vary by plant and supplier. On the worked example's terms, each option is judged the same way: the loss it removes, in minutes or units, times the line's margin.
Questions to ask before choosing:
- Which loss is largest on this line: waiting for help, short stops and slow running, changeovers, or rejects?
- Who responds to each kind of call, and is that list written down and known on every shift?
- Which numbers will come from the machine (PLC or sensor), which from a camera, and which will people enter by hand?
- Which product versions caused a first-off reject in the last month, and what did the first part look like?
- Which measures can the tier 1 team change, and which belong at tier 2 or 3?
- How will the loss be measured before the layer goes in, and again a month after?
Visual factory management: first moves for plant managers, production managers and CI engineers
Visual factory management is the work of keeping the five layers current and acted on. The first steps differ by role.
| Role | Start this week | By the end of the quarter |
|---|---|---|
| Plant manager | Pick the line with the largest gap to target and ask for its three largest losses, each placed in an OEE factor. | Decide which layer each area builds first, and go through the before and after figures with each area once a month. |
| Production manager | Write the stop and call reasons for that line and name the person who responds to each. | Run the tier 1 and tier 2 meetings from the board, with an owner and a date on each action. |
| CI engineer | Time the next three changeovers on that line: mechanical change, wait for first-off release, first-off rejects. | Put one visual standard at the line, repeat the timing a month later and value the minutes and units at the line's margin. |
This week's checklist for one line:
- Walk the line with the team leader and list each tool, gauge and change part that has no marked place.
- List last week's stops by reason and name who responds to each reason.
- Check that the screen or board at the line shows target, actual, the gap and the current stop reason.
- Time the wait for first-off release on the next three changeovers and count the first-off rejects.
- Photograph the approved first part of the next product version, mark the features to check, and have quality approve the photo.
- Price the result: good units gained a shift x selling price x gross margin, then x the shifts in a month, and x 12 for a year.
Summary: build the visual factory one layer at a time
A visual factory is five layers of signals, each read at its own speed by the person who can act on it: seconds at the station, minutes at the line, within the shift, per changeover and per day.
Each layer catches one kind of loss, and each loss has a place in OEE, so each layer can be measured before and after it goes in. In the worked example, photo standards at one line moved availability and quality together, worth EUR 525.03 of margin a shift on sample figures.
Build first the layer that matches the largest loss in your own records, give each signal a named owner, and keep the measures few enough that the team acts on all of them.
Frequently asked questions about the visual factory
What is a visual factory?
A visual factory is a plant where the state of production can be read where the work is done: where tools and materials belong, which line needs help, how far the shift is from its target, how a setup should look and which losses keep returning. It applies visual management to the whole plant, in five layers from floor marks to the daily tier board.
What are some visual factory examples?
Floor marks and shadow boards at the station, a light or screen that calls for help at the line, a target vs actual and OEE screen for the shift, photo standards for setups and first-off checks at changeover, and a daily tier board with owners and dates. Each example supports a different decision at a different speed.
What is the difference between a visual factory and visual management?
A visual factory applies visual management, the principle of placing information in plain view so status is understood at a glance, across a whole plant, from the station to the daily meeting. Visual management can be one board in one area; a visual factory links the station, the line, the shift and the daily meeting so that each signal has an owner.
What are visual work instructions?
Visual work instructions show a task mainly in photos or drawings, with short text for what a picture cannot show. On a production line, a natural place for them is the changeover, where photos of the settings and of the approved first part let the person at the line check the first parts on the spot. A 2013 laboratory study with university students found that text combined with pictures reduced assembly errors compared with text alone.
How does a visual factory connect to OEE?
Each layer catches a loss that sits in one OEE factor: waiting for help and setup time in availability, short stops and slow running in performance, scrap and rework in quality. The target vs actual layer shows OEE during the shift and the daily tier board reviews its trend, so OEE is the one measure for judging each layer before and after it goes in.
How do you start visual factory management?
Pick one line, rank its losses from a week of stop and reject records, and build the layer that matches the largest one first. Give each signal a named owner, measure the loss before and after, and add the next layer once the first is used in the shift.
For the live OEE dashboard on a floor screen or tablet, with notifications by rule, book a demo.
Related articles



Latest from our blog


Real Fabrico tiles, sample data.