






 Login
 Blog

TEEP: Total Effective Equipment Performance Explained

Key takeaways
- TEEP (total effective equipment performance) shows how much of all calendar time a machine spends making good parts at full speed.
- The formula is TEEP = OEE × Utilization, where utilization is planned production time divided by all time.
- OEE tells you how well you use the time you schedule. TEEP tells you how much of the machine's total capacity you actually turn into good output.
- Your shift pattern sets a hard ceiling: a machine that runs one 7.5-hour shift, five days a week, can never exceed a TEEP of 22.3%.
- Use OEE to run the plant every day. Use TEEP before you add shifts or buy new equipment.
What is TEEP? Meaning and definition
TEEP stands for total effective equipment performance.
It measures the share of all time, 24 hours a day and 7 days a week, that a machine spends producing good parts at its ideal speed.
A TEEP of 100% would mean a machine ran perfectly, around the clock, every day of the year.
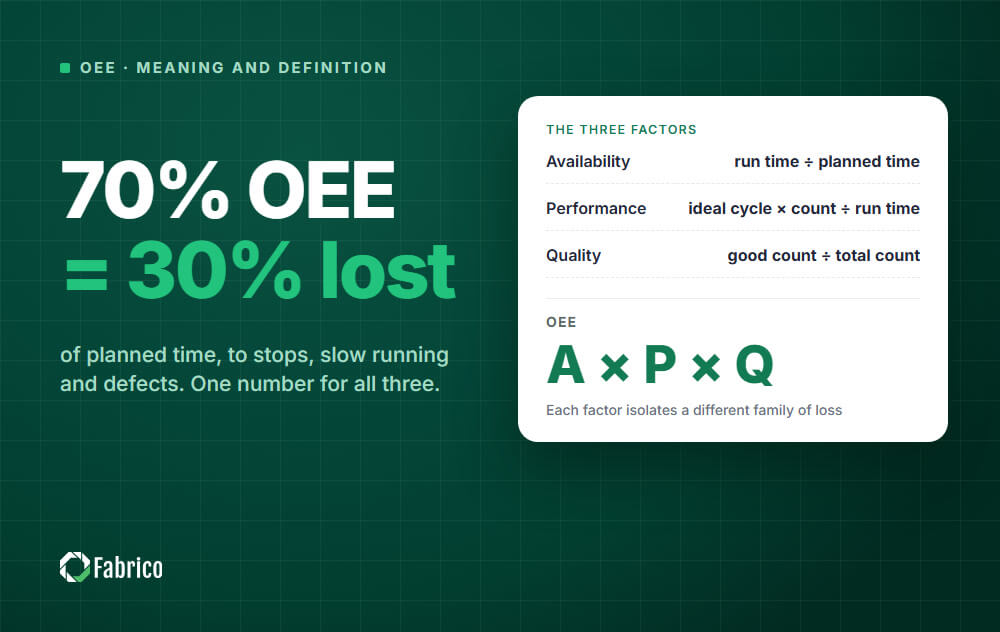
TEEP uses the same losses as overall equipment effectiveness (OEE). It adds one more: the time you did not schedule at all.
The TEEP formula
TEEP = OEE × Utilization
Utilization = Planned production time ÷ All time
Some sources call this ratio the loading rate, so you may also see TEEP = OEE × Loading.
Some tools use "machine utilization" for run time ÷ available time, which is a different number.
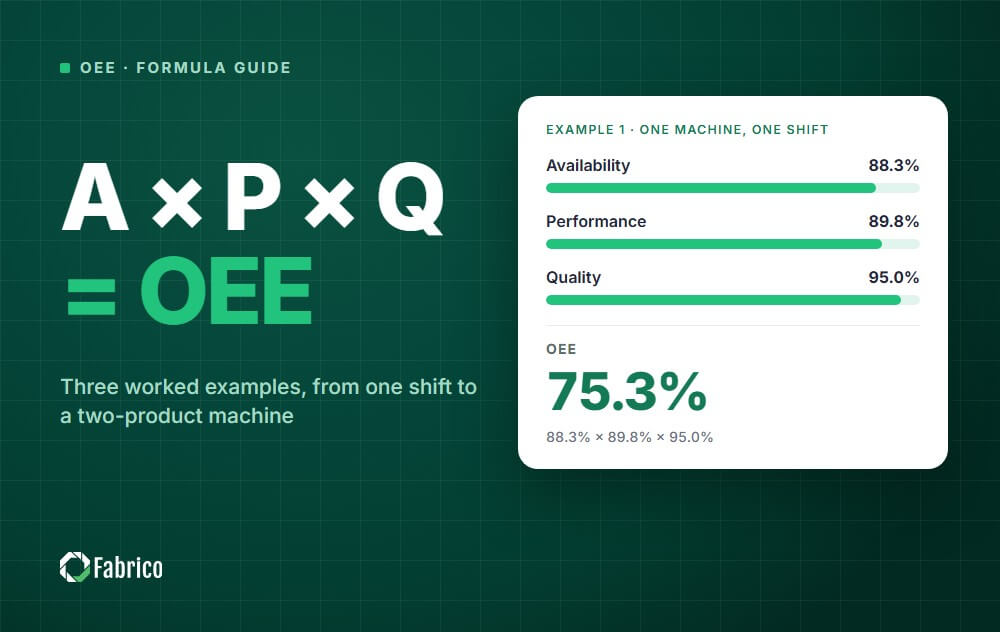
Because OEE is fully productive time divided by planned production time, the two formulas combine into one:
TEEP = Fully productive time ÷ All time
| Term | Meaning |
|---|---|
| All time | Every hour in the period: 168 hours in a week, 8,760 in a 365-day year |
| Planned production time | The time you scheduled the machine to produce, after breaks and other time with no production planned are removed |
| Utilization | Planned production time as a share of all time |
| Fully productive time | Good parts at ideal speed, with no stops |
TEEP vs OEE vs utilization
All three are percentages, and all three use time. They answer very different questions.
| Metric | What it measures and who uses it |
|---|---|
| OEE | Measured against: Planned production time Question it answers: How well did we use the time we scheduled? Used by: Production and maintenance teams |
| Utilization | Measured against: All time Question it answers: How much of the week did we schedule? Used by: Planning and plant management |
| TEEP | Measured against: All time Question it answers: How much of the week produced good output? Used by: Plant management, finance, capacity planning |
For a side-by-side comparison, see OEE vs TEEP. For the utilization side, read machine utilization vs OEE.
The TEEP time model
TEEP starts with the whole calendar and removes one layer of loss at a time.
| Layer | What is removed to get here | Type of loss |
|---|---|---|
| All time | Nothing yet | |
| Planned production time | Nights, weekends, holidays, breaks, no orders | Schedule loss (utilization) |
| Run time | Breakdowns, changeovers, waiting and other longer stops | Availability loss |
| Net run time | Slow cycles and short stops | Performance loss |
| Fully productive time | Time spent making bad parts | Quality loss |
The first layer is set by the schedule and demand. The other three are equipment and process losses, the ones OEE measures.
The six big losses sit inside those three layers.
TEEP calculation example: one machine, one week
A machine runs two shifts, five days a week. Each shift has 7.5 hours of planned production time after breaks.
| Item | Value |
|---|---|
| All time | 24 × 7 = 168 hours |
| Planned production time | 2 × 7.5 × 5 = 75 hours |
| OEE for the week | 68% |
Step 1: utilization
Utilization = 75 ÷ 168 = 44.64%, or 44.6% rounded
Step 2: TEEP
TEEP = 68% × 44.64% = 30.4%
Step 3: check it with time
Fully productive time = 75 hours × 68% = 51 hours.
51 ÷ 168 = 30.4%. The two methods agree.
What the number means
Out of 168 hours in the week, the machine's good output equals 51 hours of perfect running.
Another 93 hours were never scheduled. The other 24 were scheduled but lost to stops, slow running and defects.
Using TEEP for a capacity decision
Suppose demand is rising and the plant needs more output from this machine. There are three main options.
| Option | Planned hours per week | OEE | TEEP (fully productive hours) |
|---|---|---|---|
| Today | 75 h | 68% | 30.4% (51.0 h) |
| A. Raise OEE by 10 points | 75 h | 78% | 34.8% (58.5 h) |
| B. Add two shifts on Saturday and Sunday (4 × 7.5 h) | 105 h | 68% | 42.5% (71.4 h) |
| C. Add a third shift on weekdays | 112.5 h | 68% | 45.5% (76.5 h) |
Options B and C assume the new shifts run at the same 68% OEE, which night and weekend shifts often do not.
Option A adds 7.5 productive hours a week without adding a shift. Our guide on how to improve OEE shows how.
Options B and C add more hours, but every one of them needs people, energy and supervision.
Most plants should do A first, because improving OEE also makes every added shift more productive.
Buying a second machine usually makes sense only once both levers are close to their limits.
How to improve TEEP
TEEP has two levers: raise OEE inside the hours you already run, or plan more hours.
Start with OEE, as in option A above, because every hour you add later inherits it.
The ceiling your schedule sets
Even with a perfect 100% OEE, TEEP cannot be higher than utilization.
- One 7.5-hour shift, five days: maximum TEEP 22.3%
- Two shifts, five days: maximum TEEP 44.6%
- Continuous 24/7 operation with no scheduled downtime: maximum TEEP 100%
That is why a low TEEP is not automatically bad. It often reflects a deliberate schedule, not a failing line.
What is a good TEEP?
There is no universal benchmark for TEEP, because it depends mostly on how many hours you choose to run.
A continuous-process plant running around the clock can reach a much higher TEEP than a one-shift job shop with the same OEE.
Use these comparisons instead:
- Against your own history, with the same schedule.
- Against your schedule ceiling, to see how much of the scheduled capacity you actually use.
- Across machines that make the same product, to find where capacity is hiding.
For OEE targets, see world-class OEE.
When to use TEEP and when to use OEE
| Decision | Better metric |
|---|---|
| Which loss should we fix this week? | OEE |
| How did the line perform on this shift? | OEE |
| Can we take a new customer order without new equipment? | TEEP |
| Should we add a shift or weekend work? | TEEP |
| Should we buy another machine? | TEEP, then OEE |
| Which plant has spare capacity for a new product? | TEEP |
How to measure TEEP
If you already measure OEE, you are most of the way there.
- Measure OEE for the machine, with a clear definition of planned production time. Our OEE calculation guide shows how.
- Record the schedule: which hours were planned for production, and why the rest were not.
- Use calendar time as all time, every hour of the period, including nights, weekends and holidays.
- Calculate utilization and TEEP for the same period as your OEE, usually a week or a month.
It helps to split the unscheduled time into reasons: no orders, no staff, planned maintenance shutdowns, holidays.
That split turns TEEP from a single number into a list of capacity decisions.
Common TEEP mistakes
- Using TEEP to judge the line team. They do not control the schedule, so use OEE for that.
- Leaving time out of "all time". All time is the full calendar, so removing holidays from it measures something else.
- Moving maintenance in and out of planned time. Decide once whether a maintenance window sits inside or outside planned production time, then stick to it.
- Ranking plants by TEEP when their demand differs. A plant with fewer orders will usually schedule fewer hours, whatever its equipment is like. Use TEEP to find spare capacity, not to grade plants.
- Confusing utilization with availability. Utilization is about the schedule, while availability is about stops during the schedule.
TEEP, OEE and OOE together
OOE (overall operations effectiveness) sits between the two. It measures against operating time, which also includes time that was scheduled and then dropped, for example for lack of orders.
Many plants track OEE daily and review TEEP monthly. Our OOE guide explains when the third metric is worth adding.
If TEEP shows large unused capacity, read our guide to the hidden factory to put a value on it. Choosing a tool? Read our guide to OEE software.
How Fabrico helps
Fabrico is a cloud-based MES and OEE platform for manufacturers, with maintenance management (CMMS) built in.
It records run time, stops and counts from PLCs, IoT sensors and AI cameras, and calculates OEE in real time for every connected machine.
It also detects micro stops and reports downtime, MTTR and MTBF, so the equipment side of TEEP is measured rather than estimated.
Add the hours you planned, from your own schedule, and you have every input TEEP needs.
See your real-time OEE and downtime on a live dashboard: book a demo. More guides are in our OEE explained hub.
Frequently asked questions
What does TEEP stand for?
TEEP stands for total effective equipment performance.
It measures fully productive time as a share of all calendar time.
How do you calculate TEEP?
Multiply OEE by utilization, where utilization is planned production time divided by all time.
You can also divide fully productive time by all time. Both give the same answer.
What is the difference between TEEP and OEE?
OEE measures against planned production time. TEEP measures against all time, so it also shows the hours you never scheduled.
TEEP is always equal to or lower than OEE.
Can TEEP be higher than OEE?
No. Utilization can never exceed 100%, so TEEP can never exceed OEE.
They are equal only when every hour of the period is planned production time.
What is a good TEEP score?
There is no standard benchmark, because TEEP depends on your shift pattern.
Compare TEEP with your schedule ceiling and with your own history instead.
What is the difference between utilization and TEEP?
Utilization only shows how much of the week you scheduled.
TEEP shows how much of the week actually produced good output, so it also includes stops, speed losses and defects.
See how Fabrico unifies OEE and maintenance in one platform.
Request a demoRelated articles





Real Fabrico tiles, sample data.