


 Login
 Blog
Computer Vision for Dairy Processing: Where Cameras Pay Off

In short: computer vision for dairy processing works best as a counter and a witness: cameras count cups, cartons and cheese packs where the filler or packer gives no usable count, and let you open the video of a stop to see what happened.
- Fill level, seal, lid and date code checks are inspection. That is a different job, done by inspection systems from vendors such as Cognex, Keyence or Mettler-Toledo.
- Dairy losses hide in CIP windows, start-up waste, many short runs, and short stops at the cup feed or the carton magazine.
- Where the filler PLC gives a run state and a count you trust, use it. Put cameras at manual cheese and butter packing, on machines with no usable signal, and at the end of the line.
- Fabrico's AI camera add-on counts output and lets you open the video for any moment on the shift timeline. The operator adds the stop reason.
Your fillers have PLCs. Your cheese room has people, knives and scales. Your CIP schedule shapes the whole day.
This page is for dairy plant managers and engineers choosing cameras and OEE software, from milk and yogurt to cheese and butter.
It shows where a camera earns its place, where the filler signal is enough, and what to ask each vendor. We sell Fabrico, so test what we say here like any other vendor's claims.
Computer vision for dairy processing: two different jobs
Two kinds of camera system get sold to dairies under one name. Inspection systems check every pack. OEE cameras count output and show you what happened at a stop.
They are often bought from different vendors, so keep them apart in the spec.
| Job on a dairy line | Inspection system | OEE camera |
|---|---|---|
| Fill level and weight | Yes, or a checkweigher | No |
| Seal, foil and lid present | Yes | No |
| Date code and label | Yes | No |
| Count good cups, cartons or packs | Often counts what it inspects | Yes, also at manual steps |
| Video of a stop | Reject images, not stop video | Open the video for that minute |
| Feeds OEE through | Its reject count | The output count |
If you searched for machine vision in dairy and found inspection, this page is about the other job.
The two work side by side. An inspection system's reject count, read from its PLC or a counter signal, can feed the quality part of OEE, so rejects are counted once. For the line between the two, read label and code vision vs an OEE camera.
Where the losses hide on a dairy line
Dairy output leaves the plant through two very different kinds of line. Milk, yogurt and cream go through fast fillers with PLCs. Cheese and butter often end at slower packing lines, and some of them are manual.
Siemens' 2024 True Cost of Downtime report puts an hour of unplanned downtime at $36,000 in fast moving consumer goods, the lowest of the four sectors it covers, at large manufacturers. Your number will differ, so price your own hour. Here is where dairy hours go, planned and unplanned.
CIP windows
CIP is not a side job. A 2011 ENERGY STAR guide from Lawrence Berkeley National Laboratory quotes an older Dutch estimate (Ramirez and colleagues, 2006): CIP took 9.5% of the energy used in fluid milk processing, 26% in butter and 19% in cheese. That figure is dated, second hand and about energy, not time, so read it as scale only.
For OEE, the question is time. If a CIP runs inside planned production time, book the whole window as an availability loss with its own code. Then cut the waiting, the hose changes, the checks and the restart around the validated cycle. Never cut the cycle itself.
Some plants keep a scheduled end-of-run CIP outside planned time instead. That works only if CIP hours are reported on their own line, so a cycle that creeps stays visible.
A camera adds little here: the CIP controller knows when cleaning starts and ends. Our page on CIP time in OEE shows how to split one window.
Short runs from short shelf life
Fresh dairy does not wait in a warehouse. For European milk, a 2013 article in the IFT's Food Technology magazine put the market expectation for ESL milk at about 21 days, against 12 days for pasteurization alone at around 10°C.
Short shelf life means you fill close to the order. Many flavors, pack sizes and private labels then share one filler. Runs get short and changeovers get many, and each one brings a stop, a start-up and often a rinse or a CIP.
On a line like that, the ideal rate has to change with the SKU, or the performance figure means nothing.
Start-up and changeover waste
The first cups after a CIP or a product change often go to waste. Water and product mix in the line, sealing temperatures settle, and weights drift until the filler is stable.
Those cups were made, so they count against quality, but they are easy to miss when someone pulls them off by hand. The worked example below shows one way to count them.
Aseptic and ESL fillers
Aseptic fillers, and many ESL fillers, sterilize before production starts. On many of them, a stop that breaks the sterile zone means sterilizing again before the restart. One short stop can then cost far more than its own minutes.
Make sure the re-sterilization time links back to the stop that caused it, or the cause disappears from the report. See OEE for aseptic filling lines.
Short stops at the cup feed and the carton magazine
Pre-made cup fillers lose time at the cup drop and where foil and lids feed in. Form fill seal machines lose it at the film feed, forming and cutting. On carton fillers, look at the blank magazine, the cap or straw applicator and the case packer.
A 40-second stop rarely gets written down. Forty of them are 27 minutes.
Our page on yogurt cup filler stops goes through cup drop, seal and lid faults one by one. For carton and bottle fillers, see what a camera on a filling line shows that the filler PLC does not.
Manual cheese cutting and packing
In smaller and specialty plants, cheese is often cut, weighed and packed by hand, or on a semi-automatic line with a person at each end. There is no PLC count to read. Large plants run portioners and thermoform packers: read their PLC, and add a camera only where the packer gives no usable count.
At a hand-packing table, a camera pays off. It counts the packs or blocks that leave the table, so output by hour stops being a guess. Stop reasons still come from the people at the table. Camera-detected stops are on the roadmap, so ask any vendor how stop time is captured at a station with no signal.
See OEE at a manual packing station and our page on OEE software for dairy and cheese plants.
Cold, wet halls
Dairy halls are cold, wet and washed down. Lenses fog when warm, humid air meets a cold surface, and washdown spray reaches everything at line height.
So mount cameras outside the guarding, to the side, never above open product, in a housing rated for your washdown. Agree each position with QA and hygiene before anyone drills.
Ice cream lines add freezing, hardening and frozen packing to all of this. See OEE for ice cream production.
Where a camera goes on a dairy line
Here is one example: a yogurt cup line and a cheese packing table.
For a longer list by machine type, see camera or sensor for OEE, machine by machine.
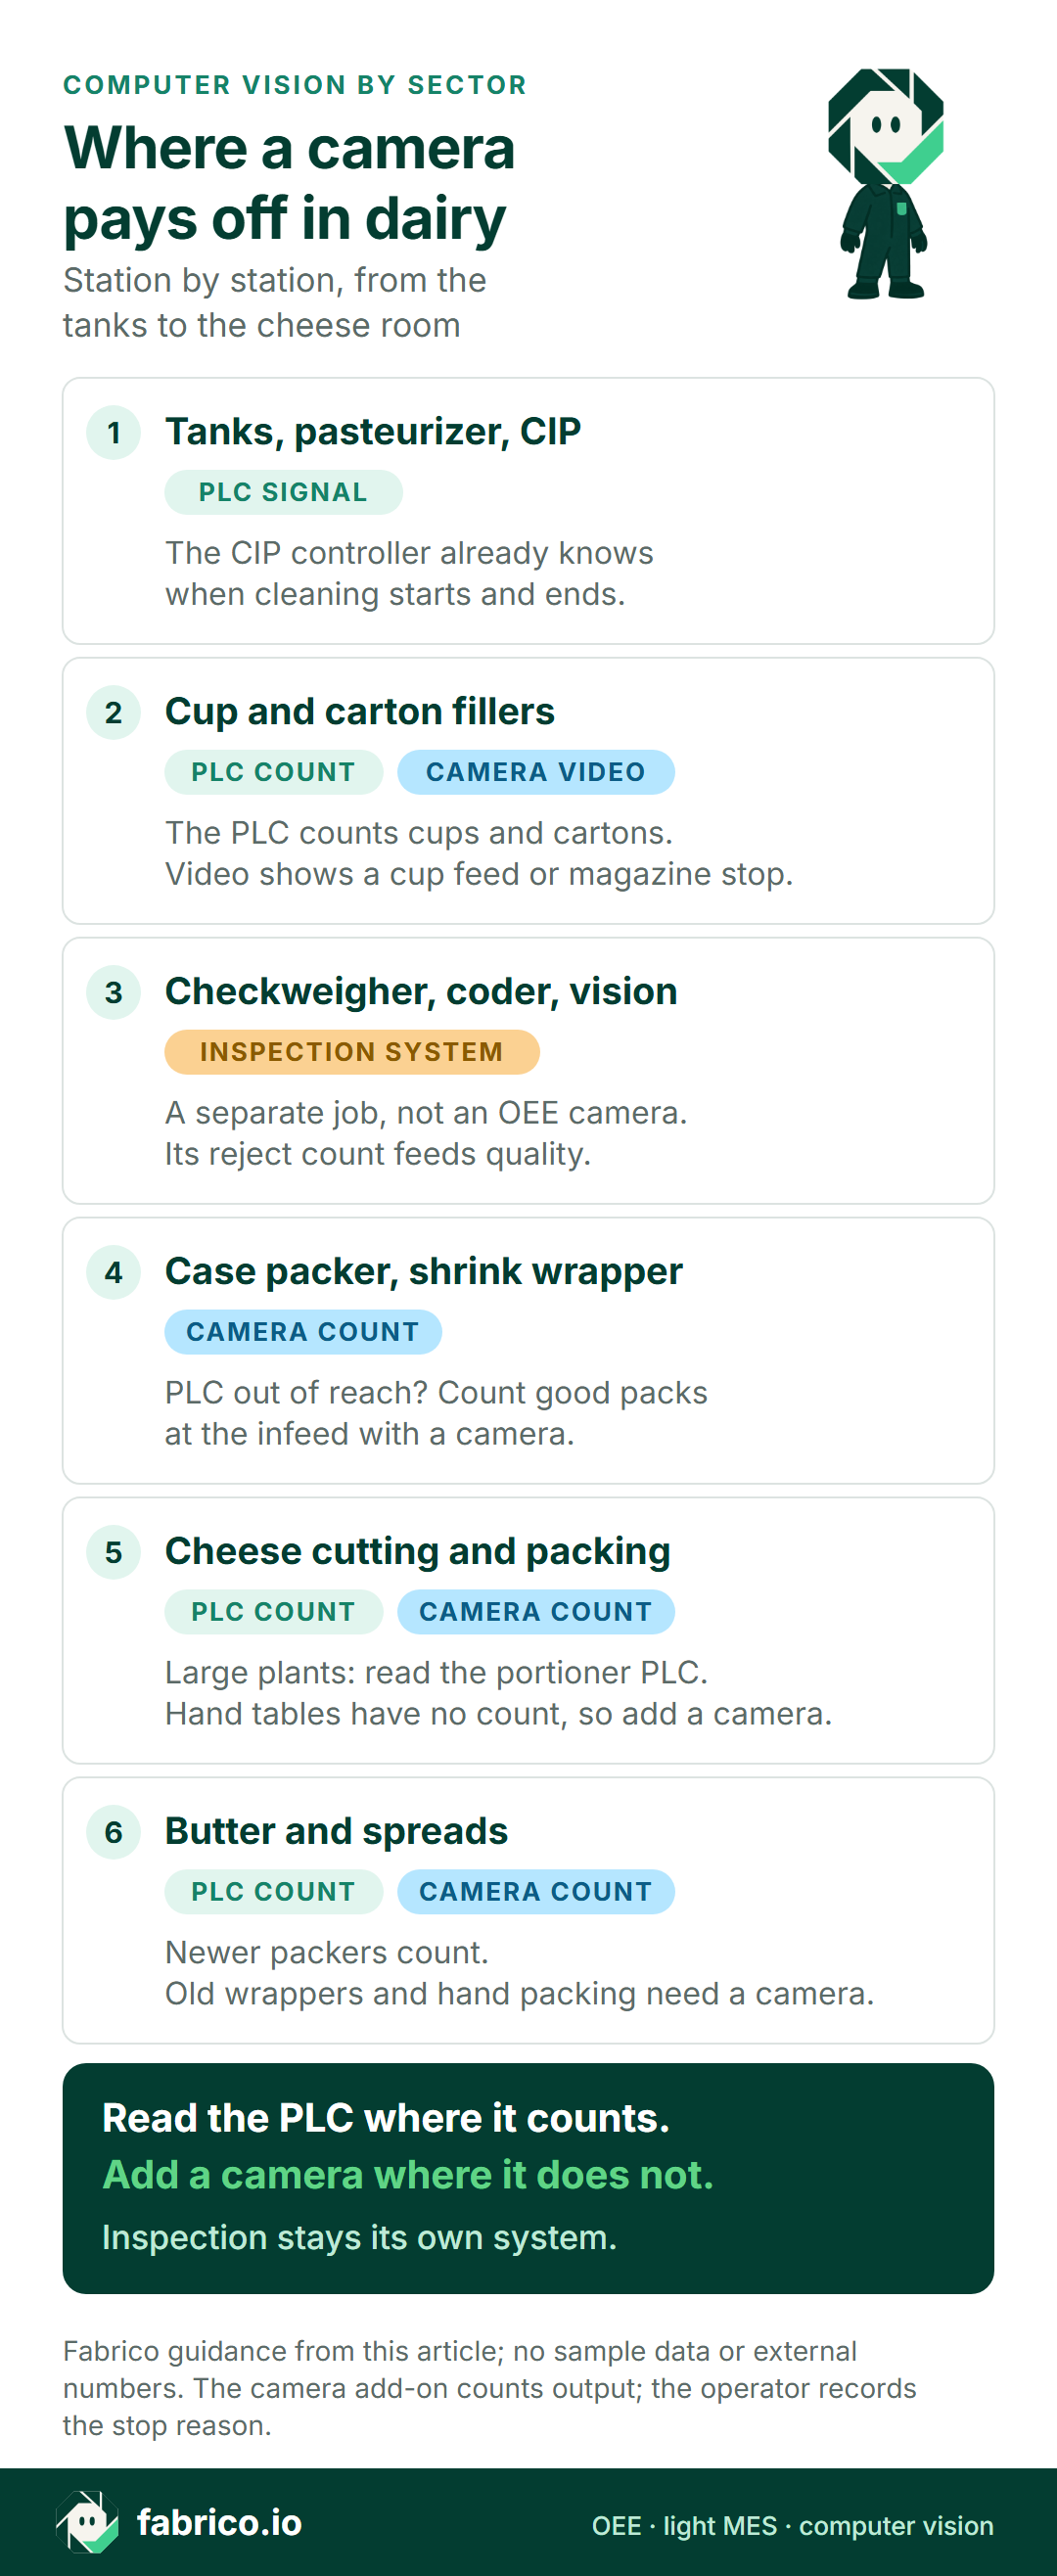
Camera, sensor or operator: station by station
This is typical for a dairy site, not a rule. Check each machine.
| Station | Count and stops from | What a camera adds |
|---|---|---|
| Tanks, pasteurizer, CIP | Process control: run and CIP state | Little. Use the signal. |
| Cup filler (form fill seal or pre-made cups) | Filler PLC | Video of cup feed or forming, foil and lid stops |
| Carton filler | Filler PLC | Video at the blank magazine and cap applicator |
| Aseptic or ESL filler | Filler PLC and sterilization state | Video of what led up to a stop |
| Checkweigher, coder, inspection | Its own reject count | Nothing. Feed rejects to quality. |
| Case packer, shrink wrapper | PLC, if you can reach it | Good count at the infeed if you cannot |
| Cheese cutting and packing | Portioner or packer PLC, or nothing at a hand table | Count of packs or blocks where nothing counts |
| Butter and spreads | Packer PLC on newer machines | Count on old wrappers and hand packing |
| Stop reasons, all lines | The operator, on a tablet or phone | Video to check a disputed reason |
You rarely need a camera at every station. The card below shows where one pays off.
Bring your line list and one week of stop sheets to a demo, and we will go through it station by station.
Worked example: one dairy shift with a CIP inside it
These are example numbers, and they describe no real plant. A cup filler with an ideal rate of 120 cups a minute runs one 480-minute shift with a CIP inside it.
The filler PLC gives the run state and counts every cup filled. A camera at the case packer infeed counts the cups that reach it. Checkweigher rejects and start-up cups pulled off by hand make up the difference.
Stops took 120 minutes: CIP 45, two changeovers 30, short stops 25 and one breakdown 20. Run time is 360 of 480 minutes, so availability is 75%.
At 120 cups a minute, 360 minutes could make 43,200 cups. The filler counted 38,880, so performance is 90%. The gap is 36 minutes of slow running.
The camera counted 37,800 good cups at the case packer. That leaves 1,080 rejects, so quality is 97.2%. Those 1,080 cups are 9 minutes of filler time.
OEE is 75% x 90% x 97.2% = 65.6%. Check it the short way: 37,800 good cups of 57,600 possible is also 65.6%.
Now book the same CIP as planned downtime. Planned time drops to 435 minutes, availability reads 82.8%, and OEE reads 72.4%.
Two things change when the count is right. The start-up and reject cups show up every shift, by product. And when short stops jump on a Tuesday, someone can open the video for those minutes instead of guessing.
Eight checks for any dairy camera or OEE vendor
Run these with every vendor, and with us. Bring one real shift from last week as the test case.
| Ask | How to test the answer |
|---|---|
| How do you book CIP? | Ask for a CIP code inside planned time, and minutes over standard for each CIP type. |
| Where do start-up cups go? | Ask how waste after a CIP or a changeover reaches the quality figure, and who counts it. |
| What exactly does the camera count? | Cups, multipacks or cases? Form fill seal lines leave in multipacks, so ask how packs convert to cups for each SKU. Run it next to a hand count. |
| Does it cope with a cold, wet hall? | Ask for the washdown rating (IP69K, or what your hygiene team requires), a shatterproof lens window for your glass register, and what happens when the lens fogs. |
| Where does each camera mount? | Ask for each position on a drawing, and get QA sign-off first. |
| Is video kept, and who can open it? | Ask where it lives, for how long, and who sees it. |
| How do inspection rejects get in? | Ask if the checkweigher or vision reject count feeds quality, so rejects count once. |
| How does a 40-minute run look? | Ask to see the ideal rate change with the SKU, and a short run on the shift timeline. |
Before you roll out across the site, test on one line first. See our guide to a computer vision OEE pilot.
Cameras, privacy and the works council
Dairy halls have people at fillers, packers and cheese tables, and a camera on a filler will see some of them. Tell staff before any camera goes up. In many European countries, talk to the works council first.
Frame the camera on the product, the cups or the packing table, not the crew. Report by line and shift, not by person. Ask each vendor, us included, what privacy masking is live today and what is still roadmap.
Fabrico's camera counts product, not people. For a fuller checklist, read production line cameras without surveillance.
Where Fabrico fits
Fabrico is a cloud OEE and light MES platform. Here is what it does on a dairy line today.
- Stops and counts: from the machine signal, through the filler or packer PLC, a sensor or a counter.
- Stop reasons: the operator adds them at the line, on a tablet or phone.
- OEE and losses: OEE, downtime and losses by line and shift, with losses shown in money. On the web, iOS and Android.
- Cameras, an add-on on request: AI cameras count output, including at manual cheese and butter packing and on machines with no usable signal. You can open the camera video for any moment on the shift timeline. In the standard setup, video is streamed on request, not stored in Fabrico.
- Your data: it leaves through a REST API, webhooks and Excel or CSV export.
Roadmap, not live today: stops detected by the camera, jam zones on the video, and a camera suggesting a stop reason.
What Fabrico does not do: inspection, which stays with your inspection systems and feeds Fabrico's quality figure through the line's reject signal or counter. Fabrico does not run or validate your CIP. For planning and scheduling, ask us in the demo.
For the full product, see Fabrico computer vision for OEE. If you are still comparing platforms, read our guide to OEE software. All eight checks above apply to us too.
Bring your CIP log and one shift's stop sheet to a demo, and ask us to show which numbers we can fill and which we cannot.
What people ask next
Which dairy station should get the first camera?
Usually the one with the weakest count: a manual cheese or butter packing table, an old wrapper, or a case packer whose PLC you cannot reach. Fillers with a PLC count you trust come last.
Can a camera check fill level and seals on yogurt cups?
Yes, but that is an inspection camera, not an OEE camera. Fill level, seal integrity and date codes are checked by inspection systems. Fabrico does not sell inspection. The inspection system's reject count can feed the quality part of OEE.
Does computer vision work in a cold, wet dairy hall?
It can, if the housing suits your washdown and QA signs off the mounting. Test it for condensation: ask each vendor what happens to the count when the lens fogs.
Can a camera count cheese packed by hand?
Yes. Counting output at manual steps is a main use of Fabrico's AI camera add-on. It counts the packs or blocks leaving the table, and the people there still add the stop reasons. See OEE at a manual packing station.
Is the camera video stored?
Not in Fabrico. In the standard setup, video is streamed on request, and you can open it for any moment on the shift timeline. Ask every vendor the same question, and where their video lives.
What drives the cost of computer vision in a dairy plant?
Pricing is set per quote. The drivers are the number of lines and cameras, mounting and housings for wet areas, the network to the hall, and training. Give each vendor the same line list so the quotes compare.
Want to see it on your line? Book a demo and bring one shift from a dairy line.
Related articles




Real Fabrico tiles, sample data.