


 Login
 Blog
OEE Monitoring Software: How an OEE Monitoring System Works
Most plants already know their OEE. The trouble is when they learn it: at the end of the shift, from a spreadsheet, after the chance to save the hour has gone. OEE monitoring moves that number into the shift itself, so the people on the line see availability, performance and quality while there is still time to act.
This guide explains how an OEE monitoring system works, from the machine signal to the decision, how to connect machines with and without a PLC, where cameras fit, and what to check before you choose OEE monitoring software.
What is OEE monitoring?
OEE monitoring is the live measurement of overall equipment effectiveness on each machine, line and shift. Instead of calculating OEE after the fact, the system records runs, stops and parts on connected machines as they happen and keeps the three factors current:
- Availability: run time against planned production time, with breaks and non-production time taken out.
- Performance: actual output against what the ideal cycle time allows in the run time, so slow cycles and micro-stops show up.
- Quality: good units against all units produced.
OEE tracking and OEE monitoring are often used as the same thing. In practice, tracking is the record and monitoring is the live view built on it: a shift lead who can see that Line 2 has lost twenty minutes to short stops since 6:00 can still do something about it today.
How an OEE monitoring system works
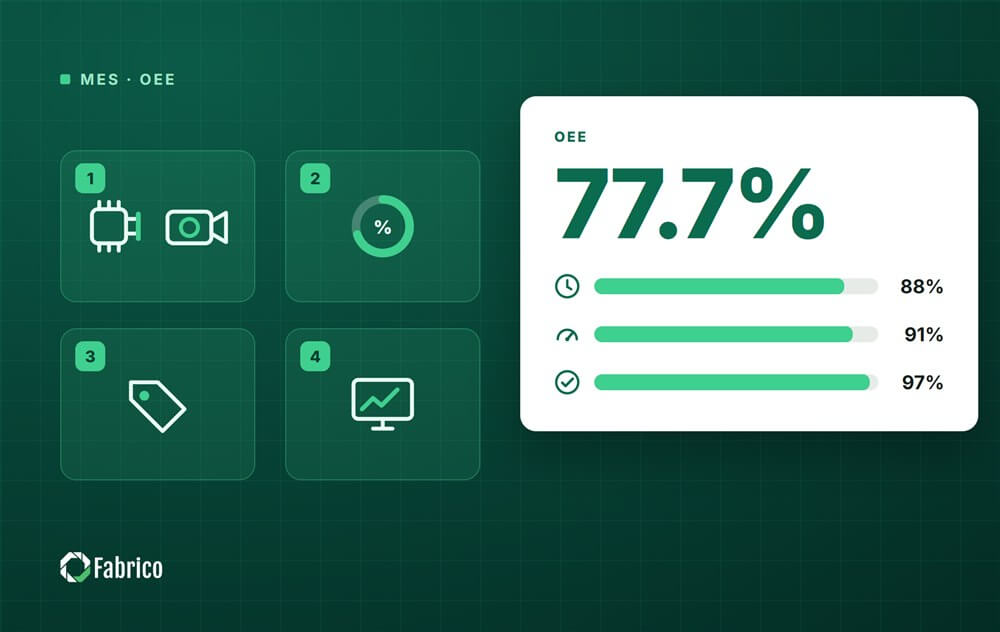
Every OEE monitoring system, whatever the brand, does four jobs. If one of them is missing, the number on the screen stops being trusted.
- Capture: it collects a running or stopped state and a part count from each machine, through a PLC connection, an added sensor, a camera or operator input.
- Calculate: it compares that data with the shift plan and the ideal cycle time to produce availability, performance, quality and OEE, by machine, line and shift.
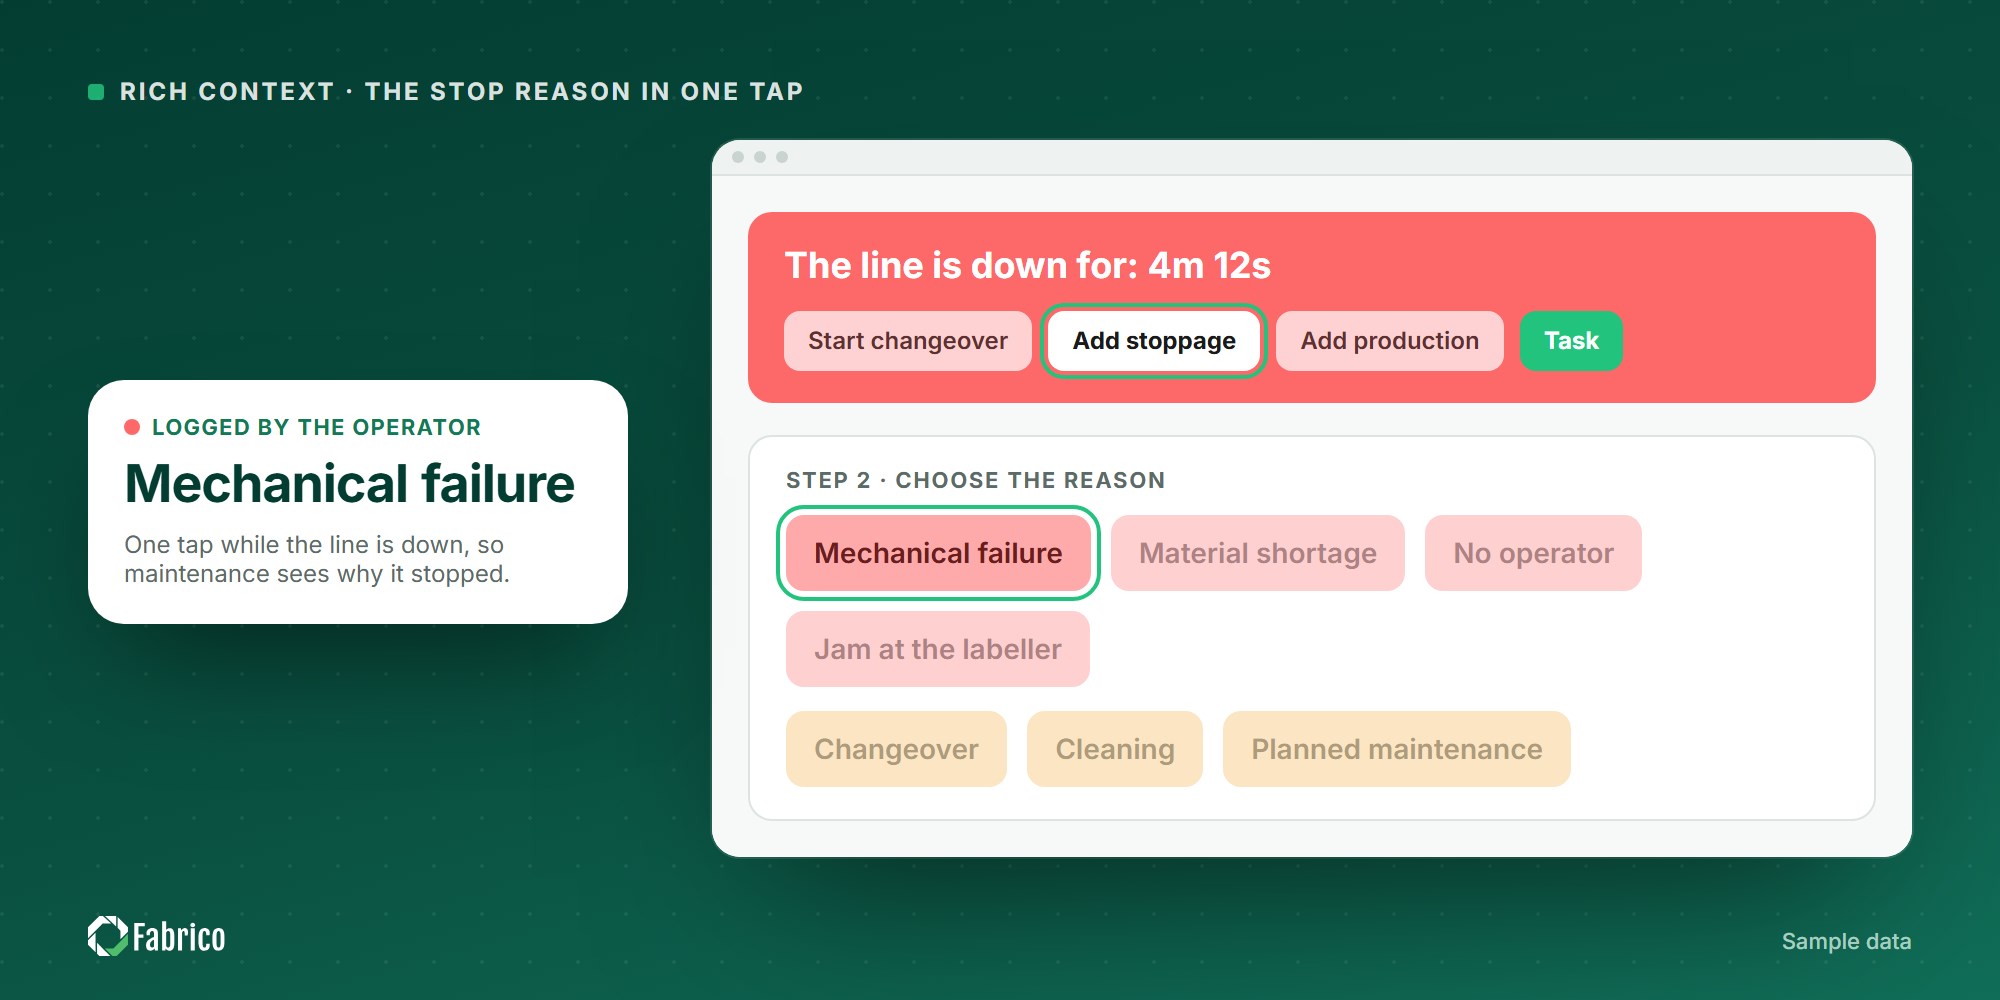
- Explain: it asks for the reason behind each stop, so downtime builds up by cause instead of as one large unknown. Our comparison of machine downtime tracking software shows how five tools handle it.
- Show and act: it puts the result where decisions are made: a screen on the line, the shift handover, the daily review and the maintenance queue.
The capture step decides how good everything after it can be, which is why the choice of data source matters more than the dashboard.
Where machines give no signal, cameras can fill the gap: see the computer vision buyer checklist, how to connect line cameras to MES downtime codes, how to run a computer vision OEE pilot and how the Cerrion alternatives compare.
Three ways to connect machines
A plant rarely has one kind of machine, so most OEE monitoring systems support more than one way in. One plant can mix all three.
| Data source | Best for | What it captures | What to check |
|---|---|---|---|
| PLC connection | Modern machines with a controller you can read | Run and stop states, counts and, often, fault codes | Who maps the signals, and whether the PLC program has to change |
| IoT device with sensors | Older machines with no PLC you can read | Running and stopped states and cycles from an external sensor | Where the sensor sits, so a cycle is counted once |
| AI camera | Manual stations, packing and lines where a signal misses the real stop | Output counts, stops and short stops, speed, and the footage of the moment the line stopped | Camera position and how the footage is handled |
For machines with no PLC at all, our guide to OEE monitoring without a PLC compares sensors and cameras in more detail.
Where cameras fit in OEE monitoring
Machine signals are fast and exact about whether a machine is running. They are weaker on the things around the machine: a line that is switched on but not producing, a stop too short for anyone to write down, or a manual station that has no signal at all. That is where computer vision for OEE adds a visual layer.
- Output and cycles: the camera counts parts and detects cycles where there is no machine signal.
- Stops and micro-stops: it detects when a line stands still, including short stops nobody records.
- Speed: cycle patterns on the video show whether the line runs at the correct speed.
- The moment of the stop: footage synchronized with the machine timeline lets the team review what happened before they confirm the reason.
The point is not to watch people. It is to give the stop that nobody classified a cause, so the biggest losses stop hiding in the "other" bucket. Our explainer on visual intelligence in manufacturing covers the wider use of video on the shop floor.
What an OEE monitoring system should show while the shift runs
- OEE by machine, line and shift, split into availability, performance and quality, so you can see which of the three is pulling the score down.
- Stops with their start time, duration and reason, including micro-stops detected from the signal.
- Slow cycles shown as performance loss, not hidden inside run time.
- Output against target hour by hour, on a screen the line can see.
- The top losses of the shift, ranked, so the handover starts with the biggest one.
- Losses in money as well as minutes, because a stop on the bottleneck costs more than a stop on a machine with spare capacity.
A worked example (sample numbers)
Take one line on an eight hour shift with a 30 minute break, so 450 minutes of planned production time. The monitoring system records 54 minutes of stops: one jam of 14 minutes, a changeover of 22 minutes and a run of short stops that adds up to 18 minutes. The ideal cycle time is 0.2 minutes per part, the line made 1,800 parts and 54 of them were scrap.
- Availability: the jam and the changeover take 36 minutes, so run time is 414 minutes out of 450 = 92%. The short stops stay inside run time.
- Performance: 1,800 parts × 0.2 minutes = 360 minutes of ideal time out of 414 minutes of run time = 87%. The 18 minutes of short stops show up here.
- Quality: 1,746 good parts out of 1,800 = 97%.
- OEE: 0.92 × 0.87 × 0.97 = 77.6%.
The calculation is the easy part. The value of monitoring is that the 18 minutes of short stops appear during the shift as their own loss, with a time stamp and, where a camera covers the line, the clip of what happened. Written down at the end of the shift, they would have been "other". For the formulas behind each factor, see our guide to OEE calculation.
OEE monitoring, OEE software and MES: how they relate
OEE monitoring software is the part closest to the machine: data capture, the live OEE, downtime by cause. A manufacturing execution system adds functions around it, such as planning, work instructions and traceability. Many plants start with monitoring and downtime on one line and add MES functions later, which is the idea behind a light MES. If you are weighing the two, our comparison of OEE and MES sets out where each one starts and stops.
How to choose OEE monitoring software
Ask every vendor the same questions, on one of your own lines rather than in a slide deck:
- How will each machine on this line report run, stop and count, including the old ones and the manual stations?
- Do micro-stops and slow cycles appear on their own, or are they averaged into run time?
- How does an operator add the reason for a stop, and how long does it take on the floor?
- What happens to a stop nobody classified? Is there a way to see what happened?
- Can the system show the loss in money, with our selling prices and margins?
- Which screens does each role see: the line, the shift lead, the plant manager?
- When a stop needs maintenance, how does the request reach the technician?
- From which day will this line show live data, and what do we need to prepare?
Common mistakes with OEE monitoring
- Starting with the dashboard: a good looking screen fed by unreliable signals loses the team's trust in a week. Start with capture.
- Too many stop reasons: a list of forty reasons gets the first one picked every time. Keep it short enough to use with gloves on.
- Ignoring short stops: they rarely appear in manual logs, yet they often make up a large share of performance loss.
- Monitoring without a review: the number only moves when someone owns the top loss each week.
- Connecting every line at once: one line, measured honestly, teaches more than ten lines with gaps in the data.
Where Fabrico fits
Fabrico is a cloud-based MES and OEE platform for manufacturers. It calculates availability, performance and quality for each line and shift, live from machine signals, and operators tag the cause of each stop on a tablet or phone. Machines connect through existing PLCs, Fabrico IoT sensors or cameras, and AI cameras cover the stations and stops that signals miss. Every loss is also shown in money, and with maintenance management built in, a stop reason can be configured to open a maintenance task automatically in the same system; people can also create tasks by hand. Installing and connecting the devices on your machines takes about one month, and the full rollout is complete in 3 to 4 months.
Book a demo to see it on a line like yours, or contact us with a question.
Frequently asked questions
What is the difference between OEE tracking and OEE monitoring?
OEE tracking is the record of runs, stops and counts over time. OEE monitoring is the live view built on that record, so the shift can react to a loss while it is still happening.
What is an OEE monitoring system?
It is the combination of data capture on the machines, the OEE calculation, the reasons for each stop and the screens and reviews that turn the numbers into action.
Can I monitor OEE on machines without a PLC?
Yes. Older machines can be fitted with an IoT device and external sensors, and AI cameras can count output and detect stops at stations with no machine signal.
Do I need an MES to monitor OEE?
No. OEE monitoring is often the first step, and MES functions such as planning or traceability can be added later as part of a light MES.
How long does it take to start OEE monitoring with Fabrico?
Installing and connecting the devices on your machines takes about one month, and the full rollout is complete in 3 to 4 months.
Related articles

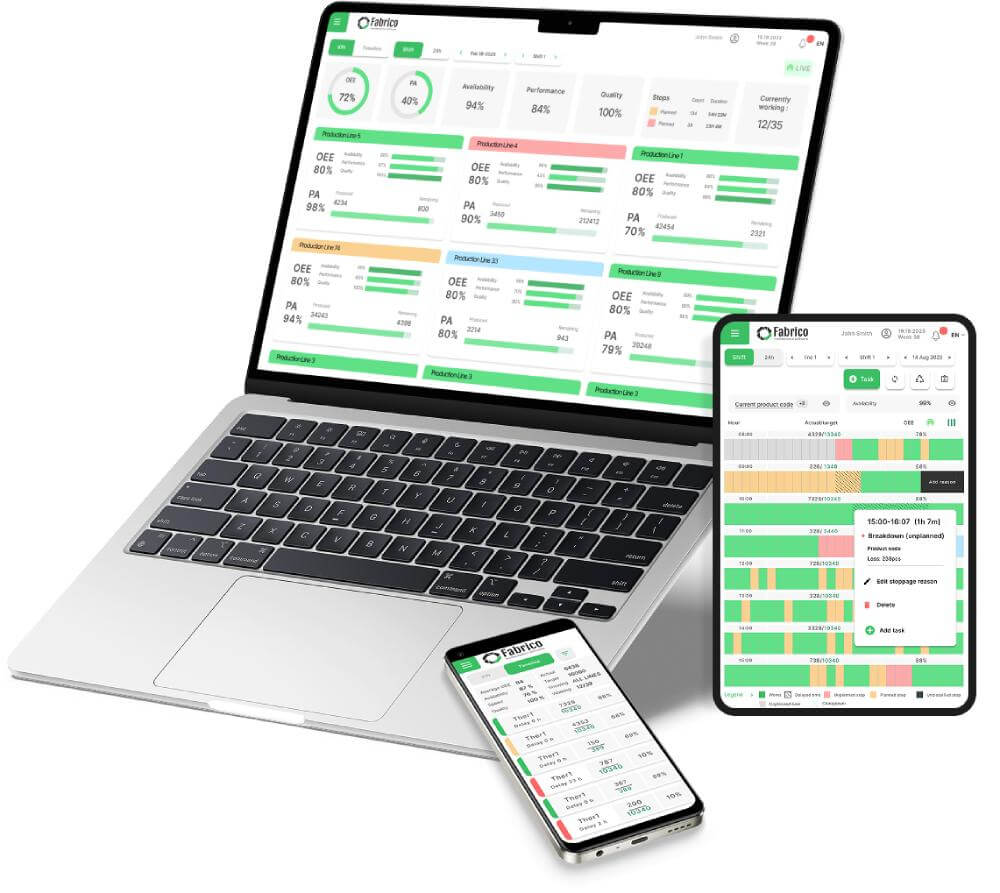












Real Fabrico tiles, sample data.