


 Login
 Blog
Computer Vision for FMCG Manufacturing: Cameras Across Sites and SKUs

In short: computer vision for FMCG manufacturing does two jobs: inspection systems check packs for defects, and OEE cameras count output where a line has no usable machine signal, such as a hand-pack promo station, so every line and every site reports into one OEE and one loss tree.
- Inspection checks labels, codes, fill levels and seals. An OEE camera counts output and lets you watch the moment behind a stop. Different vendors, different jobs.
- On many FMCG lines, much of the lost time sits at the packaging end: short stops, SKU changeovers and waits at manual steps. Put cameras only where the machine signal is blind.
- Pilot one representative line, fix the definitions and the loss tree centrally, then copy that template to every line, site and co-packer.
- Fabrico takes stops and counts from the machine signal and stop reasons from the operator. AI camera counting is an add-on on request. Camera-suggested stop reasons are roadmap.
This page is for operations directors, CI leads and plant managers who run FMCG or CPG lines on more than one site, or plan to. Food and non-food alike.
You probably know your OEE on the lines with a good PLC. The trouble is the rest: the case packer that counts nothing useful, the hand-pack table for this month's promotion, the co-packer that sends a spreadsheet on Friday.
We sell Fabrico, so test what we say here like any other vendor's claims.
Computer vision in FMCG manufacturing: what it does and what it doesn't
Two kinds of camera end up on FMCG lines, and they answer different questions.
| Job | Inspection camera | OEE camera |
|---|---|---|
| Read labels, date codes, barcodes | Yes, its core job | No |
| Check fill level, caps, seals | Yes | No |
| Reject a bad pack | Yes, with a reject arm | No |
| Count output at a manual step | Not its job | Yes |
| Count where a machine has no signal | Not its job | Yes |
| Show the video behind a stop | Not its job | Yes, on the shift timeline |
| Give the stop reason | No | The operator adds it |
Inspection systems from vendors such as Cognex, Keyence or Mettler-Toledo protect the brand and the shopper. An OEE camera protects the hours. Many lines need both.
The two can work together. If the inspection system has a reject count or a reject signal, that count can feed the quality part of OEE like any other counter. Read label and code checks vs OEE cameras for how they sit side by side.
Packaging lines: where FMCG losses pile up
On many FMCG lines the filler, former or bagger is the machine everyone watches. It often has the best PLC on the line, too.
The losses tend to sit downstream. Case packers, wrappers and palletizers stop for a few seconds at a time, block the filler, and nobody writes it down. Changeovers between SKUs take much of the rest.
The cost shows up at plant level. In the Siemens True Cost of Downtime 2024 survey of large industrial firms in four sectors, FMCG was the only one where hours lost to unplanned downtime had not fallen since 2019. Downtime costs per FMCG plant doubled in that time, to just over $10 million a year.
That survey covers unplanned downtime. Short stops and changeover overruns often never reach a downtime log at all, which is why the packaging end is where better measurement pays first. OEE for CPG manufacturing covers the high-speed side of this.
SKU churn, promotions and manual end-of-line steps
New flavors, pack sizes, retailer packs and promotions all land on the same FMCG lines. Three things follow, and each makes measurement harder.
- More changeovers. Each one is a planned stop that still counts against availability, and the total grows quietly. Record start, end and first good pack for every changeover. Changeover standards and SMED in FMCG shows how.
- Missing ideal rates. A new SKU with no agreed rate makes the performance figure meaningless. Set the rule for new SKUs before launch day.
- Manual steps at the end of the line. Multipacks, banded bundles, display trays and gift packs are often packed by hand. These stations have no PLC, so their output is a tally on a sheet.
That last one is the clearest case for a camera. It counts what leaves the hand-pack table, so the station joins the line's OEE. OEE for a manual packing station has the details.
Co-packers: the lines you don't own
Many FMCG brands make part of their range elsewhere. In PMMI's 2024 report on contract packaging and manufacturing, 67% of brand owners planned to maintain or increase their use of contract packers and manufacturers. One reason they gave was to offer a customized product or pack, especially for short or limited runs (48%).
So the promotional pack you planned may run on a line you never see. The central CI team then compares its own plants on OEE and the co-packer on a delivery note.
Nothing goes on a co-packer's line without their agreement. Ask for what your own plants report: counts by hour and stop minutes by reason. A tablet login at the co-packer, or a weekly file in your reason codes that your BI team merges, can be enough to start.
Where a camera goes on an FMCG line
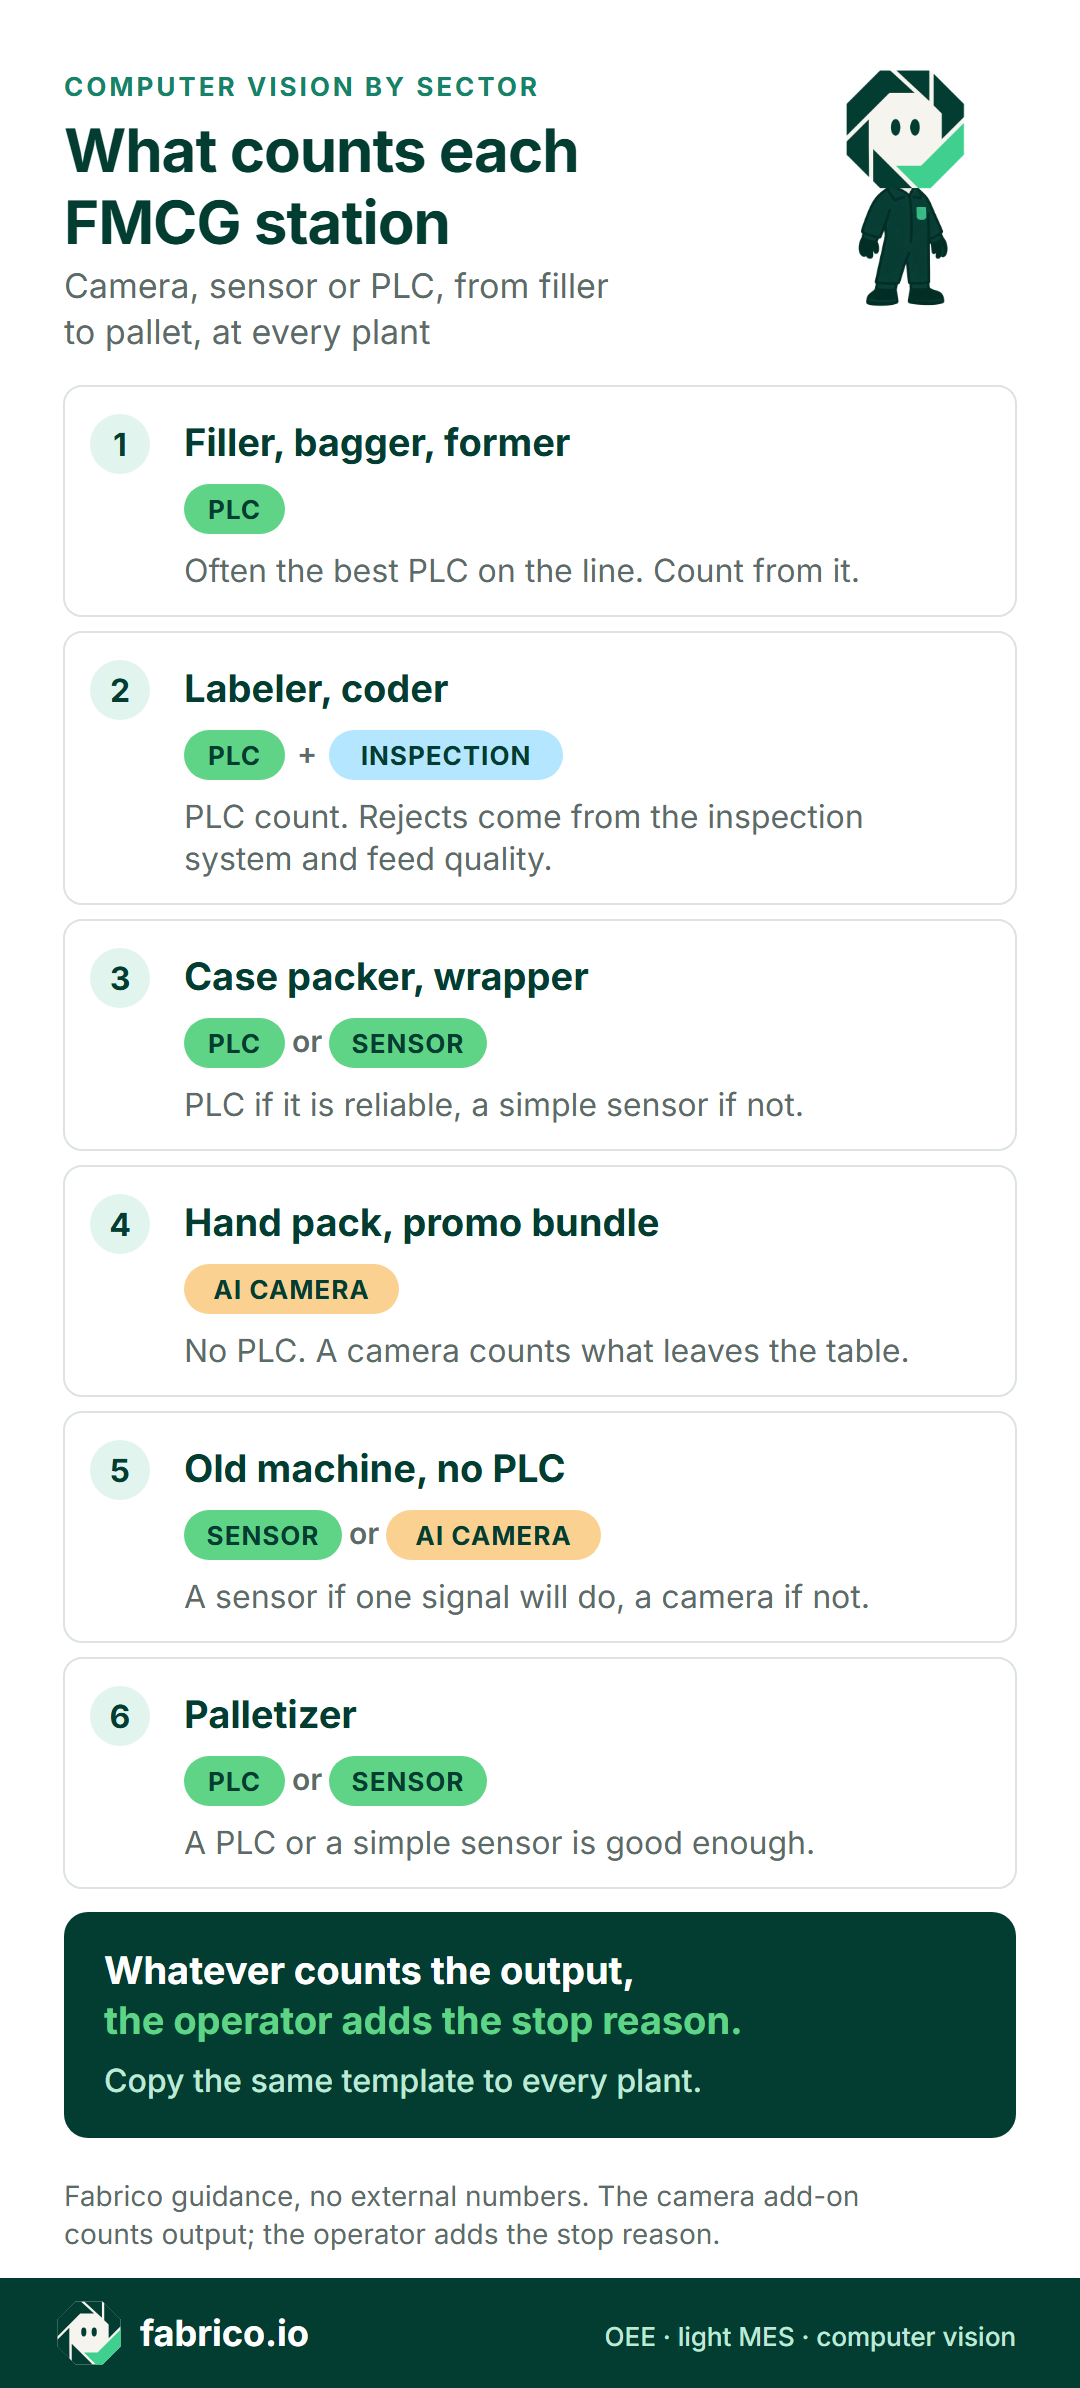
Here is a typical packaging line from filler to pallet. Wherever a PLC or a simple sensor will do, it is cheaper than a camera.
One camera per question is a good rule. If nobody can say what a camera counts, it probably shouldn't be there. For machine-by-machine choices, read camera or sensor for OEE.
Camera, sensor or operator: station by station
| Station | Count from | Stop reason from |
|---|---|---|
| Filler, bagger, former | PLC count | Operator at the line |
| Labeler, coder | PLC count, with rejects from the inspection system | Operator |
| Case packer, wrapper | PLC if it is reliable, a sensor if not | Operator |
| Hand pack, promo bundle | AI camera | Operator or team leader |
| Old machine, no PLC | Sensor if one signal will do, camera if not | Operator |
| Palletizer | PLC or sensor | Operator |
Look at the last column: whatever counts the output, the reason comes from a person at the line. The camera lets them open the video of that moment and check what happened before they choose. It does not choose for them.
Want to map your own stations? Book a demo and bring one line's station list.
One loss tree for every plant
A central CI team wants one thing from all this: to put two sites side by side and trust the gap. That only works if every plant counts the same way.
It matters more as people move on. In polling for PMMI's 2026 report From Complexity to Capability, 79% of the packaging and processing executives polled named workforce knowledge loss, turnover and efficiency loss as an expected drag on productivity. Written definitions outlast the people who wrote them.
| What to agree | Set centrally | Set by each plant |
|---|---|---|
| Loss tree, top two levels | Yes | Adds local detail below |
| Planned time rule | Yes | No |
| Ideal rate per SKU | For shared SKUs | For local SKUs |
| Short stop threshold | Yes | No |
| Changeover start and end | Yes | No |
| Camera positions | A template | Final placement |
Two more rules save arguments later. Add up minutes across lines and sites, and never average the percentages. Show stops with no reason as their own row, so no plant looks better by leaving reasons blank.
Worked example: one SKU, two plants
Here is one shift of sample data on the same multipack SKU at two plants. Both lines have 480 planned minutes and an ideal rate of 100 packs a minute, so the most either could make is 48,000 packs.
Plant A stopped for 96 minutes, so it ran for 384. Availability is 384 of 480, or 80%. It counted 34,560 packs against 38,400 possible in that run time, so performance is 90%. Of those, 34,080 were good, so quality is 98.6%. OEE is 34,080 of 48,000, or 71.0%.
Plant B stopped for 144 minutes and ran for 336. Availability is 70%. It counted 30,240 of 33,600 possible, so performance is also 90%. Of those, 29,760 were good, so quality is 98.4%. OEE is 29,760 of 48,000, or 62.0%.
Nearly all of the 9 point gap comes from 48 extra stop minutes. Longer changeovers add 30 and stops with no reason add 24. Short stops add 4, and Plant B waited 10 minutes less for material.
So the order of work is clear: get reasons on Plant B's blank stops first, then send in the SMED team. Where Plant B has a camera on the line, the team leader can open the video for each blank stop and add the reason, instead of guessing at it the next morning. If Plant B's hand-pack table had no count at all, its OEE could not be trusted and the comparison would fall apart. That is where a camera earns its place. The full method is in OEE calculation.
How to pilot one line, then scale to every site
- Pick one representative line. Not the best, not the worst. Ideally your bottleneck, with at least one blind station such as a hand-pack table.
- Write the definitions first. Loss tree, planned time, ideal rates and the short stop threshold, signed off by the central team.
- Keep today's log as the baseline, so you can compare like with like.
- Put cameras only at the blind stations. Connect the rest by PLC or sensor.
- Talk to the works council before the first camera.
- Decide on a fixed date. Scale, change or stop, against exit criteria set at the start: count accuracy against a manual count, reason coverage, and losses priced in money.
- Scale in waves. The rest of the pilot plant first, then a second plant with a different machine park, then the others. Copy the template, not the project.
The full plan, with a checklist, is in our computer vision OEE pilot guide. If you are weighing a wider system, MES for mid size FMCG plants covers what to start with and what to skip.
By sector: where to read next
The loss tree works for food and non-food plants. Each sector's machines get their own deep dive.
| Sector | Read next | What it covers |
|---|---|---|
| Food | OEE in food and beverage | Changeovers, sanitation, short stops |
| Beverage | Filler OEE on a bottling line | The machine that sets the pace |
| Personal care | Shampoo and tube line stops | Short stops across many SKUs |
| Household | OEE for detergent filling lines | Foam, caps, frequent changeovers |
| Bakery | Bakery bagging line stops | Slicer, bagger, clip closer |
| Dairy | Yogurt cup filler stops | Cup drop, seal, lid faults |
For the wider software picture, see OEE software for food, beverage and FMCG, our comparison of OEE software for consumer goods, and the general guide to OEE software.
What to ask any vendor before you choose
Run these with every vendor, us included, using one plant's real station list and last week's shifts.
| Ask | How to test the answer |
|---|---|
| Where does each count come from? | Go station by station: PLC, sensor, camera or person. Any station left to a person stays a tally sheet. |
| Can every plant run one loss tree? | Ask to see two sites side by side on the same reason codes. |
| How does a new SKU get its ideal rate? | Ask what happens on launch day if nobody has set a rate. |
| How do lines and plants add up? | Give two lines with different planned time. Check that minutes are added, not percentages averaged. |
| Where do stops with no reason go? | They should show as their own row, not vanish from the chart. |
| Can a co-packer report into the same view? | Ask what they would need: a login, a tablet, a sensor, a camera or a file. |
| What does the camera keep, and who sees it? | Get it in writing: streamed or kept, for how long, and who has access. |
| How does the data leave? | Ask for the API, webhooks and export your group BI team will use. |
Privacy and works councils
A camera that counts packs will also see hands and, if badly placed, faces.
- Point the camera at the product and the conveyor, not at the operator.
- Tell the works council or employee representatives before the first camera, and show them what it sees.
- Put up a sign at every station with a camera.
- Agree in writing who can open the video, and why.
- Run a data protection impact assessment where the law asks for one, and check the rules in each country you run plants in.
Our guide to cameras on the production line without surveilling people goes further.
Where Fabrico fits
Fabrico is a cloud OEE and light MES platform. What it does today, what is an add-on, and what is not there yet:
- Stops and counts: from the machine signal, through a PLC, sensor or counter. The operator adds the stop reason at the line on a tablet or phone.
- OEE and losses: OEE, downtime and losses by line and shift, with losses shown in money. On the web, iOS and Android.
- Your data: it leaves through a REST API, webhooks and Excel or CSV export, so a group BI team can use it.
- Camera add-on, on request: AI cameras count output, including at manual steps and on machines with no usable signal. You can open the camera video for any moment on the shift timeline. In the standard setup the video is streamed on request, not stored in Fabrico.
- Roadmap: camera-detected stops, jam zones and camera-suggested stop reasons. None of these is live today.
- Not part of Fabrico: quality inspection of labels, codes, fill levels or seals. Keep your inspection system and feed its reject count into OEE. For production planning, ask us in the demo.
What measuring every line can do in an FMCG plant: Ficosota, a Bulgarian maker of hygiene, tissue and household products, put all 16 of its lines on OEE in Fabrico. From June to September 2026, OEE across those lines rose from 53.11% to 59.62%. Good output went from 10.49M to 12.92M units a month, and unclassified stop time fell from 3.20% to 0.40%. The case study covers OEE, not the camera add-on. Ficosota is also an investor in Fabrico, as our investment announcement explains, so weigh the figures with that in mind.
Bring one plant's station list, and ask us which stations we would count with a camera and which we would not.
Computer vision by FMCG sector
Each sector page covers where a camera earns its place on that sector's lines, what stays with the PLC or the inspection system, and what to ask vendors.
- Food manufacturing
- Beverage and bottling lines
- Breweries
- Dairy processing
- Bakeries
- Confectionery and chocolate
- Meat and poultry
- Seafood
- Ready meals
- Fresh produce packing
- Egg packing
- Coffee
- Pasta
- Canned food
- Supplements
- Cosmetics and personal care
- Household products
- Co-packers
- Packaging converters
What people ask next
What is computer vision used for in FMCG manufacturing?
Two jobs. Inspection systems check labels, codes, fill levels and seals. OEE cameras count output where no machine signal exists and show the moment behind a stop.
Can an AI camera tell us why the line stopped?
Not in Fabrico today. The operator adds the reason, and the camera video of that moment helps them pick the right one. Camera-suggested stop reasons are on our roadmap. Ask any vendor to show this live on your own footage, not on a slide.
How do we compare OEE across plants fairly?
Agree one loss tree, one planned time rule and one short stop threshold for every plant. Add up minutes, never average percentages, and keep stops with no reason as their own row.
Can computer vision work at a co-packer?
Only with the co-packer's agreement, and it is best written into the contract. A first step can be a tablet login at the co-packer, or a weekly file in your reason codes that your BI team merges. A camera makes sense where their pack-out has no count.
What drives the cost of a camera rollout across FMCG plants?
The number of lines and cameras, mounting, the network at each station, and training. Give every vendor the same line list and ask what each quote includes. Fabrico does not publish prices, so ask us the same way.
Do the cameras record our operators?
The camera sees whatever is in its frame, which can include hands and arms. In Fabrico's standard setup, video is streamed on request and not stored in Fabrico. Point cameras at the product, not at faces, and agree access rules with the works council before the first camera goes up.
Want to see it on your line? Book a demo and bring one plant's station list.
Related articles




Real Fabrico tiles, sample data.